Comprehensive ELISA Protocol for Food Allergen Detection: Principles, Methods, and Validation Strategies
This article provides a detailed guide to the Enzyme-Linked Immunosorbent Assay (ELISA) for food allergen detection, tailored for researchers, scientists, and drug development professionals.
Comprehensive ELISA Protocol for Food Allergen Detection: Principles, Methods, and Validation Strategies
Abstract
This article provides a detailed guide to the Enzyme-Linked Immunosorbent Assay (ELISA) for food allergen detection, tailored for researchers, scientists, and drug development professionals. It covers the foundational immunology and regulatory landscape (Intent 1), outlines step-by-step methodologies for both sandwich and competitive ELISA formats (Intent 2), addresses common troubleshooting and optimization techniques to enhance sensitivity and specificity (Intent 3), and discusses critical validation parameters, including comparison with LC-MS/MS and PCR methods (Intent 4). The goal is to deliver a practical, current, and scientifically rigorous resource for developing robust allergen testing protocols in food safety and diagnostic development.
Understanding Food Allergens and ELISA Fundamentals: Principles and Regulatory Framework
Application Notes
Major Food Allergen Proteins and Their Characteristics
Food allergens are typically water-soluble glycoproteins ranging from 10 to 70 kDa, resistant to digestion and food processing. The "Big 9" account for over 90% of all documented food allergies.
Table 1: Major Food Allergen Proteins, Families, and Key Characteristics
| Allergen Source | Major Allergen Proteins (IUIS Designation) | Protein Family | Molecular Weight (kDa) | Key Characteristics |
|---|---|---|---|---|
| Milk | Bos d 4 (α-lactalbumin), Bos d 5 (β-lactoglobulin), Bos d 6 (serum albumin), Caseins | Lipocalin, Secretoglobins, Phosphoproteins | 14-67 | Heat-labile (whey) & heat-stable (caseins); conformational (whey) & linear (casein) epitopes. |
| Egg | Gal d 1 (ovomucoid), Gal d 2 (ovalbumin), Gal d 3 (conalbumin/ovotransferrin) | Serpin, Transferrin | 28-77 | Ovomucoid is heat- and protease-resistant; dominant allergen. |
| Peanut | Ara h 1, Ara h 2, Ara h 3, Ara h 6 | Cupin (7S & 11S globulin), Conglutin, Prolamin | 14.5-63.5 | Extremely stable; Ara h 2 is a major marker for IgE reactivity. |
| Tree Nuts | Cor a 9 (hazelnut), Jug r 1 (walnut), Ana o 3 (cashew) | 11S globulin, 2S albumin, Vicilin | 14-60 | High cross-reactivity within tree nuts due to homologous proteins (e.g., storage proteins). |
| Soy | Gly m 4, Gly m 5, Gly m 6 | PR-10 (Bet v 1 homologue), 7S & 11S globulin | 17-52 | Gly m 4 cross-reacts with Birch pollen (Oral Allergy Syndrome). |
| Wheat | Tri a 19 (ω-5-gliadin), Tri a aA_TI (α-amylase/trypsin inhibitor) | Prolamin (Gliadin), CM proteins | 13-65 | Gluten proteins (gliadins/glutenins) are involved in both allergy and celiac disease. |
| Fish | Gad c 1 (cod), Sal s 1 (salmon) - both parvalbumins | Parvalbumin | 10-13 | Highly conserved calcium-binding protein; major pan-allergen causing fish cross-reactivity. |
| Crustacean Shellfish | Pen m 1 (shrimp tropomyosin), Cra c 1 | Tropomyosin | 34-38 | Muscle protein; highly conserved invertebrate pan-allergen (cross-reacts with mites, insects). |
Epitopes and Cross-Reactivity Mechanisms
Epitopes: Allergenic epitopes are categorized as conformational (dependent on 3D structure) or linear (sequential amino acids). Stability determines clinical severity.
Table 2: Epitope Types and Cross-Reactivity Drivers in Food Allergens
| Feature | Conformational Epitopes | Linear/Sequential Epitopes | Basis of Cross-Reactivity |
|---|---|---|---|
| Structure Dependence | Dependent on native protein folding. | Independent of folding; sequence-based. | Protein family homology (e.g., PR-10, Tropomyosin, Parvalbumin). |
| Stability | Destroyed by denaturation (heat, pH). | Resistant to denaturation and digestion. | Shared homologous IgE-binding regions (>70% sequence identity often indicates clinical cross-reactivity). |
| Detection Challenge | ELISA may fail if extraction denatures protein. | Detectable even in processed foods. | Leads to false positives in IgE tests (sensitization vs. clinical allergy). |
| Common Examples | Bet v 1 homologues (e.g., Gly m 4 in soy). | Peanut Ara h 2, milk caseins, gluten peptides. | Birch pollen (Bet v 1) with apple (Mal d 1), hazelnut (Cor a 1); Tropomyosin across crustaceans, mites, cockroach. |
Protocols
Protocol 1: Sandwich ELISA for Quantification of a Major Allergen (e.g., Ara h 2 in Peanut)
Principle: A capture antibody specific to the target allergen is coated on the plate. The allergen in the sample is bound and detected by a second, labeled antibody.
Materials:
- Research Reagent Solutions Toolkit:
- Coated Microplate: 96-well plate pre-coated with anti-Ara h 2 monoclonal antibody (capture). Function: Immobilizes allergen from sample.
- Allergen Standard: Purified, quantified native or recombinant Ara h 2 protein. Function: Generates calibration curve.
- Detection Antibody: Biotinylated anti-Ara h 2 monoclonal antibody (different epitope than capture). Function: Binds captured allergen.
- Streptavidin-Poly-HRP Conjugate: Function: Amplifies signal by binding multiple biotins, catalyzing colorimetric reaction.
- TMB Substrate (3,3',5,5'-Tetramethylbenzidine): Function: HRP chromogenic substrate, turns blue upon oxidation.
- Stop Solution (1M Sulfuric Acid): Function: Stops HRP reaction, changes TMB to yellow.
- Extraction Buffer: PBS containing 1% Tween-20, 1% BSA, 2M NaCl. Function: Efficiently extracts allergenic proteins while reducing non-specific binding.
- Wash Buffer: PBS with 0.05% Tween-20. Function: Removes unbound reagents.
Procedure:
- Sample Preparation: Homogenize 1g food sample with 10mL extraction buffer. Centrifuge at 4500 x g for 15 min at 4°C. Filter supernatant (0.45 µm).
- Assay Setup: Add 50µL of standard (0.5-50 ng/mL) or sample extract to designated wells in duplicate. Include blank (extraction buffer). Incubate 60 min at 25°C on plate shaker.
- Wash: Aspirate and wash plate 4x with 300µL wash buffer using an automated plate washer.
- Detection: Add 50µL biotinylated detection antibody (1:5000 dilution in extraction buffer). Incubate 60 min at 25°C. Wash 4x.
- Signal Amplification: Add 50µL streptavidin-poly-HRP (1:10000 dilution). Incubate 30 min at 25°C in the dark. Wash 6x.
- Color Development: Add 50µL TMB substrate. Incubate 15 min at 25°C in the dark.
- Stop Reaction: Add 50µL stop solution.
- Measurement: Read absorbance at 450 nm within 30 min.
- Analysis: Generate a 4-parameter logistic (4PL) standard curve. Calculate allergen concentration in samples via interpolation. Express as mg allergen/kg food.
Protocol 2: Competitive ELISA for Detection of Hydrolyzed/Denatured Allergens
Principle: Used for small peptides or denatured proteins where sandwich format fails. Free allergen in sample competes with a fixed amount of labeled allergen for binding to limited antibody sites.
Procedure:
- Coat Plate: Coat plate with 100µL/well of purified target allergen (2 µg/mL in carbonate buffer, pH 9.6). Incubate overnight at 4°C. Block with 1% BSA/PBS.
- Pre-incubate: Mix equal volumes of sample extract (or standard) and primary antibody (monoclonal, specific for a linear epitope) at predetermined dilution. Incubate 60 min at 37°C.
- Apply Mixture: Transfer 50µL of pre-incubated mixture to the coated, blocked plate. Incubate 45 min at 25°C. (Free antibody binds plate allergen; antibody bound to sample allergen is blocked).
- Wash & Detect: Wash 4x. Add 50µL/well HRP-conjugated anti-species secondary antibody. Incubate 45 min. Wash 4x.
- Develop & Analyze: Add TMB, stop, read at 450 nm. Inverse relationship: Higher sample allergen concentration leads to lower signal. Plot %B/B0 vs. log(concentration).
Diagrams
Diagram 1: Molecular Basis of Allergen Cross-Reactivity
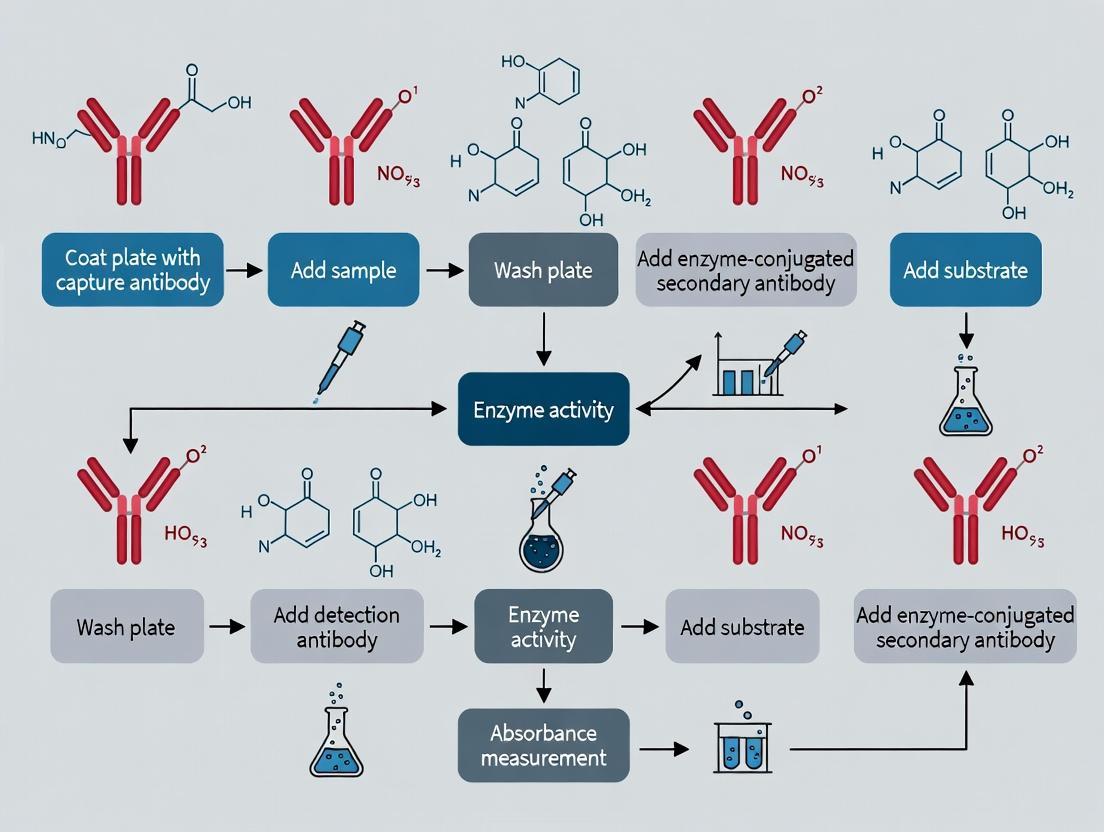
Diagram 2: Sandwich ELISA Workflow for Allergen Detection
The Scientist's Toolkit: Key Reagents for Allergen ELISA
| Reagent | Function in ELISA | Critical Specification |
|---|---|---|
| Monoclonal Capture Antibody | Specific immobilization of target allergen from complex food matrix. | High affinity (low Kd), recognizes stable (preferably linear) epitope, low cross-reactivity. |
| Certified Reference Allergen Standard | Calibration curve generation for absolute quantification. | Pure, native-like structure, accurately quantified (e.g., via amino acid analysis). |
| Biotinylated Detection Antibody | Binds captured allergen at a non-competing epitope for detection. | High specificity, matched pair with capture Ab, optimal biotin-to-antibody ratio. |
| Streptavidin-Poly-HRP Conjugate | Signal amplification via high-enzyme loading per binding event. | High specific activity, low non-specific binding. |
| Matrix-Matched Blank & Control Materials | Accounts for matrix interference and validates assay performance. | Certified allergen-free material identical to test samples (e.g., gluten-free flour). |
| Allergen-Specific Extraction Buffer | Maximizes protein recovery while maintaining epitope integrity. | Optimized pH, ionic strength, and detergents for specific allergen class (e.g., high salt for gluten). |
Within the broader thesis on developing robust ELISA protocols for food allergen detection research, this document details the core immunological principles and practical methodologies. The enzyme-linked immunosorbent assay (ELISA) remains a cornerstone technique, relying fundamentally on the specificity and affinity of antibody-antigen interactions. Accurate detection of trace allergens, such as peanut Ara h 1, soy Gly m 5, or milk caseins, is critical for food safety and public health. This application note provides updated protocols and key considerations for researchers and drug development professionals engaged in allergen analysis.
Core Immunological Principles: Antibody-Antigen Kinetics
The sensitivity and specificity of an allergen-specific ELISA are governed by the kinetics of the antibody-antigen binding event. Key parameters include affinity (KD), cross-reactivity, and matrix interference.
Table 1: Key Kinetic Parameters for Common Allergen-Antibody Pairs
| Allergen Target | Typical Monoclonal Antibody Clone | Reported Affinity (KD) | Common Cross-Reactivity Concerns |
|---|---|---|---|
| Peanut (Ara h 1) | 2C12 | 1.8 x 10⁻⁹ M | Other legume proteins (e.g., lupin) |
| Milk (Casein) | 3H6 | 3.5 x 10⁻¹⁰ M | Caseins from different mammalian species |
| Gluten (Gliadin) | R5 | 2.1 x 10⁻⁹ M | Related prolamins in rye, barley |
| Egg (Ovomucoid) | 2G5 | 6.7 x 10⁻¹¹ M | None significant |
| Soy (Gly m 5) | 1D1 | 4.3 x 10⁻⁹ M | Pea, other legumes |
Detailed Protocols
Direct Sandwich ELISA for Quantification of Peanut Allergen (Ara h 1)
Principle: A capture antibody specific to Ara h 1 is immobilized on a microplate. The allergen in the sample is bound and subsequently detected by a conjugated detection antibody targeting a different epitope.
Materials & Reagents: See "The Scientist's Toolkit" (Section 5). Protocol:
- Coating: Dilute monoclonal anti-Ara h 1 capture antibody (Clone 2C12) in 50 mM carbonate-bicarbonate buffer, pH 9.6, to 2 µg/mL. Add 100 µL per well to a 96-well microplate. Seal and incubate overnight at 4°C.
- Washing: Aspirate and wash plate 3x with 300 µL/well PBS containing 0.05% Tween 20 (PBST). Blot dry on absorbent paper.
- Blocking: Add 200 µL/well of blocking buffer (1% BSA in PBST). Incubate for 2 hours at 37°C. Wash as in Step 2.
- Sample & Standard Addition: Prepare a standard curve of purified Ara h 1 in antigen-free food matrix extract (range: 0.1 - 100 ng/mL). Add 100 µL of standards or prepared sample extracts per well. Incubate for 1 hour at 37°C. Wash 5x with PBST.
- Detection Antibody Addition: Add 100 µL/well of HRP-conjugated detection antibody (Clone 4F10) at 0.5 µg/mL in blocking buffer. Incubate for 1 hour at 37°C. Wash 5x with PBST.
- Signal Development: Add 100 µL/well of TMB substrate solution. Incubate for 15 minutes at room temperature in the dark.
- Reaction Stop: Add 50 µL/well of 2M H2SO4.
- Measurement & Analysis: Read absorbance immediately at 450 nm using a microplate reader. Generate a 4-parameter logistic (4PL) standard curve to interpolate sample concentrations.
Competitive ELISA for Processed Allergen Detection
Principle: Used for detecting small, denatured, or fragmented allergens. Free allergen in the sample competes with a fixed amount of plate-coated allergen for binding to a labeled primary antibody.
Protocol Summary:
- Coat plates with 100 µL/well of purified allergen (5 µg/mL) in coating buffer overnight at 4°C.
- Block as in 3.1.
- Pre-mix constant concentration of HRP-labeled anti-allergen antibody with serially diluted standard or sample extract. Incubate for 30 min at 37°C.
- Transfer 100 µL of the mixture to the coated plate. Incubate for 45 min at 37°C. Wash.
- Develop with TMB, stop, and read. Signal is inversely proportional to allergen concentration in the sample.
Visualizing Workflows and Interactions
Title: Sandwich ELISA Workflow for Allergen Detection
Title: Competitive ELISA Binding Principle
The Scientist's Toolkit
Table 2: Essential Research Reagent Solutions for Allergen ELISA
| Item | Function & Specification | Example/Catalog Considerations |
|---|---|---|
| High-Affinity Capture/Detection Antibodies | Provide specificity. Mouse/rabbit monoclonal pairs targeting different, stable epitopes are preferred for sandwich assays. | Must be validated for lack of cross-reactivity with related food proteins. |
| Purified Native/Recombinant Allergen | Serves as positive control, standard, and coating antigen. Purity >95% is critical for accurate standardization. | Source (natural vs recombinant) can affect antibody recognition. |
| Matrix-Matched Blank | A food matrix (e.g., cookie, chocolate) confirmed allergen-free. Used for standard curve dilution to account for interference. | Essential for accurate quantification in complex food samples. |
| HRP or AP Conjugation Kits | For labeling detection antibodies. Horseradish Peroxidase (HRP) is most common. | Ensure kit preserves antibody affinity post-conjugation. |
| Enhanced Chemiluminescent (ECL) or Chromogenic Substrate (TMB) | Generates measurable signal. TMB is common for colorimetric assays. | ECL offers higher sensitivity for trace allergen detection. |
| Blocking Agent (BSA, Casein, etc.) | Reduces non-specific binding. Choice depends on allergen; e.g., avoid casein for milk assays. | Must be free of the target allergen. |
| Extraction Buffer (PBS, Commercial Cocktails) | Efficiently recovers allergen from food. May contain reducing agents or denaturants for processed foods. | Composition significantly impacts extraction efficiency and assay compatibility. |
The development and validation of an ELISA protocol for food allergen detection is fundamentally governed by international and regional regulatory standards. These standards define the analytes of concern, establish threshold levels for action, and mandate labeling requirements, thereby directly shaping the analytical targets and performance criteria (e.g., sensitivity, specificity) of the immunoassay. This document details the key regulations and provides application notes for aligning ELISA development with Codex Alimentarius, the U.S. Food Allergen Labeling and Consumer Protection Act (FALCPA), and the European Union's Food Information for Consumers Regulation.
Table 1: Core Regulatory Parameters for Major Food Allergens
| Regulatory Body | Standard/Regulation | Number of Mandatory Listed Allergens | Key Threshold Concept | Quantitative Reference Dose/Action Level (Current as of 2024) |
|---|---|---|---|---|
| Codex Alimentarius | General Standard for the Labelling of Prepackaged Foods (CXS 1-1985) | 8 (+ gluten, sulphites) | "Shall be declared" when present as ingredient or processing aid. | No universal numerical threshold. Endorses allergen risk management (ALOP) and use of reference doses like VITAL. |
| United States | Food Allergen Labeling and Consumer Protection Act (FALCPA) | 8 (+ sesame as of 2023) | "Major food allergen" requiring plain language declaration. | No federally set threshold. FDA uses "action levels" for advisory labeling; e.g., Gluten-free: <20 ppm gluten. |
| European Union | Regulation (EU) No 1169/2011 (Food Information for Consumers) | 14 | "Annex II substances or products causing allergies or intolerances" requiring emphasized listing. | No universal numerical threshold. EU Reference Laboratory recommends action levels (e.g., 0.5 - 5 mg/kg protein) for precautionary labeling. |
Table 2: Specific Allergen Lists by Jurisdiction
| Allergen Source | Codex Alimentarius | USA (FALCPA) | European Union (FIC) |
|---|---|---|---|
| Cereals | Gluten-containing cereals (wheat, rye, barley, oats) | Wheat | Cereals containing gluten (wheat, rye, barley, oats, spelt, kamut) |
| Crustaceans | Crustacea | Crustacean shellfish | Crustaceans |
| Eggs | Eggs | Eggs | Eggs |
| Fish | Fish | Fish | Fish |
| Peanuts | Peanuts | Peanuts | Peanuts |
| Soybeans | Soybeans | Soybeans | Soybeans |
| Milk | Milk | Milk | Milk |
| Tree Nuts | Tree nuts | Tree nuts (almond, walnut, etc.) | Tree nuts (almond, hazelnut, etc.) |
| Mustard | - | - | Mustard |
| Celery | - | - | Celery |
| Sesame | - | Sesame* | Sesame |
| Lupin | - | - | Lupin |
| Molluscs | - | - | Molluscs |
| Sulphites | Sulphites >10 mg/kg | Sulphites >10 ppm | Sulphites >10 mg/kg |
| Note | *Added by FASTER Act (2021), effective Jan 1, 2023. |
Experimental Protocols for ELISA Development & Validation Aligned with Regulations
Protocol 1: ELISA Kit Calibration Using Certified Reference Materials (CRMs) for Regulatory Alignment
Objective: To establish a calibration curve traceable to regulatory thresholds using matrix-matched CRMs. Materials: See "The Scientist's Toolkit" (Section 5). Method:
- CRM Reconstitution: Reconstitute certified allergen protein CRMs (e.g., gliadin, beta-lactoglobulin, Ara h 1) per manufacturer's instructions.
- Matrix-Matched Standard Preparation: Prepare a blank food matrix (e.g., cookie, broth) confirmed negative for the target allergen via screening. Generate a serial dilution of the CRM in the blank matrix extract to create standards covering 0, 1, 2, 5, 10, 20, 50 ppm (mg allergen protein/kg food) range.
- ELISA Assay: Perform assay per kit instructions. Include kit-provided standards for comparison.
- Curve Fitting & LOD/LOQ Calculation: Fit a 4- or 5-parameter logistic curve. Calculate Limit of Detection (LOD) as mean blank + 3SD, and Limit of Quantification (LOQ) as mean blank + 10SD. Ensure LOQ is below relevant regulatory action levels (e.g., <5 ppm for many allergens).
- Cross-Reactivity Check: Test standards of phylogenetically related allergens (e.g., other tree nuts for almond assay) to determine kit specificity as mandated by regulatory need for accurate declaration.
Protocol 2: In-House Validation for FDA FALCPA Compliance Testing
Objective: To validate an in-house ELISA for detection of a major allergen (e.g., milk casein) in a baked product, meeting FDA guidelines for analytical validation. Method:
- Specificity: Test against the full FALCPA list (where cross-reactivity is plausible) and common matrix ingredients. Acceptable cross-reactivity <1%.
- Precision (Repeatability & Reproducibility):
- Spike blank matrix at low (near LOQ), medium, and high concentrations (n=6 each).
- Analyze within a run (repeatability) and across different days/operators (reproducibility).
- Calculate %CV. Target CV <20% at low spike, <15% at mid/high.
- Accuracy/Recovery: Using the same spikes, calculate % recovery. Acceptable range: 80-120%.
- Robustness: Deliberately vary key parameters (incubation time ±10%, temperature ±2°C). The result must remain within precision criteria.
- Sample Analysis for Label Claim Verification: Analyze commercial products with "Contains: Milk" labels and those with "May Contain" statements. Report quantitative results in ppm protein.
Regulatory-Informed Experimental Workflow Diagrams
Diagram 1: ELISA Development Workflow Guided by Regulations (92 chars)
Diagram 2: Direct Sandwich ELISA Principle for Allergen Detection (85 chars)
The Scientist's Toolkit: Research Reagent Solutions
Table 3: Essential Materials for Regulatory-Aligned Allergen ELISA
| Item | Function & Rationale |
|---|---|
| Certified Reference Materials (CRMs) | Purified allergen proteins (e.g., from NIST, IRMM). Essential for creating traceable calibration curves to validate kit accuracy against regulatory thresholds. |
| Matrix-Matched Blank Materials | Food matrices (cookie, chocolate, sausage) verified allergen-free. Critical for preparing realistic standards and evaluating recovery, as matrix effects are a major source of ELISA error. |
| Monoclonal/Polyclonal Antibody Pairs | High-affinity, specific antibodies against stable allergen epitopes (e.g., heat-resistant proteins). Specificity must be checked against the full regulatory allergen list to avoid false positives. |
| Validated Extraction Buffer | Buffer optimized for complete and reproducible allergen protein recovery from complex, processed foods, often containing surfactants and reducing agents. |
| Commercial Allergen ELISA Kit (Validated) | For method comparison. Should have validation data (AOAC, ELISA Consortium) showing performance meeting Codex or EU guidelines for the intended matrix. |
| Multi-Allergen Spiked Samples | In-house or commercially prepared samples with known, low levels of multiple allergens. Used for rigorous specificity testing mandated by regulations. |
Within the framework of a thesis on ELISA protocol development for food allergen detection, a fundamental strategic decision is the definition of the analytical target. The choice is binary: targeting a specific protein marker (e.g., Ara h 1 for peanut) versus the entire allergenic food source (e.g., "peanut" as a commodity). This decision underpins all subsequent methodological steps, from antibody selection to result interpretation. Specific protein assays offer precise etiological insight but may underestimate total allergen load. Food source-targeted assays aim for comprehensive detection but can suffer from cross-reactivity and variable protein composition. This application note details the experimental protocols to evaluate both approaches, providing a framework for researchers to select the optimal strategy for their specific food safety or clinical research question.
Table 1: Comparison of Analytical Target Strategies in Food Allergen ELISA
| Parameter | Specific Protein Target (e.g., Ara h 1) | Food Source Target (e.g., Total Peanut) |
|---|---|---|
| Primary Antibody Specificity | Monoclonal, epitope-specific | Polyclonal or monoclonal blend, protein mixture-reactive |
| Detection Limit (Typical) | 0.1 - 0.5 ppm (of the specific protein) | 0.5 - 2.0 ppm (of the food matrix) |
| Cross-Reactivity Risk | Low (if epitope unique) | High (to related species, e.g., lupin) |
| Impact of Food Processing | High (epitope destruction alters recovery) | Variable (targets multiple, potentially stable proteins) |
| Quantification Basis | ng/mL of specific protein | ppm of food commodity (via calibrated standard) |
| Clinical Correlation | Direct (with IgE reactivity to that protein) | Indirect (reflects overall exposure to source) |
| Regulatory Utility | For specific protein risk assessment | For "contains" declaration compliance (e.g., Codex) |
Table 2: Exemplary Recovery Data from Spiked Food Matrix (Cookie Dough)
| Target | Spike Level (ppm food) | Mean Recovery (%) | CV (%) |
|---|---|---|---|
| Ara h 1 (Peanut) | 1.0 | 85.2 | 7.1 |
| 5.0 | 91.5 | 5.8 | |
| 10.0 | 89.7 | 4.3 | |
| Total Peanut (Blend) | 1.0 | 112.4 | 12.3 |
| 5.0 | 105.6 | 9.7 | |
| 10.0 | 98.2 | 6.5 | |
| Bos d 5 (Milk β-lactoglobulin) | 2.5 | 78.9 | 8.9 |
| Total Milk Casein | 2.5 | 95.1 | 10.1 |
Experimental Protocols
Protocol A: Sandwich ELISA for a Specific Allergenic Protein (e.g., Ara h 1) Objective: To detect and quantify a specific allergenic protein in a processed food extract. Key Materials: See "Scientist's Toolkit" (Table 3). Procedure:
- Coating: Dilute monoclonal capture antibody specific to Ara h 1 in carbonate-bicarbonate coating buffer (pH 9.6) to 2 µg/mL. Add 100 µL/well to a 96-well microplate. Incubate overnight at 4°C.
- Blocking: Aspirate coating solution. Wash plate 3x with PBS + 0.05% Tween 20 (PBST). Add 200 µL/well of blocking buffer (1% BSA in PBS). Incubate for 1 hour at 37°C. Wash 3x with PBST.
- Sample & Standard Addition: Prepare Ara h 1 purified protein standard in dilution buffer (0.1% BSA in PBST) in a 2-fold serial dilution (e.g., 50 to 0.78 ng/mL). Prepare food extracts in dilution buffer. Add 100 µL of standard or sample per well in duplicate. Incubate for 2 hours at 37°C. Wash 5x with PBST.
- Detection Antibody Addition: Add 100 µL/well of biotinylated detection antibody (anti-Ara h 1, different epitope) diluted in dilution buffer. Incubate for 1 hour at 37°C. Wash 5x with PBST.
- Enzyme Conjugate Addition: Add 100 µL/well of streptavidin-HRP conjugate diluted in dilution buffer. Incubate for 30 minutes at 37°C in the dark. Wash 5x with PBST.
- Substrate Reaction & Stop: Add 100 µL/well of TMB substrate. Incubate for 15 minutes at RT in the dark. Stop reaction with 50 µL/well of 2M H₂SO₄.
- Measurement & Analysis: Read absorbance at 450 nm immediately. Generate a 4-parameter logistic standard curve. Interpolate sample concentrations and correct for dilution/extraction factors.
Protocol B: Competitive ELISA for Total Allergenic Food Source (e.g., Total Peanut) Objective: To detect and quantify total peanut protein in complex food matrices, targeting multiple proteins. Key Materials: See "Scientist's Toolkit" (Table 3). Procedure:
- Coating with Protein Extract: Dilute defatted peanut protein extract (or a representative blend of purified proteins) in coating buffer to 5 µg/mL. Add 100 µL/well. Incubate overnight at 4°C.
- Blocking: As per Protocol A, step 2.
- Competition Reaction: Pre-mix equal volumes of food extract (or peanut protein standard) and a fixed, limiting concentration of anti-peanut polyclonal antibody (or antibody cocktail) in dilution buffer. Let pre-mix incubate for 30 minutes at RT. Add 100 µL of this mixture per well. Incubate for 1 hour at 37°C. Wash 5x with PBST. (Note: The more analyte in the sample, the less antibody binds to the coated plate).
- Detection Antibody Addition: Add 100 µL/well of HRP-conjugated secondary antibody (e.g., anti-rabbit IgG) specific to the primary antibody species. Incubate for 1 hour at 37°C. Wash 5x with PBST.
- Substrate Reaction & Stop: As per Protocol A, step 6.
- Measurement & Analysis: Read absorbance at 450 nm. Generate a standard curve using peanut protein standard. Note: Signal is inversely proportional to analyte concentration.
Diagrams
Diagram 1: Analytical Target Decision Logic for Allergen ELISA
Diagram 2: Specific Protein vs. Food Source ELISA Workflow
The Scientist's Toolkit
Table 3: Essential Research Reagent Solutions for Allergen ELISA Development
| Reagent/Material | Function | Example for Specific Protein | Example for Food Source |
|---|---|---|---|
| Capture Molecule | Binds the target analyte in the solid phase. | Monoclonal antibody (mAb) against a specific epitope (e.g., anti-Ara h 1 mAb). | Food protein extract or a blend of mAbs against multiple proteins from the source. |
| Detection Antibody | Binds the captured analyte, enabling detection. | Biotinylated mAb against a different epitope on the same protein. | Polyclonal antibody (pAb) raised against the total food extract. |
| Reference Standard | Calibrates the assay for quantitative analysis. | Highly purified, characterized native or recombinant protein (e.g., rAra h 1). | Defatted, quantified protein extract from the authentic food (e.g., NIST RM 2387 Peanut Butter). |
| Blocking Buffer | Prevents non-specific binding to the plate. | Protein-based solution (e.g., 1% BSA or casein in PBS). | Often requires optimized blockers to reduce matrix interference (e.g., 1% Fish Gelatin). |
| Enzyme Conjugate | Generates a measurable signal. | Streptavidin-Horseradish Peroxidase (HRP). | HRP-conjugated secondary antibody (e.g., anti-rabbit IgG-HRP). |
| Food Extraction Buffer | Recovers proteins from complex food matrices. | PBS-based buffer, often with additives (e.g., Tween 20, NaCl) for specific protein solubility. | Must be robust for multiple proteins; may contain reducing agents (e.g., 2-ME) for disulfide bonds. |
The Role of ELISA in Allergen Risk Assessment and Management Plans
Within the thesis "Development and Validation of Novel ELISA Protocols for Multi-Allergen Detection in Complex Food Matrices," this application note details the critical function of Enzyme-Linked Immunosorbent Assay (ELISA) in structured allergen management. ELISA provides the quantitative, sensitive, and specific data required to implement science-based risk assessment and control strategies, forming the cornerstone of preventive public health measures and regulatory compliance.
ELISA in the Allergen Management Framework
ELISA data directly informs key stages of a comprehensive Allergen Management Plan (AMP), from hazard identification to verification of control measures.
Diagram: ELISA Integration in Allergen Management
Key Quantitative Data from Recent Studies
The performance of ELISA kits is paramount. The following table summarizes recent evaluation data for commercial kits targeting common allergens.
Table 1: Performance Metrics of Select Commercial ELISA Kits (2023-2024)
| Allergen Target | Kit Manufacturer (Example) | Limit of Detection (LOD) | Quantitative Range | Recovery in Complex Food (%) | Cross-Reactivity Concerns |
|---|---|---|---|---|---|
| Peanut (Ara h 1/2/3) | ELISA Systems | 0.25 ppm (µg/g) | 1 - 50 ppm | 85-110 (Chocolate) | Other legumes (e.g., lupin) <1% |
| Milk (Casein/BLG) | R-Biopharm AG | 0.5 ppm | 2 - 40 ppm | 80-105 (Sausage) | Ruminant milks only |
| Gluten (Gliadin) | Neogen Corporation | 1.0 ppm | 5 - 80 ppm | 75-95 (Heat-Processed) | None with official cocktails |
| Hazelnut (Cor a 9) | Ingenaza | 0.1 ppm | 0.5 - 25 ppm | 70-100 (Cookie) | Walnut, some seed proteins |
| Soy (Gly m 5/Gly m 6) | Morinaga Institute | 0.3 ppm | 1 - 100 ppm | 90-115 (Oil, Lecithin) | Pea protein (variable) |
Detailed Protocol: Validation of an ELISA for Surface Monitoring
This protocol is a core experiment within the thesis, designed to validate an ELISA for the detection of residual milk protein on shared production equipment.
4.1. Title: Protocol for the Validation and Application of a Casein-Specific ELISA in Environmental Swab Monitoring.
4.2. Principle: Swab samples are collected from defined surface areas. Proteins are extracted from the swab and analyzed using a sandwich ELISA. A casein-specific capture antibody bound to the plate immobilizes the antigen, which is detected by a labeled detection antibody, generating a signal proportional to contamination.
4.3. Materials & Reagents (The Scientist's Toolkit) Table 2: Essential Research Reagent Solutions for Surface Monitoring ELISA
| Item | Function & Specification |
|---|---|
| Casein-Specific ELISA Kit | Provides pre-coated plates, standards, conjugated antibodies, and buffers. Validated for food matrix. |
| Protein Swab Kits | Swabs with validated elution buffers (e.g., phosphate-based with surfactants) for efficient protein recovery. |
| Reference Material (Skim Milk Powder) | Certified reference material for preparing in-house control and spike solutions. |
| Blocking Buffer (5% BSA/PBS) | Blocks non-specific binding sites on the ELISA plate wells. |
| Microplate Washer & Reader | Automated washer for consistent stringency; reader capable of 450nm (and 620nm reference) absorbance. |
| Statistical Software | For 4- or 5-parameter logistic curve fitting of standard data and data analysis. |
4.4. Experimental Workflow Diagram
4.5. Step-by-Step Methodology
- Swab Collection: Using a template, swab a 10 cm x 10 cm area of cleaned equipment. Include a positive control (surface spiked with 1 µg casein) and a negative control (swab of clean area).
- Sample Elution: Place the swab head into 5 mL of extraction buffer from the swab kit. Vortex vigorously for 2 minutes, then incubate on a rotator for 15 minutes at room temperature. Centrifuge to clarify.
- ELISA Procedure:
- Prepare casein standards (0, 0.5, 2, 5, 10, 20 ppm) in extraction buffer.
- Pipette 50 µL of standards and prepared swab samples into duplicate wells of the pre-coated microplate.
- Incubate 60 minutes at room temperature (RT) on a plate shaker.
- Wash plate 5x with wash buffer.
- Add 50 µL of enzyme-conjugated detection antibody to each well. Incubate 60 minutes at RT on shaker.
- Wash plate 5x.
- Add 100 µL of TMB substrate. Incubate for exactly 15 minutes at RT in the dark.
- Add 100 µL of stop solution. Read absorbance at 450 nm within 15 minutes.
- Data Analysis: Generate a standard curve by plotting mean absorbance against casein concentration. Fit data using a 4-parameter logistic curve. Interpolate sample concentrations. Report as µg of protein per swab, and convert to µg/100 cm².
Critical Considerations for Risk Assessment
- Matrix Effects: Always validate recovery in the specific matrix being tested (e.g., swab solution, baked goods, acidic sauces).
- Calibrator Matching: The standard curve must be prepared in a solution that mimics the sample matrix to avoid under/over-recovery.
- Action Levels: ELISA data must be interpreted against pre-defined, risk-based action levels (e.g., ≥ 1 µg/100 cm² requires re-cleaning).
- Multi-Target Strategy: For allergens like peanut, which have multiple relevant proteins (Ara h 1, 2, 3, 6), using an ELISA that detects a combination or a robust marker protein is essential for accurate risk assessment.
Step-by-Step ELISA Protocols: From Sample Preparation to Data Analysis
Sample Collection and Homogenization Strategies for Complex Food Matrices
Within the broader thesis on developing robust ELISA protocols for food allergen detection, the initial steps of sample collection and homogenization are critical. Complex food matrices present significant challenges due to variability in composition, fat content, protein solubility, and the presence of interfering substances. Inaccurate or inconsistent sample preparation directly compromises the validity of subsequent immunoassay results, leading to potential false negatives or positives. This document details application notes and standardized protocols to ensure representative and homogeneous samples, thereby enhancing the reliability of ELISA-based allergen detection research.
Foundational Principles for Representative Sampling
The goal is to obtain a laboratory sample that accurately represents the entire lot or batch of food product. Key statistical and practical considerations must be applied.
Table 1: Sampling Plans Based on Food Matrix Type and Lot Size
| Matrix Category | Example Foods | Recommended Sampling Method | Minimum Number of Incremental Samples (for 10kg lot) | Composite Sample Mass for Lab |
|---|---|---|---|---|
| Homogeneous Liquids | Milk, juices, oils | Agitation followed by random volume sampling | 5 | 500 mL |
| Particulate Dry Solids | Flour, powder blends, spices | Cone and quartering or mechanical riffling | 10 | 1 kg |
| Heterogeneous Solids | Cookies, cereal bars, baked goods | Random stratified sampling from multiple batches | 15 (entire units) | 1 kg (ground) |
| Multi-phase/Emulsions | Peanut butter, dressings, chocolate | Complete homogenization before subsampling | 8 | 500 g |
| Frozen/Raw Composite | Frozen meals, raw meat mixtures | Cryogenic grinding of entire stratified units | 12 | 1 kg |
Detailed Homogenization Protocols
Protocol 2.1: General Homogenization for Semi-Solid and Solid Matrices
Objective: To comminute and uniformly disperse the target analyte(s) within a stabilizing extraction buffer. Materials: Analytical balance, sterile spoons/spatulas, high-speed blender with disposable blades or stainless steel container (e.g., Stomacher bags), centrifuge, pH meter, extraction buffer (e.g., PBS containing 0.5% Tween-20, 0.5% BSA, and protease inhibitors, pH 7.4). Procedure:
- Weigh 10 ± 0.1 g of the composite sample into a pre-labeled sterile homogenization bag or blender jar.
- Add extraction buffer at a 1:9 (w/v) ratio (10g sample + 90mL buffer).
- Homogenize at high speed (e.g., 12,000 rpm) for 2 minutes. For Stomacher systems, process for 5 minutes at normal speed.
- Transfer the slurry to a 50 mL conical tube. Centrifuge at 4,500 x g for 15 minutes at 4°C to pellet insoluble debris.
- Carefully collect the intermediate layer, avoiding top lipid and bottom pellet layers. Filter through a 0.45 μm syringe filter if necessary.
- Aliquot the supernatant (extract) and store at -20°C or lower until ELISA analysis. Perform analysis in duplicate.
Protocol 2.2: Cryogenic Milling for High-Fat/Low-Moisture Matrices
Objective: To prevent smear-heating and preserve labile proteins during size reduction of challenging matrices like chocolate or nuts. Materials: Liquid nitrogen, Dewar flask, cryogenic mill (e.g., Spex Geno/Grinder), pre-chilled polycarbonate vials and impactors, mortar and pestle (pre-chilled). Procedure:
- Submerge a representative 50g sample in liquid nitrogen for 5 minutes to embrittle.
- Transfer the frozen sample to a pre-chilled milling vial with an impactor. Add liquid nitrogen to the vial chamber.
- Mill for 2 cycles of 1 minute each, allowing 30 seconds of cooling between cycles.
- Transfer the fine, frozen powder to a pre-chilled container. Weigh out a subsample for immediate extraction per Protocol 2.1.
Protocol 2.3: Enzymatic Digestion for Matrices with Encapsulated Allergens
Objective: To release protein allergens trapped within a carbohydrate or protein matrix (e.g., fermented or hydrolyzed foods). Materials: Incubator/shaker, pepsin or trypsin (for proteinaceous matrices), amyloglucosidase (for starchy matrices), relevant digestion buffers. Procedure:
- Prepare a 1:10 (w/v) initial homogenate in appropriate digestion buffer (e.g., 0.05M HCl for pepsin).
- Add enzyme to a final concentration of 1% (w/w of sample protein). Incubate with agitation (e.g., 37°C, 1-2 hours).
- Terminate digestion by adjusting pH to 7.4 with NaOH or by heat inactivation (95°C, 5 min).
- Centrifuge and filter as in Protocol 2.1. Note: Validate that ELISA antibodies recognize the digested epitopes.
Table 2: Homogenization Efficiency Evaluation Metrics
| Evaluation Method | Technique/Measurement | Target Performance Indicator |
|---|---|---|
| Particle Size Analysis | Laser diffraction, sieve analysis | >95% of particles < 100 μm |
| Analyte Distribution | ELISA of multiple aliquots from same homogenate | Coefficient of Variation (CV) < 15% |
| Protein Recovery | BCA assay pre- and post-centrifugation | Recovery > 85% in supernatant |
| Inhibitor Assessment | Standard addition/spike recovery in matrix | Recovery of 80-120% for target analyte |
The Scientist's Toolkit: Key Research Reagent Solutions
Table 3: Essential Materials for Sample Preparation in Allergen Detection
| Item | Function & Rationale |
|---|---|
| Stomacher Bags (Filter Bags) | Allows for sterile, contained paddle-blender homogenization, preventing cross-contamination and aerosol generation. |
| Cryogenic Mill & Vials | Enables pulverization of tough, fatty, or heat-sensitive samples without degrading target protein epitopes. |
| Stabilizing Extraction Buffer (PBS+) | Provides isotonic, buffered environment to solubilize proteins, inhibit proteases, and reduce non-specific binding. |
| Protease Inhibitor Cocktail (e.g., PMSF, AEBSF) | Preserves native protein allergens from degradation by endogenous food enzymes during processing. |
| Lipid Removal Agents (e.g., Hexane, Acetone) | Used in defatting steps for high-fat matrices (e.g., peanut butter) to reduce ELISA interference and improve protein solubility. |
| Centrifugal Filter Units (MWCO 10kDa) | Concentrates dilute protein extracts and exchanges buffer to optimal ELISA conditions, removing small molecule interferents. |
| Certified Reference Materials (CRM) | Incurred or spiked food matrices with known allergen concentrations, essential for validating the entire sample prep and ELISA protocol. |
Visualized Workflows
Workflow for Allergen ELISA Sample Prep
Homogenization Strategy Decision Tree
Within the broader thesis on developing robust ELISA protocols for food allergen detection, the selection of an optimal extraction buffer is a critical foundational step. The efficiency of allergen detection is fundamentally limited by the efficacy of the initial protein recovery from complex food matrices. Suboptimal extraction leads to false negatives, while matrix effects cause false positives or quantification inaccuracies. These Application Notes detail the systematic evaluation of extraction buffers to maximize protein recovery and minimize matrix interference, focusing on common allergenic foods like peanut, milk, egg, and tree nuts in processed products.
Key Buffer Compositions & Theoretical Basis
The performance of a buffer depends on its ability to solubilize target proteins, maintain their immunoreactivity, and reduce the co-extraction of interfering compounds (e.g., polyphenols, fats, tannins).
Table 1: Common Allergen Extraction Buffer Compositions and Rationale
| Buffer Name | Key Components | Primary Function & Rationale | Typical pH |
|---|---|---|---|
| PBS (Phosphate-Buffered Saline) | Sodium phosphate, NaCl. | Isotonic, mild; preserves protein conformation but poor at disrupting food matrices. | 7.4 |
| Carbonate-Bicarbonate Buffer | Sodium carbonate, Sodium bicarbonate. | Alkaline pH enhances solubility of many globular allergens (e.g., peanut Ara h 1). | 9.6 |
| Reducing Buffer (e.g., with DTT) | PBS + Dithiothreitol (DTT) or 2-Mercaptoethanol. | Reduces disulfide bonds, aiding extraction of oligomeric allergens (e.g., cashew Ana o 2) from aggregated complexes. | 7.4-8.0 |
| Competitive Buffer (e.g., with BSA or Skim Milk) | PBS + 1% Bovine Serum Albumin or Skim Milk Powder. | Competes for binding sites of polyphenols and tannins, reducing their interference with target proteins. | 7.4 |
| Commercial Urea / Thiourea Buffer | High concentrations of Urea, Thiourea, CHAPS. | Powerful denaturants; solubilizes very hydrophobic or cross-linked proteins from highly processed foods. | 8.0-8.5 |
| Simulated Gastric Fluid | Pepsin, NaCl, HCl. | Models physiological digestion; assesses stability and detectable epitopes of allergens post-consumption. | 1.2-3.0 |
Experimental Protocol: Comparative Evaluation of Extraction Buffers
Objective: To quantitatively compare the recovery of a target allergen (e.g., peanut Ara h 3) and the magnitude of matrix effects from a baked cookie matrix using five different extraction buffers.
Materials & Reagents:
- Incurred baked cookie material (with known, graded levels of peanut flour).
- Certified peanut protein reference material.
- Candidate Buffers: PBS, Carbonate-Bicarbonate, Reducing Buffer (PBS+50mM DTT), Competitive Buffer (PBS+1% BSA), Urea Buffer (6M Urea, 2M Thiourea in Tris).
- Centrifuge, vortexer, orbital shaker.
- Protein assay kit (e.g., BCA).
- Sandwich ELISA kit for peanut (targeting Ara h 3/6).
Procedure:
- Sample Preparation: Homogenize control (peanut-free) and incurred cookie samples. Weigh 1.0 g ± 0.01 g into 50mL conical tubes.
- Extraction: Add 10 mL of each test buffer to separate tubes (n=5 per buffer). Vortex vigorously for 30 seconds.
- Agitation: Shake on an orbital shaker at room temperature for 60 minutes.
- Clarification: Centrifuge at 4,500 x g for 20 minutes at 4°C. Carefully collect the intermediate supernatant layer, avoiding top lipid and bottom pellet layers.
- Protein Quantification (Total Recovery): Perform BCA assay on a diluted aliquot of each extract. Calculate total soluble protein recovered (mg/g food).
- Allergen-Specific Quantification (ELISA): Dilute extracts appropriately in the ELISA kit's provided dilution buffer to mitigate buffer chemistry interference. Perform sandwich ELISA in duplicate. Record measured allergen concentration (ppm).
- Matrix Effect Assessment: Prepare calibration standards of the purified peanut protein in each extract buffer using the control (peanut-free) cookie extract as the matrix. Compare slope and linear range to the standard curve prepared in the ELISA kit's buffer.
Data Presentation & Analysis
Table 2: Quantitative Recovery and Matrix Effects for Peanut Allergen from Baked Cookie
| Extraction Buffer | Total Protein Recovery (mg/g food) ± SD | Measured Allergen (ppm) ± SD | Apparent Recovery vs. Known Incurred Level | Matrix Effect (Signal Suppression/Enhancement vs. Kit Buffer) |
|---|---|---|---|---|
| PBS | 12.5 ± 1.2 | 8.5 ± 2.1 | 28% | Significant Suppression (-45%) |
| Carbonate-Bicarbonate | 18.7 ± 2.1 | 25.3 ± 3.8 | 84% | Moderate Suppression (-20%) |
| Reducing (PBS+DTT) | 21.3 ± 1.8 | 29.8 ± 2.9 | 99% | Low Suppression (-10%) |
| Competitive (PBS+BSA) | 16.4 ± 1.5 | 27.1 ± 3.5 | 90% | Minimal Suppression (-5%) |
| Urea/Thiourea | 35.6 ± 3.4 | 15.4 ± 4.7 | 51% | Severe Enhancement (+80%) & High Background |
Interpretation: The Reducing and Competitive buffers provided the best balance of high, accurate allergen recovery and minimal matrix effects for this baked matrix. While the Urea buffer solubilized the most total protein, it likely denatured epitopes and introduced severe interferences in the immunoassay. PBS performed poorly, failing to disrupt the matrix.
The Scientist's Toolkit: Research Reagent Solutions
Table 3: Essential Reagents for Allergen Extraction Studies
| Item | Function in Extraction Studies |
|---|---|
| Certified Allergen Reference Materials | Provides a definitive quantitative standard for calculating recovery efficiency and calibrating in-matrix curves. |
| Incurred Reference Materials | Food matrices with allergen incorporated before processing; the gold standard for evaluating extraction of altered, embedded proteins. |
| Polyvinylpolypyrrolidone (PVPP) | Insoluble polymer that binds and removes phenolic compounds, reducing tannin-induced protein precipitation and epitope masking. |
| Tween 20 or Triton X-100 | Non-ionic detergents that help solubilize lipid-associated allergens and reduce non-specific binding in subsequent ELISA. |
| Protease Inhibitor Cocktails | Essential for protecting labile protein epitopes from degradation by endogenous food proteases during extended extraction. |
| Reducing Agents (DTT, TCEP) | Break disulfide bonds to dissociate protein aggregates, crucial for recovering allergens from heat-processed foods. |
Visualized Workflows and Relationships
Title: Allergen Extraction & Analysis Workflow
Title: Challenges & Buffer Solutions for Allergen Recovery
Detailed Protocol for Sandwich ELISA (for Intact Allergen Proteins)
This protocol details a sandwich enzyme-linked immunosorbent assay (ELISA) optimized for the quantification of intact, conformational allergen proteins in complex food matrices. Within the broader thesis on ELISA methodologies for food allergen detection, this protocol addresses the critical need for specificity towards the native, three-dimensional structure of the allergen, which is essential for accurate risk assessment of allergenic potential. The assay employs two antibodies targeting distinct epitopes on the intact protein, ensuring high specificity and reduced cross-reactivity with hydrolyzed or denatured fragments.
Key Research Reagent Solutions
| Reagent / Material | Function & Rationale |
|---|---|
| Capture Antibody | High-affinity monoclonal antibody specific to a conformational epitope of the target allergen. Coated onto the plate to immobilize the antigen. |
| Detection Antibody | Biotinylated monoclonal antibody targeting a different conformational epitope. Provides specificity and enables signal amplification. |
| Protein Standard | Purified, native-structure allergen protein. Used to generate the calibration curve. Critical for accurate quantification. |
| Streptavidin-HRP | Enzyme conjugate. Binds to biotin on the detection antibody. High-affinity interaction enables significant signal amplification. |
| Blocking Buffer | (e.g., 1% BSA or 3% Skim Milk in PBS). Saturates unused binding sites on the plate to minimize non-specific background. |
| Chromogenic Substrate | TMB (3,3’,5,5’-Tetramethylbenzidine). HRP catalyzes its color change to blue, measurable at 450nm (after acid stop). |
| Wash Buffer | PBS or Tris-based buffer with 0.05% Tween 20. Removes unbound reagents, reducing background and improving precision. |
| Microplate | High-binding 96-well polystyrene plate. Ensures efficient adsorption of the capture antibody. |
Detailed Protocol
Coating (Day 1)
- Dilute the capture antibody to 2–5 µg/mL in carbonate-bicarbonate coating buffer (50 mM, pH 9.6).
- Dispense 100 µL per well into a 96-well microplate.
- Seal the plate and incubate overnight at 4°C.
Blocking and Sample Incubation (Day 2)
- Aspirate the coating solution and wash the plate 3 times with 300 µL/well of wash buffer (PBS + 0.05% Tween-20). Blot dry.
- Add 200 µL of blocking buffer per well. Incubate for 1–2 hours at 25°C (room temperature) with gentle shaking.
- Wash the plate 3 times as in step 3.2.1.
- Prepare samples and standards: Serially dilute the purified allergen standard in sample dilution buffer. Prepare food extracts in an appropriate extraction buffer (e.g., PBS containing 0.5% BSA and 0.05% Tween-20).
- Add 100 µL of standard, sample, or blank (dilution buffer) per well in duplicate or triplicate.
- Seal and incubate for 2 hours at 25°C.
Detection Antibody Incubation
- Wash the plate 5 times thoroughly.
- Dilute the biotinylated detection antibody to the optimal concentration (typically 0.5–1 µg/mL) in blocking buffer.
- Add 100 µL per well. Incubate for 1–2 hours at 25°C.
Enzyme Conjugate Incubation
- Wash the plate 5 times.
- Dilute Streptavidin-HRP conjugate according to manufacturer's recommendation (common dilution range: 1:5,000 to 1:20,000) in blocking buffer.
- Add 100 µL per well. Incubate for 30 minutes at 25°C in the dark.
Substrate Development & Measurement
- Wash the plate 7 times.
- Prepare TMB substrate solution. Add 100 µL per well.
- Incubate in the dark at 25°C for 10–20 minutes, monitoring blue color development.
- Stop the reaction by adding 50 µL of 1M H₂SO₄ per well. The color will change from blue to yellow.
- Measure the absorbance at 450 nm (reference wavelength 620–650 nm) within 30 minutes.
Data Analysis & Performance Metrics
- Calculate the average absorbance for each standard and sample.
- Subtract the average absorbance of the zero standard (blank) from all readings.
- Generate a four-parameter logistic (4PL) standard curve by plotting the mean absorbance against the standard concentration.
- Interpolate sample concentrations from the curve. Multiply by the sample dilution factor for the final result.
Table 1: Representative Standard Curve Data for Peanut Allergen Ara h 1
| Standard Concentration (ng/mL) | Mean Absorbance (450nm) | Standard Deviation |
|---|---|---|
| 0.0 | 0.045 | 0.005 |
| 0.8 | 0.125 | 0.012 |
| 3.1 | 0.320 | 0.025 |
| 12.5 | 0.890 | 0.041 |
| 50.0 | 1.650 | 0.098 |
| 200.0 | 2.100 | 0.110 |
Table 2: Assay Performance Characteristics
| Parameter | Value |
|---|---|
| Limit of Detection (LOD) | ~0.3 ng/mL |
| Limit of Quantification (LOQ) | ~0.8 ng/mL |
| Dynamic Range | 0.8 – 200 ng/mL |
| Intra-assay CV | < 8% |
| Inter-assay CV | < 12% |
| Recovery in Spiked Matrix | 85–110% |
Experimental Workflow Diagram
Diagram 1: Sandwich ELISA workflow steps.
Molecular Binding Schema
Diagram 2: Antibody-antigen binding in sandwich ELISA.
Detailed Protocol for Competitive ELISA (for Processed/Denatured Allergens)
Within the broader thesis research on ELISA-based food allergen detection, the accurate quantification of processed allergens presents a significant challenge. Thermal and non-thermal food processing induces conformational changes, epitope denaturation, and aggregation in allergenic proteins. This compromises the efficacy of standard sandwich ELISAs that rely on two antibodies binding distinct, native epitopes. The Competitive ELISA (cELISA) format is therefore essential, as it utilizes a single antibody specific for a linear or denaturation-resistant epitope, competing between the immobilized target and the allergen in the processed food sample. This protocol details a robust cELISA method optimized for the detection of denatured allergens, such as those found in baked goods, roasted nuts, or hydrolyzed ingredients.
Key Principles and Advantages in Food Allergen Research
The cELISA is based on the competition between a target protein immobilized on the plate and the same protein in the sample for binding to a limited amount of specific antibody. The signal is inversely proportional to the allergen concentration in the sample. For processed allergens, the use of monoclonal antibodies (mAbs) raised against linear, sequential epitopes or polyclonal antibodies (pAbs) purified against denatured proteins is critical. This format offers advantages for thesis work: it is less affected by protein aggregation or fragmentation, can detect small peptides from hydrolyzed allergens, and is often more sensitive for matrices where epitope masking occurs.
Detailed Experimental Protocol
Materials and Reagents
The Scientist's Toolkit: Essential Research Reagent Solutions
| Reagent / Material | Function in Protocol |
|---|---|
| High-Binding 96-Well Microplate | Solid phase for passive adsorption of the target allergen standard. |
| Purified Native or Recombinant Allergen | Used as the coating antigen (capture phase) and for standard curve generation. |
| Monoclonal Antibody (mAb) against Linear Epitope | The primary detection antibody. Must recognize a heat/process-resistant epitope. |
| Food Sample Extract Buffer (PBS with reducing agents, e.g., 2-ME) | Extracts and reduces processed allergens to expose linear epitopes. |
| Blocking Buffer (e.g., 3% BSA or Casein in PBS) | Blocks nonspecific binding sites on the plate after coating. |
| Enzyme-Conjugated Secondary Antibody (Anti-species IgG-HRP) | Binds to the primary antibody for enzymatic signal generation. |
| TMB (3,3',5,5'-Tetramethylbenzidine) Substrate | Chromogenic substrate for HRP, producing a blue color. |
| Stop Solution (1M H₂SO₄ or HCl) | Stops the enzymatic reaction, turning TMB from blue to yellow. |
| Microplate Reader | Measures absorbance at 450 nm (for TMB). |
Protocol Steps
Day 1: Plate Coating
- Coating: Dilute the purified allergen in 0.05 M carbonate-bicarbonate coating buffer (pH 9.6) to a concentration of 1-5 µg/mL. Add 100 µL per well to the microplate. Seal and incubate overnight at 4°C.
Day 2: Competitive Reaction and Detection
- Washing: Empty the plate and wash 3 times with 300 µL/well of PBS containing 0.05% Tween 20 (PBST). Blot dry.
- Blocking: Add 200 µL/well of blocking buffer. Incubate for 2 hours at room temperature (RT) or 37°C. Wash as in step 2.
- Competitive Incubation (Key Step):
- Prepare a mixture containing a constant, pre-determined concentration of primary antibody (typically near its EC₅₀) with either: a) Standard Curve: Serial dilutions of purified allergen in sample extract buffer. b) Test Samples: Extracted and appropriately diluted food samples.
- Pre-incubate this antibody-sample mixture for 30-60 minutes at RT with gentle shaking.
- Transfer 100 µL of each mixture to the allergen-coated wells in duplicate.
- Incubate for 1-2 hours at RT. The antibody binds competitively to the immobilized allergen and the allergen in solution.
- Washing: Wash plate 5 times thoroughly with PBST to remove unbound antibody and sample matrix.
- Secondary Antibody: Add 100 µL/well of enzyme-conjugated secondary antibody diluted in blocking buffer. Incubate for 1 hour at RT. Wash 5 times with PBST.
- Signal Development: Add 100 µL/well of TMB substrate. Incubate in the dark for 10-15 minutes at RT.
- Stop Reaction: Add 50 µL/well of stop solution. The color will change from blue to yellow.
- Measurement: Read the absorbance at 450 nm within 30 minutes.
Data Analysis
- Calculate the mean absorbance for each standard and sample.
- Generate a standard curve by plotting the mean absorbance (y-axis) against the log₁₀ concentration of the competing standard allergen (x-axis). Fit a 4-parameter logistic (4PL) curve.
- Interpolate sample concentrations from the standard curve. Apply the appropriate dilution factor.
- Quantitative Data Summary: Typical cELISA Performance Characteristics
| Parameter | Typical Target Value | Notes for Processed Allergen Detection |
|---|---|---|
| Linear Range | 0.5 - 100 ng/mL | Can vary significantly by allergen-antibody pair. |
| Limit of Detection (LOD) | 0.1 - 2 ng/mL | Defined as mean blank + 3SD. |
| Limit of Quantification (LOQ) | 0.5 - 5 ng/mL | Defined as mean blank + 10SD. |
| Intra-Assay CV | < 10% | Precision within a single plate. |
| Inter-Assay CV | < 15% | Precision across different plates/runs. |
| Recovery in Spiked Processed Matrices | 70 - 120% | Must be validated for each food type (e.g., baked bread, boiled sausage). |
| Cross-Reactivity with Homologues | Assess case-by-case | Critical for species-specific detection (e.g., peanut vs. other legumes). |
Visualization of Protocol and Principles
Title: Competitive ELISA Workflow and Principle
Title: Antibody Choice for Processed Allergen Detection
Critical Considerations for Thesis Research
- Antibody Characterization: The cornerstone of a successful cELISA. Perform epitope mapping or confirm reactivity with blotted, denatured proteins (Western blot).
- Matrix Effects: Processed food matrices (e.g., high fat, polyphenols) can interfere. Optimize extraction buffers and include matrix-matched controls and standard curves.
- Standardization: Use an internationally accepted purified allergen standard if available. Express results in consistent units (µg allergen/g food).
- Validation: This protocol must be rigorously validated per Codex Alimentarius or AOAC guidelines for sensitivity, specificity, accuracy (recovery), and precision (repeatability/reproducibility) in the target processed foods.
Application Notes In the context of ELISA protocol development for food allergen detection, achieving high specificity is non-negotiable to avoid false positives and negatives that compromise food safety. The three pillars of a specific assay are the immobilization of the target antigen, the effective blocking of non-specific sites, and the selection of antibodies with high affinity and minimal cross-reactivity. Recent advancements in recombinant allergen proteins and monoclonal antibody engineering have provided new tools to tackle the challenge of cross-reactivity within protein families (e.g., peanut Ara h 1 vs. other legumes). Furthermore, the choice of blocking agent must be tailored to the allergen-antibody pair; for instance, casein-based blockers may interfere with dairy allergen detection. The quantitative data below summarizes critical parameters from recent studies optimizing these steps for common food allergens.
Table 1: Comparison of Blocking Buffer Efficacy for Allergen-Specific ELISA
| Blocking Buffer | Target Allergen | Non-Specific Binding (OD450) | Specific Signal (OD450) | Signal-to-Noise Ratio |
|---|---|---|---|---|
| 3% BSA/PBS | Peanut (Ara h 2) | 0.12 ± 0.02 | 2.45 ± 0.15 | 20.4 |
| 5% Skim Milk/PBS | Peanut (Ara h 2) | 0.08 ± 0.01 | 1.98 ± 0.12 | 24.8 |
| 1% Fish Gelatin/PBS | Peanut (Ara h 2) | 0.05 ± 0.01 | 2.10 ± 0.10 | 42.0 |
| 3% BSA/PBS | Milk (Casein) | 0.25 ± 0.03 | 1.80 ± 0.10 | 7.2 |
| 5% Skim Milk/PBS | Milk (Casein) | 1.15 ± 0.20 | 2.10 ± 0.15 | 1.8 |
| 1% Fish Gelatin/PBS | Milk (Casein) | 0.10 ± 0.02 | 1.95 ± 0.12 | 19.5 |
Table 2: Antibody Pair Performance for Major Food Allergens
| Allergen | Capture Antibody (Clone) | Detection Antibody (Clone) | Linear Range (ng/mL) | Cross-Reactivity to Related Proteins |
|---|---|---|---|---|
| Peanut (Ara h 1) | mAb 2C12 (Mouse IgG1) | pAb Rabbit anti-Ara h 1 (Biotin) | 2-200 | <0.1% with pea vicilin |
| Gluten (Gliadin) | mAb G12 (Mouse IgG2a) | mAb R5 (Mouse IgG1, HRP) | 5-500 | <0.5% with barley hordein |
| Egg (Ovomucoid) | mAb 3F10 (Mouse IgG1) | mAb 6B2 (Mouse IgG1, HRP) | 1-100 | None detected with bovine serum albumin |
| Shellfish (Tropomyosin) | pAb Goat anti-Pen m 1 | mAb Tmp-1 (Mouse IgG, HRP) | 10-1000 | 15% with moth tropomyosin |
Detailed Protocols
Protocol 1: Allergen-Specific Plate Coating and Blocking
Objective: To immobilize purified food allergen protein onto a microplate while minimizing non-specific binding in subsequent steps.
- Coating: Prepare a coating buffer (0.05 M carbonate-bicarbonate, pH 9.6). Dilute the purified allergen (e.g., recombinant Ara h 2) to a concentration of 2 µg/mL in coating buffer. Add 100 µL per well to a 96-well polystyrene high-binding microplate. Seal the plate and incubate overnight at 4°C.
- Washing: Aspirate the coating solution. Wash the plate three times with 300 µL per well of wash buffer (0.05% Tween-20 in PBS, PBS-T). Blot the plate on clean paper towels to remove residual liquid.
- Blocking: Prepare a blocking buffer of 1% Fish Gelatin in PBS. Note: For milk allergen assays, avoid milk-based blockers. Add 200 µL of blocking buffer per well. Seal and incubate for 2 hours at room temperature (25°C) with gentle shaking.
- Final Preparation: Aspirate the blocking buffer. Wash the plate three times with PBS-T as in step 2. The plate can be used immediately in an ELISA or dried, sealed in a desiccated bag, and stored at 4°C for up to one week.
Protocol 2: Sandwich ELISA for Quantification of Food Allergen
Objective: To detect and quantify a specific food allergen from a processed food extract.
- Sample Addition: Prepare food extracts in appropriate extraction buffer (e.g., PBS containing 0.5% Tween-20 and 2% NaCl). Add 100 µL of standard (serial dilutions of purified allergen) or sample to the coated and blocked wells from Protocol 1. Include blank wells (extraction buffer only). Incubate for 90 minutes at 37°C. Wash plate 5x with PBS-T.
- Detection Antibody Incubation: Dilute the biotinylated or enzyme-conjugated detection antibody (see Table 2 for examples) to its optimal concentration in the same blocking buffer used in step 1.3. Add 100 µL per well. Incubate for 60 minutes at 37°C. Wash plate 5x with PBS-T.
- Signal Development (for HRP): If using an HRP-conjugated antibody, prepare TMB substrate solution. Add 100 µL per well. Incubate in the dark at room temperature for 15-20 minutes. Stop the reaction by adding 50 µL of 2M H2SO4. Read absorbance immediately at 450 nm.
- Data Analysis: Generate a standard curve from the serial dilution OD values using a 4-parameter logistic (4PL) curve fit. Calculate the allergen concentration in unknown samples by interpolation from the standard curve.
Diagrams
Title: ELISA Plate Preparation and Assay Workflow
Title: Molecular Basis of Specificity in Sandwich ELISA
The Scientist's Toolkit: Research Reagent Solutions
| Item | Function & Rationale |
|---|---|
| High-Binding Polystyrene Microplates | Surface treated for optimal passive adsorption of proteins (allergens) via hydrophobic and ionic interactions. |
| Recombinant Purified Allergen Proteins | Essential as standards for calibration and for plate coating. Provides consistency and purity, avoiding cross-reactive impurities found in crude extracts. |
| Allergen-Specific Monoclonal Antibodies (mAbs) | Provide high specificity and reproducibility. Clones like 2C12 (peanut) or G12 (gluten) are selected for minimal cross-reactivity with homologous proteins. |
| Biotinylated or Enzyme-Linked Detection Antibodies | Enable signal amplification. Biotin-Streptavidin systems offer an extra layer of amplification for low-abundance allergens. |
| Non-Mammalian Blocking Agents (e.g., Fish Gelatin) | Inert proteins that occupy non-specific binding sites without interfering with mammalian allergen-antibody systems (critical for dairy, egg, or meat allergens). |
| TMB (3,3',5,5'-Tetramethylbenzidine) Substrate | A sensitive, low-background chromogenic substrate for HRP, producing a blue color measurable at 450nm after acid stop. |
| Food Matrix-Compatible Extraction Buffers | Typically contain salts (NaCl) and detergents (Tween) to efficiently solubilize allergens from complex, processed foods while maintaining epitope integrity. |
Enzyme-Substrate Systems and Spectrophotometric Detection Best Practices
Within the development of Enzyme-Linked Immunosorbent Assay (ELISA) protocols for food allergen detection, the selection of an enzyme-substrate system and the optimization of spectrophotometric detection are critical for achieving high sensitivity, specificity, and a broad dynamic range. This application note details best practices for these components, framed within a thesis focused on quantifying trace allergenic proteins (e.g., from peanuts, milk, or shellfish) in complex food matrices.
Key Enzyme-Substrate Systems for ELISA
The choice of enzyme conjugated to the detection antibody dictates the substrate chemistry and the type of signal generated. The following table compares the most common systems.
Table 1: Common Enzyme-Substrate Systems for Colorimetric ELISA
| Enzyme | Common Substrate | Signal Type | Wavelength (nm) | Key Advantage | Key Disadvantage |
|---|---|---|---|---|---|
| Horseradish Peroxidase (HRP) | 3,3',5,5'-Tetramethylbenzidine (TMB) | Colorimetric (Soluble) | 450 (Abs), 650 (Ref) | Fast kinetics, high sensitivity, non-carcinogenic | Inhibited by sodium azide, thiols; unstable |
| Horseradish Peroxidase (HRP) | 2,2'-Azinobis [3-ethylbenzothiazoline-6-sulfonic acid] (ABTS) | Colorimetric (Soluble) | 405, 414 | Good for kinetic studies, stable product | Lower sensitivity than TMB |
| Alkaline Phosphatase (AP) | p-Nitrophenyl Phosphate (pNPP) | Colorimetric (Soluble) | 405 | Linear reaction, stable enzyme; not inhibited by azide | Slower than HRP/TMB; substrate instability |
| β-Galactosidase | ortho-Nitrophenyl-β-galactoside (ONPG) | Colorimetric (Soluble) | 420, 550 | Low endogenous activity in many samples | Less common, requires different buffers |
Best Practices in Spectrophotometric Detection
Instrument Calibration: Perform a zero (blank) calibration with the reaction stop solution (e.g., 1M H₂SO₄ for TMB) prior to reading plates. Use a dual-wavelength read (e.g., 450 nm with a 540-650 nm reference) to correct for optical imperfections in the microplate. Path Length Correction: For absolute concentration determination, apply a path length correction if using a vertical path photometer, as signal is proportional to the liquid column height. Dynamic Range Validation: Ensure the measured absorbance of the most concentrated standard falls within the linear range of the instrument (typically Abs < 2.0 for most plate readers). Serial dilution of a positive control should be linear on a log-log plot. Data Quality Thresholds: Establish acceptance criteria: the coefficient of determination (R²) for the standard curve should be ≥0.99, and the absorbance of the negative control should be ≤10% of the midpoint standard.
Detailed Protocol: TMB-Based HRP Detection for Allergen ELISA
Objective: To develop a sensitive, colorimetric endpoint detection for a sandwich ELISA detecting a target food allergen (e.g., Ara h 1 from peanut).
Materials:
- Coated and blocked microplate with captured allergen.
- Allergen-specific biotinylated detection antibody.
- Streptavidin-HRP conjugate (typical dilution 1:10,000 to 1:40,000).
- Wash Buffer: PBS with 0.05% Tween-20 (PBST).
- TMB Substrate Solution: Commercially available ready-to-use solution, or prepare from components: 0.4 mg/mL TMB in citrate-phosphate buffer, pH ~5.0, with 0.02% hydrogen peroxide.
- Stop Solution: 1M Sulfuric Acid (H₂SO₄).
- Microplate reader capable of reading at 450 nm.
Procedure:
- After incubation with the biotinylated detection antibody, wash the plate 4 times with 300 µL PBST per well.
- Add 100 µL of the optimized Streptavidin-HRP conjugate dilution to each well. Incubate for 30-60 minutes at room temperature, protected from light.
- Wash the plate 6 times thoroughly with PBST to remove all unbound conjugate.
- Substrate Development: Add 100 µL of TMB substrate solution to each well. Incubate at room temperature, protected from light, for exactly 10-15 minutes or until the mid-range standard develops a medium blue color.
- Reaction Stop: Add 100 µL of 1M H₂SO₄ stop solution to each well. The color will change from blue to yellow. Tap the plate gently to ensure homogeneity.
- Spectrophotometric Read: Read the absorbance at 450 nm within 30 minutes, using a reference wavelength of 650 nm if available.
Visualization of Experimental Workflow
Diagram Title: ELISA Signal Development Workflow
The Scientist's Toolkit: Research Reagent Solutions
Table 2: Essential Materials for Spectrophotometric ELISA
| Item | Function in Allergen ELISA |
|---|---|
| High-Binding 96-Well Microplates | Polystyrene plates with optimized surface for passive adsorption of capture antibodies. |
| Precision Multi-Channel Pipettes | Enables rapid, consistent reagent delivery and washing across the plate, reducing well-to-well variability. |
| Plate Washer (Automated) | Ensures thorough and reproducible washing steps, critical for reducing background noise in high-sensitivity assays. |
| Spectrophotometric Microplate Reader | Measures the absorbance of the colored product, quantifying the amount of captured allergen. |
| Ready-to-Use TMB Substrate | Stable, single-component or two-component formulation that minimizes batch-to-batch variation and development time. |
| Stable Stop Solution (e.g., 1M H₂SO₄) | Halts the enzymatic reaction at a defined timepoint, stabilizing the signal for reading. |
| Certified Allergen Reference Materials | Purified, quantified proteins (e.g., from NIST or other providers) essential for generating accurate standard curves. |
| Blocking Buffer (e.g., 1% BSA or 5% NFDM in PBST) | Blocks non-specific binding sites on the plate and reagents, minimizing false-positive signals. |
Constructing a Standard Curve and Calculating Allergen Concentration (ppm).
1. Introduction within a Thesis Context In a thesis investigating ELISA protocols for food allergen detection, the generation of a precise standard curve is the cornerstone for quantifying specific allergenic proteins (e.g., Ara h 1 in peanut, Bos d 5 in milk) in complex food matrices. This protocol details the construction of a four-parameter logistic (4PL) standard curve using purified allergen standards, which is then used to interpolate the concentration of allergens in unknown samples. Accurate quantification in parts per million (ppm) is critical for assessing compliance with labeling thresholds, validating cleaning procedures, and understanding dose-response relationships in clinical sensitization.
2. Research Reagent Solutions & Essential Materials
| Item | Function in ELISA Standard Curve & Allergen Quantification |
|---|---|
| Purified Allergen Standard | A certified reference material of the target protein (e.g., recombinant Ara h 1). Provides the known concentrations for generating the standard curve. |
| Monoclonal Capture Antibody | Antibody coated onto the microplate, specific to a defined epitope on the target allergen protein. |
| Detection Antibody (Biotinylated) | A second allergen-specific antibody, conjugated to biotin, which binds to a different epitope, forming a "sandwich." |
| Streptavidin-HRP Conjugate | Binds with high affinity to the biotin on the detection antibody, providing an enzyme (Horseradish Peroxidase) for signal generation. |
| Chromogenic Substrate (TMB) | 3,3',5,5'-Tetramethylbenzidine. A colorless substrate converted by HRP into a blue-colored product, measurable spectrophotometrically. |
| Stop Solution (e.g., 1M H₂SO₄) | Acidic solution that halts the HRP-TMB reaction, changing the color from blue to yellow and stabilizing the signal for reading. |
| Sample Extraction Buffer | Typically a PBS-based buffer with additives (e.g., Tween-20, proteins) to efficiently solubilize allergens from food while minimizing matrix interference. |
| Microplate Reader | Instrument to measure the absorbance (Optical Density, OD) of each well, typically at 450 nm (for TMB). |
3. Detailed Protocol: Standard Curve Generation and Sample Analysis
3.1. Reagent and Sample Preparation
- Allergen Standard Stock Solution: Reconstitute the purified allergen standard according to the certificate of analysis. Prepare a high-concentration stock (e.g., 10,000 ng/mL) in the appropriate matrix (e.g., assay buffer or allergen-free food extract).
- Standard Dilution Series: Perform a serial dilution (e.g., 1:2 or 1:3) in assay buffer to generate a minimum of 7 non-zero standard points. A typical range for food allergens is 0.1 to 1000 ng/mL. Include a zero standard (assay buffer only).
- Test Samples: Extract food samples using the validated extraction protocol (e.g., 1:10 w/v in extraction buffer, shake, centrifuge, filter). Prepare appropriate dilutions in assay buffer to fall within the dynamic range of the standard curve.
3.2. Sandwich ELISA Procedure
- Coating: Coat a 96-well microplate with 100 µL/well of capture antibody (diluted in carbonate coating buffer). Incubate overnight at 4°C. Wash 3x with Wash Buffer (PBS + 0.05% Tween-20).
- Blocking: Add 300 µL/well of Blocking Buffer (e.g., 1% BSA in PBS). Incubate for 1-2 hours at room temperature (RT). Wash 3x.
- Antigen Binding: Add 100 µL/well of each standard, sample, and control in duplicate. Incubate for 1-2 hours at RT. Wash 5x.
- Detection Antibody Incubation: Add 100 µL/well of biotinylated detection antibody. Incubate for 1 hour at RT. Wash 5x.
- Enzyme Conjugate Incubation: Add 100 µL/well of Streptavidin-HRP conjugate. Incubate for 30-45 minutes at RT in the dark. Wash 5x.
- Signal Development: Add 100 µL/well of TMB substrate. Incubate for 10-20 minutes at RT in the dark until the top standard develops adequate blue color.
- Reaction Stop: Add 50 µL/well of 1M H₂SO₄. The color will change to yellow.
- Absorbance Measurement: Read the Optical Density (OD) at 450 nm within 30 minutes using a plate reader.
4. Data Analysis and Calculation of Allergen Concentration
4.1. Data Reduction and Curve Fitting
- Calculate the average OD for each standard and sample duplicate.
- Subtract the average OD of the zero standard (blank) from all other average OD values to obtain corrected absorbance.
- Plot the corrected absorbance (y-axis) against the known standard concentrations (x-axis, ng/mL) using graphing software (e.g., GraphPad Prism, R).
- Fit the data to a Four-Parameter Logistic (4PL) curve, the gold standard for immunoassay data. The model is defined as: Y = Bottom + (Top – Bottom) / (1 + (X/EC50)^HillSlope) Where Y = OD, X = Concentration, Top/Bottom = asymptotes, EC50 = inflection point.
4.2. Example Standard Curve Data & Parameters
Table 1: Example Standard Curve Data for a Peanut Allergen (Ara h 1) ELISA
| Standard Point | Concentration (ng/mL) | Mean OD (450 nm) | Corrected OD |
|---|---|---|---|
| S0 (Blank) | 0.0 | 0.052 | 0.000 |
| S1 | 0.78 | 0.089 | 0.037 |
| S2 | 1.56 | 0.135 | 0.083 |
| S3 | 3.13 | 0.241 | 0.189 |
| S4 | 6.25 | 0.483 | 0.431 |
| S5 | 12.5 | 0.945 | 0.893 |
| S6 | 25.0 | 1.562 | 1.510 |
| S7 | 50.0 | 2.010 | 1.958 |
| Curve Fit (4PL) | Parameters | ||
| Top | 2.05 | ||
| Bottom | 0.02 | ||
| EC50 | 12.1 ng/mL | ||
| Hill Slope | -1.02 | ||
| R² | 0.9993 |
4.3. Sample Interpolation and Final ppm Calculation
- Input the corrected OD of the diluted sample into the 4PL equation to solve for the interpolated concentration (X) in ng/mL.
- Multiply the interpolated concentration by the total sample dilution factor. This factor includes the initial extraction (e.g., 1 g in 10 mL = 10x) and any subsequent pre-assay dilutions.
Example Calculation:
- Sample corrected OD = 0.850
- From curve: Interpolated [Allergen] = 11.2 ng/mL
- Sample was diluted 1:50 in assay buffer post-extraction.
- Initial extraction was 1 g food in 10 mL buffer (10x w/v).
- Total Dilution Factor = 10 (extraction) * 50 (assay dilution) = 500.
- Allergen in original sample = 11.2 ng/mL * 500 = 5600 ng/mL = 5.6 µg/mL.
- For a solid sample, assuming a near 1 g/mL density: 5.6 µg/g = 5.6 ppm.
5. Experimental Workflow and Data Analysis Visualization
Title: ELISA Allergen Quantification Workflow from Assay to ppm
Title: Four-Parameter Logistic (4PL) Curve Model and Parameters
Troubleshooting ELISA Assays: Enhancing Sensitivity, Specificity, and Reproducibility
Diagnosing High Background and Poor Signal-to-Noise Ratios
Within the broader thesis on advancing ELISA protocols for the specific detection of trace food allergens (e.g., peanut, milk, and gluten proteins), the paramount challenge is achieving impeccable assay sensitivity and specificity. High background (BG) and poor signal-to-noise (S/N) ratios directly compromise the limit of detection (LOD) and increase the risk of false positives, rendering data unreliable for regulatory or diagnostic purposes. This application note systematically details the primary causes and provides validated, detailed protocols for diagnosing and rectifying these critical performance issues.
| Diagnostic Factor | Primary Effect on BG/S/N | Quantitative Impact Range (Typical) | Recommended Threshold for Optimal Performance |
|---|---|---|---|
| Non-specific Binding (NSB) | Increases BG uniformly | BG OD can increase by 0.2 - 0.5 above ideal | Target Substrate-Only Blank OD < 0.1 |
| Inadequate Washing | Increases BG, reduces specific signal | Can reduce S/N ratio by 50% or more | ≥5 wash cycles with 300µL/well soak & aspirate |
| Antibody Concentration Too High | Increases both specific signal & NSB | Titration curves show S/N plateaus then falls | Use concentration at 80% of max signal on curve |
| Cross-reactive Antibodies | Increases BG on negative samples | False positive rate can exceed 10-15% | Validate with phylogenetically related non-allergens |
| Enzyme Conjugate Issues | High conjugate = High BG | Over-conjugation can increase BG OD by 0.3+ | Optimal conjugate dilution typically 1:2000-1:10000 |
| Substrate Contamination/Over-incubation | Drastically increases BG | BG OD increase of >0.01 per minute after saturation | Stop reaction at linear phase; ODmax ~ 2.0 for TMB |
| Plate Selection/Coating | Inconsistent well binding increases variance | Coefficient of Variation (CV) > 15% inter-well | Use high-binding plates for antigens < 10 kDa |
| Sample Matrix Interference | Modulates both signal and BG | S/N suppression or elevation by 20-50% | Use spike-and-recovery (target: 80-120%) |
Core Diagnostic Protocols
Protocol 3.1: Systematic Checkerboard Titration for Antibody & Conjugate Optimization
Objective: To identify the optimal pair of capture antibody, detection antibody, and enzyme-conjugated secondary antibody concentrations that maximize S/N.
- Coat a high-binding 96-well plate with capture antibody at three concentrations (e.g., 2, 5, 10 µg/mL) in carbonate-bicarbonate buffer (100 µL/well). Incubate overnight at 4°C.
- Block with 250 µL/well of 3% Bovine Serum Albumin (BSA) in PBS-T (0.05% Tween-20) for 2 hours at room temperature (RT).
- Prepare a positive control (e.g., purified peanut Ara h 2 at 10 ng/mL) and a negative control (coating buffer only) in assay diluent.
- Add controls to appropriate wells (100 µL). Incubate 1 hour at RT.
- Wash plate 5x with PBS-T.
- Prepare detection antibody at three concentrations (e.g., 1, 2, 5 µg/mL) in diluent. Add to plate (100 µL/well). Incubate 1 hour at RT. Wash.
- Prepare enzyme conjugate (e.g., HRP-anti-species) at three dilutions (e.g., 1:1000, 1:4000, 1:16000). Add to plate (100 µL/well). Incubate 1 hour at RT. Wash.
- Add substrate (e.g., TMB, 100 µL/well). Incubate for exactly 10 minutes in the dark. Stop with 50 µL/well 2M H₂SO₄.
- Read absorbance at 450 nm. Calculate S/N ratio for each condition: (Mean OD₍ₛₐₘₚₗₑ₎ - Mean OD₍bₗₐₙₖ₎) / Standard Deviation₍bₗₐₙₖ₎. Select combination yielding highest S/N.
Protocol 3.2: Matrix Interference & Non-Specific Binding (NSB) Assessment
Objective: To quantify interference from complex food matrices and identify NSB sources.
- Prepare sample extracts from allergenic and non-allergenic food matrices in extraction buffer (e.g., PBS with 0.5% Tween-20, 1% BSA).
- Centrifuge at 10,000 x g for 10 minutes. Filter supernatant (0.45 µm).
- Spike-and-Recovery: Split each matrix into three aliquots: (A) Unspiked, (B) Spiked with a known concentration of target allergen (e.g., 5 ng/mL), (C) Same spike in pure assay diluent. Run all through the optimized ELISA.
- Calculate % Recovery = [(OD₍B₎ - OD₍A₎) / OD₍C₎] x 100. Recovery outside 80-120% indicates matrix interference.
- NSB Control Wells: Include wells treated identically but with: (i) No capture antibody (Blocking agent only), (ii) No detection antibody, (iii) No sample, (iv) No conjugate. High OD in any of these indicates the source of NSB.
Visualizing Diagnostic Workflows
Title: Systematic Diagnostic Flowchart for ELISA S/N Issues
Title: Root Cause Relationships in ELISA Performance Failure
The Scientist's Toolkit: Research Reagent Solutions
| Item | Function & Rationale |
|---|---|
| High-Binding, Low-BG ELISA Plates | Polystyrene plates specially treated for optimal protein adsorption, minimizing well-to-well variability and passive NSB. |
| Affinity-Purified, Cross-Absorbed Antibodies | Detection antibodies purified against the target antigen and pre-adsorbed against common interfering proteins to reduce cross-reactivity. |
| Protease-Free BSA or Casein | High-quality blocking agents that effectively saturate non-specific sites without introducing enzymatic contaminants. |
| Tween-20 (Polysorbate 20) | Non-ionic detergent added to wash buffers (typically 0.05%) to disrupt hydrophobic interactions and reduce NSB. |
| HRP or AP Conjugates with Optimized F/P Ratio | Enzyme-antibody conjugates with a controlled Fluorochrome-to-Protein (F/P) ratio to ensure high activity without excess unbound enzyme causing BG. |
| Stable, Low-Noise Chromogenic Substrates (e.g., TMB) | Single-component, ready-to-use substrates with low inherent color development in the absence of enzyme, improving baseline OD. |
| Automated Microplate Washer | Ensures consistent, thorough washing and aspiration across all wells, a critical manual variable. |
| Precision Multi-Channel Pipettes | For accurate and reproducible reagent dispensing, reducing volumetric errors that affect assay kinetics. |
Optimizing Antibody Pairs and Concentrations to Minimize Cross-Reactivity
1. Introduction Within a thesis focusing on the development of a robust, multiplex ELISA for the detection of trace food allergens (e.g., peanut, milk, egg), the challenge of antibody cross-reactivity is paramount. Cross-reactivity with non-target proteins leads to false positives, compromising assay specificity and reliability. This application note details a systematic protocol for the optimization of capture-detection antibody pairs and their working concentrations to minimize cross-reactivity, thereby enhancing the specificity of allergen detection assays.
2. Key Concepts & Signaling Pathways In sandwich ELISA, the target analyte is captured by an immobilized antibody and detected by a second, labeled antibody. Cross-reactivity occurs when either antibody binds to structurally similar, non-target epitopes. The optimization process directly impacts the signal-to-noise ratio, a critical performance metric.
Diagram: Sandwich ELISA and Cross-Reactivity Pathways
3. The Scientist's Toolkit: Essential Research Reagent Solutions
| Reagent / Material | Function in Optimization |
|---|---|
| Monoclonal Antibody (mAb) Pairs | Preferable for specificity; defined single epitope targeting reduces cross-reactivity risk. |
| Affinity-Purified Polyclonal Antibodies | High affinity; must be rigorously absorbed against related proteins to remove cross-reactive clones. |
| Recombinant & Native Allergen Proteins | Required as positive controls and for cross-reactivity screening. Include homologs from related species. |
| Blocking Buffers (e.g., Protein-Free, BSA, Casein) | To minimize non-specific binding; optimal buffer varies per antibody pair and must be tested. |
| High-Binding ELISA Plates | Ensure consistent and efficient immobilization of the capture antibody. |
| HRP or AP Conjugation Kits | For labeling detection antibodies; clean conjugation reduces background. |
| Cross-adsorption Resins | For removing cross-reactive antibodies from polyclonal sera by affinity depletion. |
4. Experimental Protocol: Checkerboard Titration for Pair Screening
Objective: To identify the optimal combination of capture and detection antibody concentrations that maximizes specific signal for the target allergen while minimizing cross-reactive signal.
Materials: Coating buffer (Carbonate-Bicarbonate, pH 9.6), PBS-T (PBS with 0.05% Tween-20), blocking buffer (3% BSA in PBS), target allergen (1 µg/mL), cross-reactive protein(s) (1 µg/mL), antibody diluent (1% BSA in PBS-T), TMB substrate, stop solution (1M H₂SO₄).
Procedure:
- Capture Antibody Coating: Prepare 4-column serial dilutions of the capture antibody (e.g., 10, 5, 2.5, 1.25 µg/mL) in coating buffer. Add 100 µL per well across all rows of a 96-well plate. Incubate overnight at 4°C.
- Blocking: Wash plate 3x with PBS-T. Add 300 µL blocking buffer per well. Incubate 2 hours at room temperature (RT). Wash 3x.
- Antigen Application: In separate plate sections, apply:
- Section A: 100 µL of target allergen solution.
- Section B: 100 µL of cross-reactive protein solution.
- Section C: 100 µL of diluent only (blank). Incubate 2 hours at RT. Wash 5x.
- Detection Antibody Titration: Prepare 4-row serial dilutions of the detection antibody (e.g., 5, 2.5, 1.25, 0.625 µg/mL) in antibody diluent. Add 100 µL per well, creating a matrix of all capture/detection concentration combinations for each antigen section. Incubate 1.5 hours at RT. Wash 5x.
- Signal Development: Add enzyme substrate (e.g., TMB, 100 µL/well). Incubate for a fixed time (e.g., 15 min). Stop reaction. Read absorbance at 450 nm.
5. Data Analysis and Optimization Criteria Calculate the mean signal for blanks (Section C) and subtract from raw signals. Analyze the signal matrix.
Table 1: Checkerboard Titration Results (Sample Data - Absorbance 450 nm) Target Allergen (Peanut Ara h 2)
| Capture [µg/mL] → Detection [µg/mL] ↓ | 10.0 | 5.0 | 2.5 | 1.25 |
|---|---|---|---|---|
| 5.0 | 3.200 | 2.850 | 2.100 | 1.400 |
| 2.5 | 2.900 | 2.500 | 1.800 | 1.100 |
| 1.25 | 2.200 | 1.950 | 1.300 | 0.750 |
| 0.625 | 1.400 | 1.100 | 0.650 | 0.350 |
Cross-Reactive Protein (Lupin Conglutin β)
| Capture [µg/mL] → Detection [µg/mL] ↓ | 10.0 | 5.0 | 2.5 | 1.25 |
|---|---|---|---|---|
| 5.0 | 0.450 | 0.300 | 0.180 | 0.100 |
| 2.5 | 0.350 | 0.220 | 0.120 | 0.070 |
| 1.25 | 0.200 | 0.150 | 0.090 | 0.050 |
| 0.625 | 0.120 | 0.085 | 0.055 | 0.030 |
Selection Workflow: Calculate the Specificity Index (SI) = (Target Signal) / (Cross-Reactive Signal) for each well. Identify the concentration pair yielding a high target signal (>1.0 OD) with the maximal SI.
Diagram: Antibody Pair Selection Decision Logic
6. Advanced Validation Protocol: Cross-Reactivity Panel Testing Objective: To rigorously validate the selected antibody pair against a broad panel of potential interferents.
Procedure:
- Coat and block plate using the optimized capture antibody concentration.
- Apply 100 µL/well of the following, in triplicate:
- Target allergen (positive control) at high, mid, and low concentrations.
- A panel of phylogenetically related or structurally similar proteins/allergens (e.g., for peanut Ara h 2, test lupin, soy, pea proteins).
- Common matrix proteins (e.g., casein, BSA, ovalbumin).
- Buffer only (negative control).
- Proceed with the assay using the optimized detection antibody concentration.
- Calculate cross-reactivity percentage:
%(Cross-Reactivity) = (Signal from Interferent / Signal from Target) * 100. Acceptable thresholds are typically <1-5%.
7. Conclusion Integrating this systematic optimization of antibody pairs and concentrations into the broader ELISA development thesis for food allergen detection is critical. It establishes a foundational method to achieve high specificity, directly addressing the core challenge of cross-reactivity in complex food matrices, and yields reliable, publishable assay performance data.
Application Notes Matrix interference in complex food matrices like fatty, acidic, or fermented products remains a significant challenge for accurate ELISA-based allergen detection. These matrices can cause false-negative or false-positive results through various mechanisms, including protein degradation, epitope masking, non-specific binding, and pH/enzyme inhibition. Addressing this interference is critical for compliance with global food allergen labeling regulations (e.g., FAO/WHO Codex, EU FIC) and protecting public health. This document details targeted strategies and protocols to mitigate these effects within a research framework focused on method development and validation.
Quantitative Data Summary: Impact of Interference Mitigation Strategies
Table 1: Efficacy of Pre-Treatment Protocols on Allergen Recovery in Challenging Matrices
| Matrix Type | Interference Factor | Mitigation Strategy | Mean Recovery (%) ± RSD | Reference Allergen |
|---|---|---|---|---|
| Peanut Butter (Fatty) | Lipid Coating, Protein Aggregation | Defatting (Hexane), Surfactant (Tween-20) | 92.3 ± 5.2 | Ara h 1 |
| Tomato Sauce (Acidic) | pH-induced Denaturation | pH Adjustment (NaHCO₃), Use of Acid-Resistant Antibodies | 88.7 ± 4.8 | Bovine Casein |
| Soy Sauce (Fermented) | High Salt, Proteolysis | Dilution in High-Salt Buffer, Protease Inhibitor Cocktail | 85.1 ± 6.1 | Gly m 5 |
| Blue Cheese (Fatty & Fermented) | Combined: Fat, pH, Enzymes | Sequential: Defatting, pH Adjust, Inhibitors | 78.4 ± 7.3 | β-Lactoglobulin |
Table 2: Performance Comparison of Commercial ELISA Kits with Modified Extraction Buffers
| Kit Target Allergen | Standard Buffer Recovery in Matrix (%) | Optimized Buffer (Additives) | Improved Recovery (%) | Key Interference Addressed |
|---|---|---|---|---|
| Hazelnut (Cor a 9) | 65.2 (Chocolate Spread) | PBS with 0.5% Casein, 10% EtOH | 89.5 | Polyphenol Binding, Fat |
| Egg (Ovomucoid) | 58.9 (Mayonnaise) | Tris-HCl pH 8.5, 1M NaCl, 0.1% SDS | 94.2 | Oil Emulsion, Low pH |
| Gluten (Gliadin) | 45.5 (Sourdough Beer) | Cocktail Extraction Solution (Proprietary) | 82.0 | Fermentation Hydrolysis |
| Milk (Casein) | 71.3 (Yogurt) | PBS with 2% BSA, 5mM EDTA | 90.6 | Bacterial Proteases, Acidity |
Experimental Protocols
Protocol 1: Optimized Extraction for Fatty Matrices (e.g., Nut Pastes, Oily Dressings) Objective: To solubilize and recover allergenic proteins coated or trapped by lipids.
- Homogenization: Weigh 1g of sample. Add 10mL of pre-warmed (50°C) extraction buffer (0.01M PBS, pH 7.4, containing 0.5% Tween-20, 1% Polyvinylpyrrolidone (PVP)).
- Defatting (Optional for severe interference): For solid/semi-solid samples, first vortex with 5mL of food-grade hexane for 2 min. Centrifuge at 10,000xg for 10 min (4°C). Carefully aspirate and discard the organic (top) layer. Air-dry the pellet for 15 min to evaporate residual solvent.
- Extraction: Homogenize the sample/buffer mixture using a high-speed disperser for 2 min. Place on a rocking platform for 60 min at room temperature.
- Clarification: Centrifuge at 15,000xg for 20 min at 4°C. Carefully collect the intermediate aqueous layer, avoiding the top lipid layer and bottom pellet.
- Analysis: Perform ELISA immediately or aliquot and store at -80°C. Always include a matrix-matched control spiked with a known allergen concentration for recovery calculation.
Protocol 2: Handling Acidic and Fermented Matrices (e.g., Fruit Juices, Sauerkraut, Soy Products) Objective: To neutralize pH and inhibit proteolytic activity that degrades target allergens.
- pH Adjustment: Weigh 2g of sample into a 50mL conical tube. Gradually add solid sodium bicarbonate (NaHCO₃) or 1M Tris-base solution while monitoring with a pH strip until the extract reaches pH 7.0-7.4. Do not exceed a 10% volume increase.
- Stabilized Extraction: Add 20mL of Stabilizing Extraction Buffer (0.05M Phosphate Buffer, pH 8.0, 0.5M NaCl, 5mM EDTA, 1mM PMSF, 2% BSA).
- Inhibition: Add 100µL of a broad-spectrum protease inhibitor cocktail (e.g., containing inhibitors for serine, cysteine, aspartic, and metalloproteases).
- Processing: Homogenize and extract as in Protocol 1, steps 3-4.
- Dilution Strategy: Perform initial ELISA analysis at multiple dilutions (e.g., 1:10, 1:50, 1:100) in the kit's standard dilution buffer to identify the optimal dilution that falls within the standard curve while minimizing matrix effects.
Visualizations
Title: Workflow for Mitigating Matrix Interference in Food Allergen Detection
Title: Interference Mechanisms and Targeted Solutions in Allergen ELISA
The Scientist's Toolkit: Research Reagent Solutions
Table 3: Essential Reagents for Overcoming Matrix Interference
| Reagent/Material | Primary Function | Application Note |
|---|---|---|
| Tween-20 or Triton X-100 | Non-ionic surfactant to solubilize hydrophobic proteins and disrupt lipid-protein interactions. | Critical for fatty matrices. Use at 0.1-1% in extraction buffer. May require optimization to prevent antibody denaturation. |
| Polyvinylpyrrolidone (PVP) or Casein | Competes for binding with polyphenols/tannins, preventing them from masking allergenic epitopes. | Essential for plant-based, fermented, or acidic foods (fruits, sauces, tea). |
| Protease Inhibitor Cocktail | Broad-spectrum inhibition of serine, cysteine, metallo, and aspartic proteases from food or microbes. | Mandatory for fermented, aged, or malted products where proteolysis is likely. |
| EDTA (Ethylenediaminetetraacetic acid) | Chelates divalent cations (Mg2+, Ca2+), inhibiting metalloproteases and stabilizing proteins. | Often combined with protease inhibitors in extraction buffers. |
| BSA (Bovine Serum Albumin) or Fish Gelatin | Inert blocking protein added to extraction buffers to reduce non-specific binding and protein loss. | Minimizes adsorption to surfaces and saturates sticky sites in the matrix. |
| Organic Solvents (Hexane, Acetone) | Selective removal of non-polar lipids and pigments via defatting prior to aqueous extraction. | For severe fat interference. Ensure complete evaporation to avoid ELISA interference. |
| High-Ionic-Strength Buffers (e.g., with 0.5-1M NaCl) | Reduces ionic interactions leading to non-specific binding and helps solubilize proteins. | Useful for high-salt fermented foods and to disrupt weak complexes. |
| pH Adjustment Reagents (NaHCO3, Tris-base, HCl/NaOH) | Neutralizes acidic matrices to a pH optimal for antibody-antigen binding (pH 7-8). | Prevents pH-induced conformational changes in target epitopes and assay enzymes. |
Addressing Hook Effects and Improving Dynamic Range of Detection
Within the broader research thesis on developing robust ELISA protocols for trace food allergen detection, the prozone or "hook" effect presents a critical analytical challenge. High-dose hook effects, where excess analyte saturates both capture and detection antibodies, leading to a falsely low signal, are particularly problematic for allergens like peanut, milk, or egg that can be present over an extremely wide concentration range in processed foods. This application note details strategies to identify, mitigate, and overcome hook effects, thereby significantly improving the assay's dynamic range and reliability for quantitative risk assessment.
Mechanisms and Identification of the Hook Effect
Signaling Pathway Underlying the Sandwich ELISA Hook Effect
A standard sandwich ELISA relies on the sequential formation of a capture antibody-analyte-detection antibody complex. The hook effect occurs when analyte concentration is excessively high, disrupting this ideal pathway.
Title: ELISA Hook Effect Disruption Pathway
Quantitative Data: Identifying Hook Effect via Serial Dilution
A hallmark of the hook effect is a signal decrease upon sample dilution. The following table summarizes typical data from a peanut Ara h2 ELISA testing a highly contaminated sample.
Table 1: Signal Profile Indicative of a High-Dose Hook Effect
| Sample Dilution Factor | Apparent [Ara h2] (ppm) | Measured OD (450 nm) | Interpretation |
|---|---|---|---|
| Neat (1:1) | 15.2 | 0.85 | Falsely Low |
| 1:10 | 125.0 | 2.80 | Signal Increase |
| 1:100 | 132.0 | 2.95 | Plateau (True Value ~130 ppm) |
| 1:1000 | 14.1 | 0.82 | Expected Decline |
Experimental Protocols for Diagnosis and Resolution
Protocol 3.1: Mandatory Serial Dilution Test for Suspected Hook Effect
Purpose: To diagnostically confirm the presence of a high-dose hook effect. Materials: See Scientist's Toolkit. Procedure:
- Prepare a 1:2 serial dilution series of the test sample in the provided assay buffer across at least 8 wells (e.g., neat, 1:2, 1:4, ..., 1:128).
- Run the diluted samples alongside the standard curve in your validated sandwich ELISA protocol.
- Plot OD (or calculated concentration) against the dilution factor.
- Interpretation: A non-monotonic plot where signal increases with initial dilutions confirms a hook effect. The true concentration is found at the plateau before the signal eventually decreases.
Protocol 3.2: Improving Dynamic Range via Capture Antibody Titration
Purpose: To optimize the capture antibody concentration to bind a wider analyte range without saturation. Procedure:
- Coat microplate wells with varying concentrations of the capture antibody (e.g., 0.5, 1, 2, 4, 8 µg/mL) overnight at 4°C.
- Block, wash, and run the ELISA using a standard curve spanning the expected range (e.g., 0.1-1000 ppm) and a known high-concentration positive control.
- Generate dose-response curves for each capture antibody concentration. Identify the concentration that yields the highest upper limit of quantification (ULOQ) while maintaining a low limit of detection (LOD). Higher capture Ab often extends the hook point.
Advanced Strategies: Assay Re-Engineering
Workflow: Implementing a Two-Site Sequential ELISA
A sequential (or delayed) addition of the detection antibody significantly improves dynamic range by allowing the high-analyte sample to first bind to the immobilized capture antibody, followed by washing away excess unbound analyte before introducing the detection antibody.
Title: Sequential ELISA Workflow to Prevent Hook
Protocol 4.1: Two-Step Sequential ELISA Protocol
Purpose: To eliminate hook effects by physically removing excess analyte prior to detection. Key Modification from Standard Protocol:
- After sample/analyte addition, incubate and then perform 3-5 rigorous wash steps.
- Only after washing, add the detection antibody conjugate. This prevents the formation of analyte-detection antibody complexes in solution that cannot bind to the solid phase.
- Continue with standard incubation, washing, and substrate steps. Validation: Test with serial dilutions of a high-concentration allergen standard (e.g., casein at 10,000 ppm). The sequential method should maintain a linear or sigmoidal log-response curve where the standard one-step method hooks.
The Scientist's Toolkit: Key Research Reagent Solutions
Table 2: Essential Materials for Hook Effect Investigation
| Item | Function & Relevance to Hook Effect |
|---|---|
| High-Purity Allergen Standards (e.g., rAra h2, β-lactoglobulin) | Critical for creating standard curves that span the full range (ppb to % levels) to characterize the assay's hook point. |
| Monoclonal Capture Antibodies (High Affinity) | Optimizable coating concentration. Higher affinity improves LOD but may require titration to push hook point higher. |
| HRP/AP-Labeled Detection Antibodies | Must be titrated alongside capture Ab. Using a lower concentration can sometimes mitigate hook but may reduce sensitivity. |
| Rigorous Wash Buffer (e.g., PBS with 0.05-0.1% Tween-20) | Essential for the sequential ELISA protocol to effectively remove unbound, excess analyte before detection Ab addition. |
| Signal-Blocking Reagents (Casein, BSA in specific buffer) | Must be optimized to prevent non-specific binding of detection antibodies in sequential format where high analyte is present during first step. |
| Data Analysis Software (4- or 5-PL curve fitting) | Mandatory. 5-parameter logistic (5PL) models fit asymmetric curves better and can more accurately define the hook region and dynamic range than 4PL. |
Protocol Adjustments for Heat-Processed or Hydrolyzed Allergens
Within the broader thesis on optimizing ELISA protocols for food allergen detection, a critical challenge is the accurate quantification of allergens that have undergone industrial processing. Heat treatment (e.g., baking, roasting, extrusion) and hydrolysis (enzymatic or acidic) can profoundly alter protein structure. These modifications destroy conformational epitopes, mask or degrade linear epitopes, and reduce solubility, leading to significant underestimation of allergen content in standard ELISAs calibrated against native proteins. This document provides detailed application notes and protocols for adjusting ELISA methods to address these analytical gaps.
Quantitative Impact of Processing on Allergen Detection
The following table summarizes typical recovery rates reported for common allergens post-processing using standard (native-calibrated) ELISAs.
Table 1: Allergen Recovery in Standard ELISA After Processing
| Allergen Source | Processing Condition | Approx. Recovery vs. Native Std. | Primary Epitope Impact |
|---|---|---|---|
| Peanut (Ara h 2) | Roasting (150°C, 30 min) | 20-40% | Conformational loss, aggregation |
| Milk (β-lactoglobulin) | Baking (180°C, 20 min) | 10-30% | Maillard reaction, aggregation |
| Egg (Ovomucoid) | Boiling (100°C, 10 min) | 40-60% | Partial denaturation |
| Gluten (Gliadin) | Hydrolysis (Enzymatic) | <5-15% | Peptide bond cleavage |
| Soy (Gly m 5) | Extrusion (High Temp/Pressure) | 15-35% | Aggregation, epitope masking |
Core Protocol Adjustments
Sample Extraction Buffer Optimization
Objective: Maximize solubilization of aggregated or denatured proteins and recovery of hydrolyzed peptides.
- Protocol:
- Standard Buffer: 20 mM Tris-HCl, 150 mM NaCl, 2% Tween-20, pH 8.2.
- Enhanced Buffer (for Heat-Processed Samples): Add 2% SDS (w/v) and 5 M Urea to the standard buffer. Note: SDS can interfere with some antibody bindings; a post-extraction dilution (1:10 or greater) in assay buffer is mandatory to reduce SDS concentration below critical micelle concentration.
- Buffer for Hydrolyzed Allergens: Use a low-pH buffer (0.01M HCl, pH ~2.0) or a chaotropic buffer (6M Guanidine HCl) to solubilize small peptides. Neutralize with assay buffer prior to ELISA.
ELISA Calibration Standard Selection
Objective: Match the calibrator to the analyte form present in the processed sample.
- Protocol:
- Native Standard: Purified, unprocessed allergen protein. Suitable only for minimally processed samples.
- Processed In-House Standard: Subject the native protein standard to a validated, representative heat/hydrolysis process. This calibrator curve will more accurately reflect the immunoreactivity of the processed analyte.
- Synthetic Peptide Standard (for hydrolysis): For extensively hydrolyzed allergens (e.g., hydrolyzed wheat protein), use synthetic peptides representing key linear epitopes as calibrators.
Antibody Selection and Validation
Objective: Employ antibodies targeting stable, linear epitopes.
- Protocol:
- Epitope Mapping: Prioritize monoclonal or polyclonal antibodies characterized to bind sequential, heat-stable epitopes (e.g., via peptide microarray or phage display).
- Cross-Reactivity Check: Validate candidate antibodies against the processed in-house standard and a panel of potentially cross-reactive processed matrix components.
- Platform Consideration: Sandwich ELISAs require two antibodies binding non-competing linear epitopes. For hydrolyzed peptides, competitive or inhibition ELISA formats may be superior.
Detailed Experimental Protocol: ELISA for Roasted Peanut Allergen
Title: Adjusted Sandwich ELISA for Quantification of Ara h 2 in Roasted Products.
Materials & Reagents: See "Research Reagent Solutions" below.
Workflow:
- Sample Preparation: Homogenize 1g sample in 10 mL Enhanced Extraction Buffer (with 2% SDS/5M Urea). Rotate mix for 2h at 60°C. Centrifuge at 10,000 x g for 15 min. Dilute supernatant 1:25 in ELISA Coating Buffer.
- Calibrator Preparation: Create a dilution series (0, 1, 5, 10, 25, 50 ng/mL) from a roasted peanut Ara h 2 standard.
- ELISA Procedure:
- Coat microplate with 100 µL/well of capture anti-Ara h 2 mAb (1 µg/mL in carbonate buffer). Incubate overnight at 4°C.
- Block with 3% BSA in PBS for 2h.
- Add 100 µL of calibrators or diluted samples per well. Incubate 2h.
- Add 100 µL of biotinylated detection anti-Ara h 2 mAb. Incubate 1h.
- Add 100 µL of streptavidin-HRP conjugate. Incubate 30 min.
- Add 100 µL TMB substrate. Incubate 15 min.
- Stop with 50 µL 2M H₂SO₄.
- Read absorbance at 450 nm.
- Calculation: Fit calibrator data to a 4-parameter logistic curve. Report results as "ng Ara h 2 equivalent per g sample" with note on standard type.
Diagrams
Diagram 1: Protocol Decision Workflow for Processed Allergens
Diagram 2: Epitope Alteration by Processing
The Scientist's Toolkit: Research Reagent Solutions
Table 2: Essential Reagents for Processed Allergen ELISA
| Reagent / Material | Function & Rationale | Example / Specification |
|---|---|---|
| Chaotropic Salts (Urea, Guanidine HCl) | Disrupt hydrogen bonds to solubilize aggregated proteins and denatured complexes. | Molecular biology grade, >99% purity. |
| Ionic Detergents (SDS) | Unfolds proteins, disrupts hydrophobic interactions, enhances extraction yield from matrices. | Electrophoresis-grade SDS. |
| Processed Allergen Standards | Provides a calibrant with matched epitope presentation to the analyte, critical for accurate quantification. | In-house processed or commercially available (e.g., roasted peanut protein). |
| Linear Epitope-Specific Antibodies | Target stable amino acid sequences unaffected by denaturation; essential for detecting processed allergens. | Monoclonal antibodies validated via peptide binding assays. |
| Synthetic Peptide Antigens | Serve as calibrators and controls for hydrolyzed allergens where full-length proteins are absent. | >95% purity, representing immunodominant linear epitopes. |
| Competitive ELISA Format Reagents | Preferred format for small peptides (hydrolyzed allergens) where sandwich ELISA may be ineffective. | Biotinylated native protein or peptide, and streptavidin-HRP. |
Best Practices for Inter- and Intra-Assay Precision (CV%)
In the development and validation of ELISA protocols for food allergen detection, achieving robust precision is non-negotiable. This is foundational to a research thesis aiming to deliver reliable, quantitative data for risk assessment. Precision, measured as the coefficient of variation (CV%), is categorized into intra-assay (within-run) and inter-assay (between-run) variability. This document outlines established best practices and protocols to minimize these critical parameters.
Defining Precision Metrics
- Intra-Assay CV%: A measure of repeatability. Assessed by analyzing multiple replicates (n≥8) of the same sample within a single assay run.
- Inter-Assay CV%: A measure of intermediate precision. Assessed by analyzing the same sample across multiple independent assay runs (e.g., different days, operators, or reagent lots).
Key Factors Influencing ELISA CV%
A systematic approach to controlling variables is essential. Key factors are summarized below.
Table 1: Major Sources of Variability in Food Allergen ELISA and Mitigation Strategies
| Source of Variability | Impact on CV% | Recommended Mitigation Practice |
|---|---|---|
| Pipetting Technique | High | Use calibrated, positive-displacement pipettes for viscous matrices (e.g., food extracts). Regular pipette maintenance and operator training. |
| Reagent Handling | High | Allow all reagents to equilibrate to room temperature (RT) completely before use. Avoid repeated freeze-thaw cycles of standards/controls. |
| Plate Washer Performance | High | Validate washer efficiency (e.g., using a fluorescent dye). Ensure consistent aspiration and pat-drying. Check for clogged nozzles. |
| Incubation Conditions | Medium-High | Use a calibrated, humidified incubator. Ensure plate sealers are effective and consistent. Standardize incubation times precisely. |
| Sample & Standard Preparation | High | Prepare fresh standard curves for every run. Ensure homogeneous extraction of allergen from food matrix. Use matrix-matched controls. |
| Microplate Reader | Medium | Regular calibration and maintenance. Ensure consistent reading path and wavelength accuracy. |
| Data Analysis | Medium | Use a validated 4- or 5-parameter logistic (4PL/5PL) curve fit. Define an appropriate assay working range. |
Experimental Protocol for Precision Determination
Protocol: Determination of Intra- and Inter-Assay Precision for a Food Allergen ELISA Objective: To quantitatively determine the intra- and inter-assay CV% for the detection of [e.g., Ara h 1] in a incurred cookie extract. Materials: See "The Scientist's Toolkit" below.
Procedure:
- Sample Preparation: Prepare a homogeneous extract from a cookie incurred with a known, mid-range concentration of the target allergen (e.g., 10 ppm). Centrifuge to clarify. Prepare a low and high QC sample similarly.
- Standard Curve: Reconstitute the protein standard according to manufacturer instructions. Generate a 2-fold serial dilution series in assay buffer to create a 7-point standard curve, plus blank.
- Plate Layout: Design the plate to include:
- Standard curve in duplicate.
- The mid-level incurred sample: 16 replicates across the plate (for intra-assay CV).
- Low and High QC samples: in triplicate.
- Intra-Assay Precision Run: Perform the complete ELISA according to the established protocol (coating, blocking, sample/standard addition, detection antibody, enzyme conjugate, substrate, stop). Use a single kit lot and one operator.
- Data Analysis (Intra-Assay):
- Generate the standard curve using 4PL regression.
- Interpolate the concentration for all 16 replicates of the mid-level sample.
- Calculate the mean, standard deviation (SD), and CV% (CV% = (SD / Mean) * 100).
- Acceptability is typically ≤10-15% CV for the mid-range sample.
- Inter-Assay Precision: Repeat the entire assay (Steps 2-5) on 3 separate days (minimum), using fresh reagent preparations each time. A different operator should perform at least one run.
- Data Analysis (Inter-Assay):
- For each run, calculate the mean concentration of the mid-level sample (using its replicates from that run).
- You will have 3 mean values (one from each day).
- Calculate the overall grand mean, SD, and CV% from these independent means.
- Acceptability is typically ≤15-20% CV.
Visualizing the Precision Validation Workflow
Diagram Title: ELISA Precision Determination Workflow
Data Presentation for Precision Studies
Table 2: Example Precision Data for an Ara h 1 ELISA
| Sample Type | Nominal Conc. (ppm) | Intra-Assay (n=16) | Inter-Assay (n=3 runs) | ||||
|---|---|---|---|---|---|---|---|
| Mean (ppm) | SD | CV% | Mean (ppm) | SD | CV% | ||
| Incurred Cookie (Low QC) | 2.5 | 2.7 | 0.22 | 8.1% | 2.6 | 0.31 | 11.9% |
| Incurred Cookie (Mid QC) | 10.0 | 10.5 | 0.89 | 8.5% | 10.2 | 1.43 | 14.0% |
| Incurred Cookie (High QC) | 40.0 | 38.2 | 3.21 | 8.4% | 39.1 | 5.07 | 13.0% |
| Acceptance Criteria | < 15% | < 20% |
The Scientist's Toolkit
Table 3: Essential Research Reagent Solutions for Precision ELISA
| Item | Function in Precision Studies |
|---|---|
| Incurred Reference Material | Food matrix with homogenously incorporated, quantified allergen. Provides the true test matrix for precision evaluation, superior to spiked samples. |
| Matched-Pair Antibodies | Highly specific monoclonal or affinity-purified polyclonal capture/detection antibodies. Key to assay specificity and consistent binding kinetics. |
| Stable Protein Standard | Purified, quantitated native or recombinant allergen protein. Critical for generating a reproducible standard curve across runs. |
| Matrix-Matched Assay Buffer | Diluent formulated to mimic the food extract matrix. Minimizes matrix interference effects on antibody binding, improving accuracy. |
| HRP/TMB Detection System | Consistent, high-sensitivity enzyme (HRP) and chromogenic substrate (TMB). Must exhibit low background and linear kinetic range. |
| Pre-Coated, High-Binding Plates | Ensure consistent antigen binding capacity across all wells and plates. Lot-to-lot validation is mandatory. |
| Automated Plate Washer | Provides uniform and repeatable washing, a major factor in reducing well-to-well variability. |
| Calibrated Multi-Channel Pipettes | Essential for consistent, parallel dispensing of samples, standards, and reagents across the plate. |
Verification of Kit Components and Reagent Stability
Within the broader thesis on optimizing ELISA protocols for food allergen detection, the verification of commercial kit components and the stability of in-house reagents is a critical, yet often overlooked, prerequisite. Reliable quantification of trace allergens (e.g., peanut, milk, gluten) in complex food matrices is contingent upon the consistent performance of every reagent. This document provides detailed application notes and protocols for systematically assessing kit component integrity and determining the usable shelf-life of critical reagents, thereby underpinning the robustness of the primary research data.
Key Research Reagent Solutions
The following table details essential materials for stability verification and assay execution in food allergen ELISA.
| Item | Function in Food Allergen ELISA |
|---|---|
| Certified Reference Material (CRM) | Provides a matrix-matched, analyte-specific standard with a known, traceable concentration for calibrating the assay and verifying kit standard curve accuracy. |
| In-house Positive Control | A stable, well-characterized food matrix (e.g., incurred baked cookie) spiked with a known quantity of target allergen, used for longitudinal precision and recovery monitoring. |
| Stabilized Enzyme Conjugate | The detection antibody linked to an enzyme (e.g., HRP). Stability directly impacts assay sensitivity and signal-to-noise ratio over time. |
| TMB (3,3’,5,5’-Tetramethylbenzidine) Substrate | Chromogenic substrate for HRP. Unstable if contaminated or exposed to light; degradation leads to reduced signal intensity and high background. |
| Stop Solution (e.g., 1M H₂SO₄) | Terminates the enzymatic reaction. Concentration accuracy is vital for consistent final optical density (OD) readings. |
| Wash Buffer Concentrate | Typically a buffered solution with surfactant. Proper dilution and pH are critical for minimizing non-specific binding in complex food extracts. |
| Blocking Buffer (for in-house assays) | Protein-based solution (e.g., casein, BSA) used to coat well surfaces not occupied by capture antibody, preventing non-specific protein adsorption from food samples. |
Experimental Protocols
Protocol: Verification of Commercial Kit Component Performance
Objective: To validate that all components of a newly received or stored commercial food allergen ELISA kit perform within specified parameters before use in research.
Materials:
- Commercial ELISA kit for target allergen.
- Certified Reference Material (CRM) for the target allergen.
- Microplate reader capable of measuring 450 nm (with 620-650 nm reference filter).
- Precision pipettes and tips.
- Deionized water.
Methodology:
- Reconstitution & Preparation: Reconstitute or prepare all kit standards, controls, and buffers strictly according to the kit insert.
- CRM Dilution Series: Prepare a serial dilution of the CRM in the kit-provided sample diluent to span the expected detection range of the kit (e.g., 0, 1, 2, 5, 10 ppm of allergen protein).
- Parallel Assay: Run the ELISA according to the manufacturer's protocol, but include the CRM dilution series in place of regular samples on the same plate.
- Data Analysis: Generate the standard curve from the kit standards. Use this curve to calculate the apparent concentration of the CRM at each dilution level.
- Verification Criteria:
- Standard Curve: The curve must have an R² value ≥ 0.99.
- CRM Recovery: The mean recovery of the CRM across the tested range should be 80-120%.
- Kit Control Recovery: The kit's internal positive control must recover within the range stated on the Certificate of Analysis.
Protocol: Accelerated Stability Testing of Critical Reagents
Objective: To estimate the real-time shelf-life of key liquid reagents (e.g., enzyme conjugate, antibody stocks) by monitoring performance under stressed conditions.
Materials:
- Reagent aliquots to be tested.
- Stable, in-house positive control material.
- Standard ELISA plate reader and accessories.
Methodology:
- Aliquot & Stress: Divide the reagent into multiple single-use aliquots. Store aliquots under accelerated stress conditions: 4°C (control), 25°C (elevated), and 37°C (high stress). Protect from light.
- Time-Points: Test aliquots from each condition at defined intervals (e.g., Day 0, 7, 14, 28). Always use a fresh aliquot.
- Performance Assay: For each time-point/condition, perform a simplified ELISA: coat a plate with antigen (if testing detection reagents) or capture antibody (if testing conjugate), then run the assay using a stable in-house positive control and a blank, incorporating the stressed reagent.
- Key Metrics: Record the Signal-to-Noise Ratio (S/N) [Mean OD(positive control) / Mean OD(blank)] and the % Recovery of the expected positive control value.
- Stability Endpoint: The reagent is considered stable until the S/N ratio falls below a pre-defined threshold (e.g., < 80% of the Day 0 S/N value) or the % recovery falls outside 80-120%.
Data Presentation
Table 1: Verification Data for a Commercial Peanut Allergen ELISA Kit Using a Peanut CRM
| Kit Standard (ppm) | Mean OD (n=3) | CRM Dilution (Theoretical ppm) | Mean OD (n=3) | Calculated Concentration (ppm) | % Recovery |
|---|---|---|---|---|---|
| 0 | 0.051 | 0 | 0.049 | 0.1 | - |
| 2 | 0.215 | 1 | 0.138 | 1.2 | 120 |
| 5 | 0.480 | 2 | 0.245 | 2.3 | 115 |
| 10 | 0.855 | 5 | 0.520 | 5.4 | 108 |
| 20 | 1.420 | 10 | 0.910 | 10.7 | 107 |
Standard Curve R²: 0.998. Kit Control Recovery: 102%.
Table 2: Accelerated Stability of HRP-Conjugated Anti-Ara h2 Antibody at Different Temperatures
| Storage Condition | Day 0 (S/N) | Day 7 (S/N) | % of Initial S/N | Day 14 (S/N) | % of Initial S/N |
|---|---|---|---|---|---|
| 4°C (Control) | 12.5 | 12.1 | 96.8% | 11.8 | 94.4% |
| 25°C | 12.5 | 10.4 | 83.2% | 8.1 | 64.8% |
| 37°C | 12.5 | 7.3 | 58.4% | 4.2 | 33.6% |
Stability Endpoint (S/N < 10.0) reached at Day 14 for 25°C and Day 7 for 37°C.
Visualizations
Workflow for Kit Component Verification
Framework for Reagent Stability Assessment
Validation of ELISA Methods: Comparative Analysis with Emerging Technologies
Introduction In the context of developing and validating a quantitative ELISA protocol for food allergen detection (e.g., peanut Ara h 1), rigorous method validation is paramount. This ensures reliable data for risk assessment and compliance with labeling regulations. This application note details the experimental protocols and calculations for five core validation parameters: Limit of Detection (LOD), Limit of Quantification (LOQ), Accuracy, Precision, and Ruggedness, framed within a broader thesis on analytical method development.
1. Limit of Detection (LOD) & Limit of Quantification (LOQ) Protocol: A standard matrix (e.g., incurred or spiked food extract free of the target allergen) is used to prepare a series of blank and very low-concentration samples near the expected detection limit. A minimum of 10 independent replicates of the blank and 10 of the low-concentration sample are analyzed across multiple runs. Calculations:
- LOD: Calculated as the mean absorbance of the blank + 3.3 times the standard deviation (SD) of the blank. Convert the resulting absorbance to concentration using the calibration curve.
- LOQ: Calculated as the mean absorbance of the blank + 10 times the SD of the blank. Convert to concentration. The LOQ must also meet predefined accuracy (80-120%) and precision (CV ≤20%) criteria. Data Presentation: Table 1: LOD and LOQ Determination for Peanut Ara h 1 ELISA
| Parameter | Calculation Basis | Mean Absorbance (n=10) | SD (Abs) | Calculated Conc. (ppm) | Acceptability Criteria |
|---|---|---|---|---|---|
| LOD | Blank (Matrix) | 0.045 | 0.005 | 0.15 ppm | Signal > Blank |
| LOQ | Blank (Matrix) | 0.045 | 0.005 | 0.25 ppm | Accuracy 85%, CV 15% |
2. Accuracy (Recovery) Protocol: The target allergen (purified protein) is spiked into a allergen-free food matrix (e.g., cookie dough) at three distinct concentrations spanning the quantitative range (low, mid, high). Each concentration is prepared and analyzed in six replicates. The recovery is calculated by comparing the measured concentration to the known spiked concentration. Calculation: Recovery (%) = (Measured Concentration / Spiked Concentration) * 100. Data Presentation: Table 2: Accuracy (Recovery) Assessment at Three Concentration Levels
| Spiked Conc. (ppm) | Mean Measured Conc. (ppm) (n=6) | SD (ppm) | Recovery (%) | Mean Recovery (%) | Criteria |
|---|---|---|---|---|---|
| 1.0 | 0.95 | 0.08 | 95.0 | 96.7% | 80-120% |
| 5.0 | 4.80 | 0.30 | 96.0 | ||
| 20.0 | 19.7 | 1.10 | 98.5 |
3. Precision Protocol: Precision is evaluated at repeatability (intra-assay) and intermediate precision (inter-assay) levels using spiked samples at low, mid, and high concentrations.
- Repeatability: Six replicates at each level are analyzed by the same analyst, on the same day, with the same equipment.
- Intermediate Precision: The same spiked levels are analyzed across three different days by two analysts. The combined data is used to calculate inter-assay CV. Data Presentation: Table 3: Precision Data for Peanut Allergen ELISA
| Precision Level | Conc. (ppm) | Mean (ppm) | SD (ppm) | CV (%) | Acceptability (CV ≤20%) |
|---|---|---|---|---|---|
| Repeatability | 1.0 | 0.95 | 0.08 | 8.4 | Pass |
| (Intra-assay) | 5.0 | 4.80 | 0.30 | 6.3 | Pass |
| 20.0 | 19.7 | 1.10 | 5.6 | Pass | |
| Intermediate | 1.0 | 0.94 | 0.12 | 12.8 | Pass |
| (Inter-assay) | 5.0 | 4.85 | 0.55 | 11.3 | Pass |
| 20.0 | 19.5 | 1.95 | 10.0 | Pass |
4. Ruggedness Protocol: A fractional factorial experimental design tests the method's resilience to small, deliberate operational variations. A mid-level spiked sample (5 ppm) is analyzed under 8 slightly modified conditions. Tested Variables: Incubation temperature (±2°C), incubation time (±5%), reagent lot (two different lots), and microplate washer settings (default vs. modified wash cycles). Data Presentation: Table 4: Ruggedness Test Results for Operational Variations
| Experimental Condition Variation | Measured Conc. (ppm) (n=3) | Mean Recovery (%) | Criteria Met (Recovery 85-115%) |
|---|---|---|---|
| Standard Control Conditions | 4.80 | 96.0 | Yes |
| Temp: +2°C, Time: -5% | 4.65 | 93.0 | Yes |
| Temp: -2°C, Time: +5% | 5.10 | 102.0 | Yes |
| New Reagent Lot 1 | 4.95 | 99.0 | Yes |
| Modified Wash Cycle | 5.20 | 104.0 | Yes |
| Overall Ruggedness Conclusion | All variations within acceptable limits |
The Scientist's Toolkit: Key Research Reagent Solutions Table 5: Essential Materials for Food Allergen ELISA Validation
| Item | Function in Validation |
|---|---|
| Purified Allergen Protein Standard | Provides the primary calibrant for generating the standard curve and determining LOD/LOQ. |
| Certified Allergen-Free Matrix | Critical for preparing blanks, spiked samples for accuracy/precision, and ensuring no matrix interference. |
| Monoclonal/Polyclonal Antibody Pair | Capture and detection antibodies specific to the target allergenic epitope; lot variation is tested in ruggedness. |
| HRP/TMB Detection System | Enzyme (Horseradish Peroxidase) and chromogenic substrate (TMB) for generating measurable signal. |
| Incurred Reference Material | Food material with naturally incorporated allergen; used as a secondary control to confirm method accuracy. |
| Blocking Buffer (e.g., BSA in PBS) | Reduces non-specific binding, a key factor in minimizing background noise for low-level detection. |
Visualizations
Title: ELISA Validation Parameter Workflow
Title: Core Validation Parameter Relationships
Title: Ruggedness Tested Factor Analysis
Application Notes
This analysis, framed within a thesis on ELISA protocol development for food allergen detection, contrasts two principal immunochemical techniques. The choice between ELISA and LFD is critical, dictated by the required sensitivity, throughput, and operational context.
ELISA remains the gold standard for quantitative allergen detection in food matrices, offering unparalleled sensitivity and robust quantification essential for compliance with regulatory thresholds (e.g., <1 ppm). Its high throughput is ideal for batch testing in centralized laboratories. However, its complexity necessitates skilled personnel, specialized equipment, and longer turnaround times (hours).
Lateral Flow Devices (Rapid Tests) provide qualitative or semi-quantitative results at the point of need—be it a production line, warehouse, or small laboratory. Their primary advantages are speed (minutes), ease of use, and low cost. This makes them indispensable for rapid screening and risk management. The trade-off is significantly lower sensitivity and a higher potential for matrix interference, which can lead to false negatives in complex foods.
Table 1: Core Performance Characteristics of ELISA vs. LFD for Allergen Detection
| Parameter | Sandwich ELISA | Lateral Flow Device (LFD) |
|---|---|---|
| Detection Limit | 0.1 - 1.0 ppm (µg/g) | 1.0 - 10 ppm (µg/g) |
| Assay Time | 2 - 4 hours | 5 - 20 minutes |
| Quantification | Fully Quantitative | Qualitative / Semi-Quantitative (visual or reader-based) |
| Throughput | High (96/384 wells per run) | Low (1-2 samples per device) |
| Ease of Use | Complex, requires training | Simple, minimal training |
| Instrumentation Required | Plate washer, spectrophotometer/fluorometer | None (visual) or portable reader |
| Cost per Test | Moderate to High | Low |
| Best Application | Regulatory compliance, quantification, research | Rapid screening, field use, HACCP monitoring |
Table 2: Method Validation Parameters (Exemplary Data for Peanut Allergen Ara h1)
| Validation Metric | ELISA Protocol Result | LFD Protocol Result |
|---|---|---|
| Sensitivity (LOD) | 0.15 ppm | 2.5 ppm |
| Dynamic Range | 0.5 - 25 ppm | Not Applicable (Cut-off at ~5ppm) |
| Repeatability (Intra-assay %CV) | < 8% | Not typically measured |
| Recovery in Cookie Matrix | 85-110% | 70-125% (higher variability) |
| Cross-Reactivity (Other Legumes) | < 0.1% | < 1% (potential for visual ambiguity) |
Experimental Protocols
Protocol 1: Sandwich ELISA for Quantification of Peanut Allergen in Baked Goods
Principle: A capture antibody (anti-Ara h1) immobilized on a microplate binds the target allergen from the extracted sample. A detector antibody (biotinylated anti-Ara h1) then forms a sandwich complex, which is visualized using streptavidin-enzyme conjugate and colorimetric substrate.
Materials (Research Reagent Solutions):
- Coating Buffer: 0.05 M Carbonate-Bicarbonate, pH 9.6. Function: Optimal for passive adsorption of capture antibody to polystyrene plate.
- Wash Buffer: PBS (0.01 M, pH 7.4) with 0.05% Tween 20 (PBST). Function: Removes unbound proteins, reduces non-specific background.
- Blocking Buffer: PBS with 1% Bovine Serum Albumin (BSA) or 3% non-fat dry milk. Function: Covers non-specific binding sites on the plate.
- Extraction Buffer: PBS containing 0.5% Tween 20 and 1% BSA. Function: Efficiently solubilizes allergens from complex food matrices while stabilizing proteins.
- Detection System: Biotinylated detection antibody, Streptavidin-Horseradish Peroxidase (HRP) conjugate. Function: Amplifies signal via biotin-streptavidin high-affinity interaction.
- Substrate Solution: 3,3',5,5'-Tetramethylbenzidine (TMB). Function: Chromogenic HRP substrate, yields blue product measurable at 450nm.
- Stop Solution: 1 M Sulfuric Acid (H₂SO₄). Function: Terminates enzymatic reaction, changes TMB to yellow for stable readout.
Procedure:
- Coating: Dilute capture antibody in coating buffer. Add 100 µL/well to a 96-well microplate. Incubate overnight at 4°C.
- Washing: Aspirate and wash plate 3 times with 300 µL/well of wash buffer using a microplate washer.
- Blocking: Add 200 µL/well of blocking buffer. Incubate for 1-2 hours at room temperature (RT). Wash as in step 2.
- Sample Addition: Prepare standard curve (0, 0.5, 1, 2.5, 5, 10, 25 ppm purified allergen in extraction buffer). Homogenize 1g food sample in 10mL extraction buffer, centrifuge, and dilute supernatant. Add 100 µL of standards or samples per well in duplicate. Incubate 1 hour at RT. Wash.
- Detection Antibody: Add 100 µL/well of biotinylated detection antibody in blocking buffer. Incubate 1 hour at RT. Wash.
- Enzyme Conjugate: Add 100 µL/well of Streptavidin-HRP diluted in blocking buffer. Incubate 30 minutes at RT in the dark. Wash.
- Substrate Reaction: Add 100 µL/well of TMB substrate. Incubate 10-20 minutes at RT in the dark.
- Stop & Read: Add 50 µL/well of stop solution. Measure absorbance at 450 nm within 30 minutes using a plate reader.
- Analysis: Generate a 4-parameter logistic standard curve. Calculate allergen concentration in samples from the curve, applying dilution factors.
Protocol 2: Lateral Flow Device for Screening Peanut Allergen on Food Contact Surfaces
Principle: A swab-extracted sample migrates along a nitrocellulose strip. Colloidal gold-labeled anti-allergen antibodies bind the target, and the complex is captured at the Test line by immobilized anti-allergen antibodies, producing a visible band. A Control line confirms proper flow.
Materials (Research Reagent Solutions):
- Swab Extraction Buffer: Low-salt Tris buffer with surfactants. Function: Releases adhered proteins from surfaces without damaging antibody binding sites on the LFD.
- Running Buffer: Typically supplied with the kit, contains surfactants and stabilizers. Function: Ensures consistent sample flow and stable antibody interactions on the strip.
- LFD Cassette: Contains the nitrocellulose strip with printed Test (anti-allergen) and Control (anti-species) lines, conjugate pad with gold-labeled antibodies, and absorbent pad.
Procedure:
- Sample Collection: Vigorously swab a defined surface area (e.g., 10x10 cm) with a pre-moistened swab.
- Extraction: Place the swab tip into a tube containing 1-2 mL of extraction buffer. Vortex for 30 seconds.
- Test Execution: Pipette 100 µL of the extract into the sample well of the LFD cassette. Alternatively, add the prescribed number of drops directly from the extraction tube.
- Incubation: Allow the device to develop at RT for the time specified by the manufacturer (typically 10-15 minutes).
- Interpretation: Visually inspect the cassette. Positive: Both Control (C) and Test (T) lines are visible. Negative: Only the Control (C) line is visible. Invalid: No Control line appears (repeat test).
Diagrams
Title: ELISA Workflow for Allergen Quantification
Title: Lateral Flow Test Strip Signaling Pathway
Title: ELISA vs LFD Selection Decision Tree
This Application Note provides a detailed comparative analysis between immunoassay (ELISA) and DNA-based (PCR) methods for the detection of food allergens. The content is framed within a doctoral thesis investigating the optimization of ELISA protocols for robust, quantitative allergen detection in complex food matrices. The selection of an appropriate detection method is critical for food safety, regulatory compliance, and protecting consumer health.
Methodological Principles & Applications
Enzyme-Linked Immunosorbent Assay (ELISA)
ELISA detects allergenic proteins via antigen-antibody interactions. It is the established gold standard for quantitative protein detection, offering high sensitivity and specificity for the target protein epitope.
Primary Applications: Quantitative detection of specific allergenic proteins (e.g., Ara h 1 in peanut, Gly m 5 in soy) in finished products, raw materials, and environmental swabs. Ideal for verifying cleaning procedures and compliance with labeling thresholds.
Polymerase Chain Reaction (PCR)
PCR detects DNA sequences specific to the allergenic species. It amplifies a target DNA fragment, making it highly sensitive to trace amounts of genetic material, but does not directly measure the allergenic protein itself.
Primary Applications: Qualitative or semi-quantitative detection of species-specific DNA in processed foods where proteins may be denatured. Highly effective for multi-allergen screening and detecting allergens from closely related species (e.g., different tree nuts).
Table 1: Core Comparative Characteristics of ELISA and PCR for Allergen Detection
| Parameter | ELISA (Protein-Based) | PCR (DNA-Based) |
|---|---|---|
| Target Molecule | Protein (allergen epitope) | DNA (species-specific sequence) |
| Detection Principle | Antigen-Antibody Binding + Enzymatic Reaction | DNA Hybridization + Enzymatic Amplification |
| Quantitative Output | Yes, directly proportional to protein | Semi-quantitative (indirect); correlates to DNA copy number |
| Typical Sensitivity | Low ppm (µg/g) to ppb (ng/g) range | Very high; often <10 DNA copies |
| Effect of Food Processing | May degrade target epitopes; can lead to underestimation | DNA is more stable to heat/processing; potential for overestimation of risk |
| Specificity | Protein/epitope-specific (e.g., peanut vs. soy) | Species-specific (e.g., Arachis hypogaea) |
| Time to Result | ~2 - 3 hours | ~2 - 4 hours (including DNA extraction) |
| Key Interference | Matrix effects, protein aggregation, cross-reactive antibodies | PCR inhibitors (polyphenols, polysaccharides), DNA fragmentation |
| Regulatory Acceptance | Widely accepted for compliance testing | Accepted as a screening tool; used alongside ELISA for confirmation |
Table 2: Performance in Challenging Matrices (Thesis Context)
| Food Matrix | ELISA Performance Consideration | PCR Performance Consideration |
|---|---|---|
| Fermented/ Hydrolyzed | Critical Loss. Protein fragments may lack epitopes, leading to false negatives. | Advantageous. DNA may remain amplifiable despite protein degradation. |
| Heated/ Roasted | Variable. Some epitopes are heat-stable, others are denatured. | Good. DNA thermostability is high, though fragmentation can occur. |
| High Fat/Oil | Can impede protein extraction. Requires optimized extraction buffers. | Co-extraction of PCR inhibitors likely. Requires purification or inhibitor-resistant enzymes. |
| Chocolate | Tannins can interfere with antibody binding. | Potent PCR inhibitors present. Requires robust DNA clean-up protocols. |
Detailed Experimental Protocols
Protocol: Sandwich ELISA for Peanut Allergen (Ara h 1) Quantification
This protocol is central to the thesis research on optimizing extraction and detection for low-dose contamination.
I. Materials & Reagents
- Microplate pre-coated with capture antibody (anti-Ara h 1 monoclonal).
- Allergen protein standards (purified native Ara h 1, 0-100 ng/mL).
- Test samples (extracted food homogenates).
- Detection antibody (biotinylated anti-Ara h 1 monoclonal).
- Streptavidin-Horseradish Peroxidase (HRP) conjugate.
- Wash Buffer (PBS with 0.05% Tween-20).
- Blocking Buffer (PBS with 1% BSA or proprietary blocker).
- TMB (3,3’,5,5’-Tetramethylbenzidine) substrate solution.
- Stop Solution (1M Sulfuric Acid or Phosphoric Acid).
- Microplate washer and reader (450 nm).
II. Procedure
- Extraction: Homogenize 2g food sample in 20mL extraction buffer (PBS, pH 7.4, with 1% BSA and 0.5% Tween-20). Centrifuge (4,500xg, 15 min). Collect supernatant.
- Plate Setup: Add 100 µL of standards and sample extracts (diluted if necessary) to designated wells. Include blanks. Incubate 60 min at room temperature (RT) on plate shaker.
- Wash: Aspirate and wash plate 4x with 300 µL Wash Buffer.
- Detection Antibody: Add 100 µL biotinylated detection antibody. Incubate 60 min at RT. Wash as in step 3.
- Enzyme Conjugate: Add 100 µL Streptavidin-HRP. Incubate 30 min at RT, protected from light. Wash as in step 3.
- Substrate Reaction: Add 100 µL TMB substrate. Incubate 15 min at RT in dark.
- Stop & Read: Add 100 µL Stop Solution. Measure absorbance at 450 nm within 30 min.
- Analysis: Generate standard curve (4-parameter logistic fit). Calculate allergen concentration in sample from curve, applying dilution factor.
Protocol: Real-Time PCR (SYBR Green) for Detection of Hazelnut (Corylus avellana) DNA
I. Materials & Reagents
- Food sample (ground or homogenized).
- Commercial plant/food DNA extraction kit (with inhibitor removal).
- PCR-grade water.
- Primer pair specific for Corylus avellana (e.g., targeting Cor a 1 gene).
- SYBR Green Master Mix (containing DNA polymerase, dNTPs, buffer, dye).
- Real-time PCR instrument and optical plates/seals.
- DNA standard (purified hazelnut genomic DNA) for quantification.
II. Procedure
- DNA Extraction: Use commercial kit following manufacturer's instructions for difficult matrices (e.g., chocolate). Include a negative extraction control. Elute DNA in 50-100 µL elution buffer. Measure DNA purity (A260/A280) and concentration.
- PCR Reaction Mix (25 µL total):
- SYBR Green Master Mix: 12.5 µL
- Forward Primer (10 µM): 0.5 µL
- Reverse Primer (10 µM): 0.5 µL
- Template DNA (or standard): 2 µL (adjust volume for ~10-100 ng total DNA)
- PCR-grade water: to 25 µL
- qPCR Cycling Program:
- Initial Denaturation: 95°C for 10 min.
- 40 Cycles of:
- Denaturation: 95°C for 15 sec.
- Annealing/Extension: 60°C for 60 sec (acquire SYBR Green signal).
- Melting Curve Analysis: 65°C to 95°C, increment 0.5°C.
- Analysis: Determine Cycle Threshold (Ct) values. For qualitative detection, a Ct value below a validated cutoff (e.g., Ct < 38) indicates presence. For semi-quantitation, use the standard curve of known DNA concentrations to estimate target DNA amount in sample.
Visualizations
Title: ELISA vs PCR Selection Workflow
Title: ELISA Sandwich Assay Signaling Pathway
The Scientist's Toolkit: Research Reagent Solutions
Table 3: Essential Reagents & Materials for Allergen Detection Research
| Item | Function & Importance |
|---|---|
| Monoclonal Antibody Pair (Capture/Detection) | Provides high specificity for the target protein epitope. Critical for developing sensitive, reproducible sandwich ELISAs with low cross-reactivity. |
| Purified Native or Recombinant Allergen Standard | Serves as the quantitative calibrant for ELISA. Purity and stability are paramount for accurate standard curves. Used also for antibody characterization and spiking experiments. |
| Matrix-Matched Reference Material | Certified reference material (CRM) with known allergen content. Essential for method validation, assessing recovery, and compensating for matrix effects. |
| PCR-Inhibitor Resistant DNA Polymerase | Enzyme blends designed to tolerate common food-derived PCR inhibitors (polyphenols, polysaccharides). Crucial for reliable DNA amplification from complex matrices like chocolate or spices. |
| Species-Specific Primer/Probe Set | Oligonucleotides designed for high specificity to the target species' DNA. Validated for no cross-reactivity with related species. Probe-based assays (TaqMan) offer higher specificity than SYBR Green. |
| Commercial Allergen Extraction Buffer | Optimized for maximum protein solubilization and stabilization while minimizing interference. Often contains blockers to reduce non-specific binding in ELISA. |
| Magnetic Bead-Based Nucleic Acid Extraction Kit | Allows for automated, high-throughput DNA purification with effective removal of PCR inhibitors. Improves consistency and sensitivity of downstream PCR. |
| HRP or AP Conjugate & Chemiluminescent Substrate | For high-sensitivity ELISA applications. Chemiluminescence offers a wider dynamic range and lower detection limits compared to colorimetric (TMB) detection. |
| Multiplex PCR or ELISA Kit | Enables simultaneous detection of multiple allergens in a single reaction. Increases throughput for screening purposes and is cost-effective. |
Within the broader thesis investigating ELISA protocol optimization for food allergen detection, it is critical to evaluate the fundamental performance characteristics of the established immunoassay platform against the emerging gold standard, liquid chromatography-tandem mass spectrometry (LC-MS/MS). This comparative analysis provides the necessary context for interpreting ELISA data, understanding its limitations, and defining its appropriate application in research and regulatory science. The choice between ELISA and LC-MS/MS impacts sensitivity, specificity, multiplexing capability, and the type of analyte detected (protein vs. peptide).
Core Analytical Principle and Target Analyte
- ELISA (Enzyme-Linked Immunosorbent Assay): An immunoassay that detects intact allergen proteins via antigen-antibody binding. The signal is generated enzymatically, producing a colorimetric, fluorescent, or chemiluminescent readout proportional to the allergen concentration.
- LC-MS/MS (Liquid Chromatography-Tandem Mass Spectrometry): A physicochemical technique that detects signature peptides derived from allergen proteins via proteolytic digestion (e.g., trypsin). Analytes are separated by liquid chromatography, ionized, and detected based on their mass-to-charge ratio (m/z) and fragmentation patterns in a mass spectrometer.
Quantitative Performance Comparison
Table 1: Comparative Performance Metrics of ELISA and LC-MS/MS for Allergen Detection
| Parameter | ELISA (Sandwich) | LC-MS/MS (Targeted) | Implications for Research |
|---|---|---|---|
| Analytical Target | Intact protein (epitope-dependent) | Signature peptide (sequence-dependent) | LC-MS/MS is less affected by protein denaturation. |
| Limit of Detection (LOD) | 0.1 - 5 ppm (mg allergen/kg food) | 1 - 10 ppm (can be lower for some allergens) | ELISA often has lower practical LOD for native proteins. |
| Quantitative Dynamic Range | ~2 log units | 3-4 log units | LC-MS/MS better for samples with extreme concentration ranges. |
| Specificity | High risk of cross-reactivity with related proteins | Extremely high; defined by unique peptide sequences | LC-MS/MS minimizes false positives from matrix interference. |
| Multiplexing Capacity | Low (typically 1-3 allergens/well); higher with array formats | High (theoretically 100s of allergens in a single run) | LC-MS/MS is superior for multi-allergen screening. |
| Throughput | High (96/384-well plate, automated) | Moderate (longer run times, but automated data analysis) | ELISA wins for rapid, high-sample-number analysis. |
| Matrix Effects | Susceptible to food matrix interference (e.g., polyphenols, tannins) | Can be mitigated with stable isotope-labeled internal standards (SIS) | LC-MS/MS with SIS provides superior accuracy in complex matrices. |
| Standardization | Method-dependent; relies on antibody and protein standard quality | Based on universal physico-chemical principles; requires peptide standards. | LC-MS/MS methods are more transferable between labs. |
| Capital & Operational Cost | Lower initial investment; higher consumable cost per analyte | Very high initial investment; lower cost per analyte in multiplex. | Choice depends on scale and scope of testing. |
Detailed Experimental Protocols
Protocol A: Competitive ELISA for Processed Allergen Detection (From Thesis Work)
Application: Quantification of a specific allergen (e.g., β-lactoglobulin) in heat-processed foods where protein epitopes may be denatured. Principle: Free allergen in samples competes with a fixed amount of immobilized allergen for binding to a limited concentration of enzyme-labeled antibody.
Procedure:
- Coating: Coat a 96-well plate with 100 µL/well of purified allergen extract (2-5 µg/mL in carbonate-bicarbonate buffer, pH 9.6). Incubate overnight at 4°C.
- Blocking: Wash plate 3x with PBS-T (Phosphate Buffered Saline with 0.05% Tween-20). Add 200 µL/well of blocking buffer (1% BSA in PBS-T). Incubate for 2 hours at 37°C. Wash 3x.
- Competition: Prepare mixtures of sample/standard (50 µL) and constant dilution of enzyme-conjugated detection antibody (50 µL) in blocking buffer. Add 100 µL of this mixture to each well. Incubate for 1 hour at 37°C. Wash 5x.
- Detection: Add 100 µL/well of TMB (3,3',5,5'-Tetramethylbenzidine) substrate. Incubate for 15 minutes in the dark.
- Stop & Read: Add 50 µL/well of 1M H₂SO₄ to stop reaction. Measure absorbance immediately at 450 nm using a microplate reader.
- Analysis: Plot %B/B0 (Bound/Maximum Bound) against log allergen concentration to generate a standard curve for sample quantification.
Protocol B: LC-MS/MS for Multi-Allergen Detection in Chocolate
Application: Simultaneous detection and quantification of peanut, hazelnut, milk, and egg allergens in a complex, challenging matrix. Principle: Proteins are extracted, enzymatically cleaved into peptides, and unique signature peptides are quantified using multiple reaction monitoring (MRM) with stable isotope-labeled internal standards (SIS).
Procedure:
- Protein Extraction: Homogenize 1 g of chocolate sample. Extract proteins with 10 mL of extraction buffer (2% SDS, 50 mM Tris-HCl, pH 8.2, 5 mM DTT) at 60°C for 30 min with shaking.
- Protein Clean-up & Digestion: Purify proteins using a commercial filter-aided sample prep (FASP) kit. Alkylate with iodoacetamide. Digest with trypsin (1:50 enzyme-to-protein ratio) overnight at 37°C.
- Peptide Clean-up: Desalt peptides using C18 solid-phase extraction (SPE) columns. Dry under vacuum and reconstitute in 100 µL of 0.1% formic acid in water.
- LC-MS/MS Analysis (MRM):
- LC: Inject 10 µL onto a reverse-phase C18 column (2.1 x 100 mm, 1.7 µm). Use a gradient of water and acetonitrile (both with 0.1% formic acid) from 5% to 35% acetonitrile over 15 min.
- MS/MS: Use a triple quadrupole MS. For each allergen's signature peptide and its co-eluting SIS peptide, monitor 2-3 specific precursor ion → product ion transitions in MRM mode.
- Quantification: Calculate the ratio of the peak area of the native peptide to its corresponding SIS peptide. Use a matrix-matched calibration curve (blank chocolate spiked with known allergen amounts) for absolute quantification.
Visualized Workflows
Diagram 1: ELISA workflow for protein detection.
Diagram 2: LC-MS/MS workflow for peptide detection.
Diagram 3: Decision factors for ELISA versus LC-MS/MS.
The Scientist's Toolkit: Essential Research Reagent Solutions
Table 2: Key Reagents and Materials for Allergen Detection Methods
| Item | Function in ELISA | Function in LC-MS/MS |
|---|---|---|
| Monoclonal/Polyclonal Antibodies | Critical for capture and detection; defines specificity and sensitivity. | Not used in the assay itself. Used for immunoaffinity enrichment prior to MS in some protocols. |
| Purified Allergen Protein Standards | Essential for generating calibration curves and coating plates. | Used to optimize digestion and confirm peptide identities during method development. |
| Stable Isotope-Labeled Peptide Standards (SIS) | Not applicable. | Critical. Internal standards that correct for peptide loss, ionization variance, and matrix effects, enabling accurate quantification. |
| Tryptic Digest Kit (Trypsin) | Not typically used. | Core reagent. Enzymatically cleaves proteins into detectable signature peptides. |
| Blocking Agent (BSA, Casein) | Prevents non-specific antibody binding to the well surface. | Not used in the final assay. May be used in extraction buffers. |
| Chromogenic/Fluorescent Substrate (e.g., TMB, AP) | Generates the measurable signal from the enzyme-antibody conjugate. | Not applicable. |
| LC-MS Grade Solvents (ACN, MeOH, FA) | Not required. | Essential. Minimizes background noise and ion suppression in the mass spectrometer. |
| Solid-Phase Extraction (SPE) Cartridges (C18) | Not typically used. | For desalting and cleaning up peptide digests prior to LC-MS/MS injection. |
| Denaturing/Reducing Agents (SDS, Urea, DTT) | May be used in harsh extraction buffers for processed foods. | Standard. Used in protein extraction and digestion steps to denature and linearize proteins. |
Importance of Reference Materials and Proficiency Testing for Method Validation.
Application Notes
In the validation of ELISA methods for food allergen detection, the use of certified reference materials (CRMs) and participation in proficiency testing (PT) schemes are non-negotiable pillars of analytical credibility. Their role is critical for establishing method performance characteristics such as accuracy, precision, and limit of detection, ultimately ensuring reliable data for regulatory compliance and consumer safety.
Role of Reference Materials: CRMs provide an anchor for method calibration and trueness assessment. For food allergens, matrix-matched CRMs (e.g., incurred peanut protein in cookie material) are essential to account for extraction efficiency and matrix interferences, which are significant challenges. The quantitative data from validation using such materials forms the basis of the method's measurement uncertainty.
Role of Proficiency Testing: PT provides an external, unbiased assessment of method performance under real-world conditions. It benchmarks a laboratory's capability against peers and identifies systematic biases. Consistent successful participation in PT schemes is the ultimate demonstration of a validated method's ruggedness and the laboratory's competence.
Summary of Quantitative Data from Validation Studies:
Table 1: Key Performance Characteristics for an ELISA Method Validated Using CRM and PT
| Performance Characteristic | Target Value | Achieved Value (Example: Peanut Allergen) | Assessment Tool |
|---|---|---|---|
| Accuracy (Trueness) | Bias < ±20% | Mean recovery of 92% from CRM | Certified Reference Material (CRM) |
| Precision (Repeatability) | RSDr < 10% | RSDr of 6.5% | In-house replicated analysis of CRM |
| Precision (Reproducibility) | RSDR < 15% | RSDR of 12% | Inter-laboratory PT Scheme data |
| Limit of Detection (LOD) | As low as technically feasible | 0.5 ppm (mg/kg) | Statistical analysis of blank/low-spike CRM |
| Limit of Quantification (LOQ) | LOQ ≤ Regulatory Action Level | 2.0 ppm (mg/kg) | Validation with CRM at target LOQ |
| Measurement Uncertainty | To be established | ±25% at 10 ppm (k=2) | Combined uncertainty from CRM & PT data |
Table 2: Outcomes from Proficiency Testing (PT) Rounds
| PT Round | Allergen | Matrix | Assigned Value (ppm) | Laboratory Result (ppm) | z-Score | Performance |
|---|---|---|---|---|---|---|
| PT-2023-01 | Milk | Dark Chocolate | 50.0 | 52.1 | +0.42 | Satisfactory |
| PT-2023-02 | Egg | Pancake Mix | 125.0 | 108.5 | -1.32 | Satisfactory |
| PT-2023-03 | Hazelnut | Biscuit | 5.0 | 6.8 | +1.81 | Satisfactory |
| PT-2024-01 | Peanut | Cookie (Incurred) | 10.0 | 12.5 | +2.45 | Questionable |
Experimental Protocols
Protocol 1: Method Trueness Assessment Using Certified Reference Material
Objective: To determine the accuracy (recovery) of the ELISA method for quantitating peanut protein in a cooked cookie matrix.
Materials: See "The Scientist's Toolkit" below.
Procedure:
- CRM Reconstitution: Precisely weigh and homogenize the matrix CRM according to the certificate's instructions.
- Extraction: Weigh five independent test portions (1.0 g ± 0.01 g) of the homogenized CRM into 50 mL centrifuge tubes.
- Add 10 mL of the designated extraction buffer (typically a phosphate-based buffer with detergent).
- Vortex vigorously for 1 minute, then shake on an orbital platform shaker for 60 minutes at room temperature.
- Centrifuge at 4,500 x g for 20 minutes at 20°C.
- Carefully decant the supernatant into a clean tube. Filter through a 0.45 µm syringe filter prior to ELISA analysis.
- ELISA Analysis: Analyze each of the five extracts in duplicate on the validated peanut ELISA kit. Include the kit's calibrators in the same run.
- Data Analysis:
- Calculate the mean measured concentration for the five extracts.
- Calculate percentage recovery: (Mean Measured Concentration / Certified Value) x 100%.
- Acceptance criterion: Mean recovery within 80-120%.
Protocol 2: Ongoing Verification via Proficiency Testing Participation
Objective: To externally verify the method's performance and laboratory competence.
Procedure:
- PT Scheme Registration: Enroll in an accredited PT scheme (e.g., FAPAS, AES).
- Sample Receipt & Handling: Upon receipt, record PT sample conditions and store as specified. Treat the sample as "unknown."
- Homogeneous Sub-sampling: If the sample is a dry powder or paste, homogenize thoroughly before sub-sampling for analysis.
- Blind Analysis: Analyze the PT sample using the validated ELISA protocol (as in Protocol 1) in a single run, under standard conditions. Perform analysis in duplicate.
- Result Submission: Report the mean of the duplicate results to the PT provider by the deadline.
- Performance Evaluation: Upon receiving the report, evaluate the z-score:
- |z| ≤ 2.0: Satisfactory performance.
- 2.0 < |z| < 3.0: Questionable performance. Investigate.
- |z| ≥ 3.0: Unsatisfactory performance. Conduct root cause analysis and corrective action.
Mandatory Visualizations
Validation Pillars for ELISA Reliability
CRM-Based Trueness Assessment Workflow
The Scientist's Toolkit
Table 3: Key Research Reagent Solutions for Allergen ELISA Validation
| Item | Function in Validation |
|---|---|
| Matrix-Certified Reference Material (CRM) | Provides a material with a known, stable, and homogenous allergen concentration in a relevant food matrix. Essential for determining method accuracy (trueness) and precision. |
| Proficiency Testing (PT) Samples | External "blind" samples used for independent assessment of method and laboratory performance, testing the entire analytical process. |
| ELISA Kit (Allergen Specific) | Validated commercial kit containing all necessary antibodies, calibrators, and reagents for the specific immunochemical detection and quantitation. |
| Extraction Buffer (Kit Specific or Validated) | Optimized buffer solution to efficiently and reproducibly solubilize the target allergen protein from the complex food matrix. |
| Microplate Washer & Reader | Automated instrumentation for consistent plate washing (removing unbound material) and accurate optical density measurement of the colorimetric signal. |
| Analytical Balance (0.1 mg sensitivity) | For precise weighing of CRM, PT samples, and test portions, as errors here propagate through the entire analysis. |
| Centrifuge with Temperature Control | For separating solid food matrix from the extracted protein solution after extraction, under controlled conditions. |
| Vortex Mixer & Orbital Shaker | For achieving complete homogenization of samples and efficient allergen extraction during the incubation step. |
Within a thesis focusing on ELISA protocol development for food allergen detection, the choice between in-house developed and commercial ELISA kits is critical. This application note presents case studies comparing the validation parameters of both approaches, providing detailed protocols for researchers in food safety and biomedical fields.
Key Validation Parameters: Comparative Data
The following tables summarize quantitative validation data from recent studies comparing in-house and commercial ELISA kits for major food allergens.
Table 1: Analytical Sensitivity and Specificity Comparison for Peanut Allergen (Ara h 1) Detection
| Parameter | In-House ELISA Kit (Polyclonal) | Commercial ELISA Kit A | Commercial ELISA Kit B |
|---|---|---|---|
| Limit of Detection (LOD) | 0.12 mg/kg | 0.25 mg/kg | 0.50 mg/kg |
| Limit of Quantification (LOQ) | 0.40 mg/kg | 0.75 mg/kg | 1.25 mg/kg |
| Dynamic Range | 0.4 - 50 mg/kg | 0.75 - 100 mg/kg | 1.25 - 200 mg/kg |
| Cross-Reactivity (Soy) | 2.5% | <0.5% | <0.1% |
| Cross-Reactivity (Lupin) | 1.8% | 0.8% | 1.2% |
| Intra-Assay CV | 6.2% | 5.1% | 7.8% |
| Inter-Assay CV | 10.5% | 8.2% | 12.3% |
Table 2: Recovery Rates in Complex Food Matrices (Milk Allergen Casein)
| Food Matrix | Spiked Concentration (mg/kg) | In-House ELISA Recovery (%) | Commercial ELISA Recovery (%) |
|---|---|---|---|
| Dark Chocolate | 5.0 | 78.5 ± 8.2 | 85.4 ± 6.5 |
| Cooked Sausage | 10.0 | 92.1 ± 5.1 | 94.7 ± 4.3 |
| Granola Bar | 2.5 | 105.3 ± 9.8 | 98.2 ± 7.1 |
| Tomato Sauce | 1.0 | 68.4 ± 12.3 | 88.9 ± 5.7 |
Detailed Experimental Protocols
Protocol 1: In-House Indirect ELISA Development for Gluten Detection
Objective: To develop and validate an in-house indirect ELISA for quantification of gluten (gliadin) in processed foods.
Materials:
- Coating Buffer: 0.05 M Carbonate-Bicarbonate buffer, pH 9.6.
- Blocking Buffer: Phosphate-Buffered Saline (PBS) with 1% Bovine Serum Albumin (BSA) and 0.05% Tween-20.
- Wash Buffer: PBS with 0.1% Tween-20 (PBST).
- Primary Antibody: Rabbit polyclonal anti-gliadin IgG.
- Secondary Antibody: Horseradish Peroxidase (HRP)-conjugated goat anti-rabbit IgG.
- Substrate: 3,3',5,5'-Tetramethylbenzidine (TMB).
- Stop Solution: 2 M Sulfuric Acid (H₂SO₄).
- Microplate Reader (450 nm).
Methodology:
- Coating: Dilute purified gliadin standard or extracted food sample proteins in coating buffer. Add 100 µL per well to a 96-well microplate. Incubate overnight at 4°C.
- Washing: Aspirate contents and wash plate 3 times with 300 µL PBST using an automated plate washer.
- Blocking: Add 200 µL of blocking buffer per well. Incubate for 2 hours at room temperature (RT) on a plate shaker. Wash 3 times.
- Primary Antibody Incubation: Dilute anti-gliadin primary antibody in blocking buffer. Add 100 µL per well. Incubate for 1.5 hours at RT. Wash 5 times.
- Secondary Antibody Incubation: Dilute HRP-conjugated secondary antibody in blocking buffer. Add 100 µL per well. Incubate for 1 hour at RT in the dark. Wash 5 times.
- Signal Detection: Add 100 µL of TMB substrate per well. Incubate for exactly 15 minutes at RT in the dark.
- Stop Reaction & Measurement: Add 50 µL of stop solution per well. Measure absorbance at 450 nm within 30 minutes.
Protocol 2: Validation of a Commercial Almond Allergen ELISA Kit
Objective: To perform a standard validation for a commercial sandwich ELISA kit for almond (Pru du 6) detection according to AOAC guidelines.
Materials:
- Commercial Almond ELISA Kit (includes pre-coated plate, standards, antibodies, and substrates).
- Test food samples (raw and baked).
- Required extraction buffers (as per kit instructions).
Methodology:
- Sample Extraction: Homogenize 1 g of food sample with 10 mL of the provided extraction buffer. Shake vigorously for 30 minutes at RT. Centrifuge at 3000 x g for 15 minutes. Filter supernatant.
- Standard & Sample Preparation: Reconstitute the provided almond protein standard. Prepare a 7-point standard curve via serial dilution. Dilute sample extracts as needed within the kit's stated range.
- Assay Procedure: Follow the manufacturer's protocol precisely. Typically, this involves:
- Adding 50 µL of standard or sample to appropriate wells.
- Adding 50 µL of antibody-enzyme conjugate to each well.
- Incubating for a specified time (e.g., 60 min) at RT with shaking.
- Washing 5 times with provided wash buffer.
- Adding 100 µL of substrate solution. Incubating for 15 min at RT.
- Adding stop solution and reading at 450 nm.
- Data Analysis: Generate a standard curve (4-parameter logistic fit is recommended). Calculate allergen concentration in samples using the curve, applying any dilution factors.
Visualizations
Diagram Title: ELISA Kit Validation Workflow & Core Metrics
Diagram Title: In-House vs. Commercial ELISA Decision Factors
The Scientist's Toolkit: Key Research Reagent Solutions
| Item | Function in ELISA for Allergen Detection | Key Considerations |
|---|---|---|
| High-Affinity Capture Antibodies | Specifically binds the target allergen/epitope immobilized on the plate. Critical for assay sensitivity and specificity. | Monoclonal preferred for consistency; polyclonal may offer broader epitope recognition. Source (e.g., mouse, rabbit) affects conjugate pairing. |
| Detection Antibodies (HRP/AP Conjugated) | Binds to the captured allergen, generating a measurable signal via enzymatic reaction. | Conjugate choice (HRP vs. Alkaline Phosphatase) depends on substrate and sample matrix (e.g., HRP sensitive to azides). |
| Food Matrix-Matched Standards | Purified or recombinant allergen proteins used to generate the standard curve for quantification. | Must be immunologically identical to the native allergen in food. Matrix-matched calibration corrects for extraction efficiency. |
| Blocking Agents (BSA, Casein, etc.) | Prevents non-specific binding of antibodies to the plate or sample components, reducing background noise. | Choice depends on allergen; e.g., non-milk protein blockers for dairy allergen assays. |
| Specialized Extraction Buffers | Efficiently releases the target allergen from complex food matrices while preserving its immunoreactivity. | Must overcome processing effects (heat, pH). Often contain detergents, reducing agents, and protease inhibitors. |
| Chemiluminescent/Luminescent Substrates | Provides the signal amplified by the enzyme-conjugated detection antibody. | Luminescent substrates offer higher sensitivity than colorimetric (TMB) but may require more specialized equipment. |
| Stable Reference Materials (CRM) | Certified food powders with known allergen levels, used for method validation and quality control. | Essential for inter-laboratory comparison and demonstrating method accuracy against a benchmark. |
1. Introduction Within a thesis on ELISA protocol development for food allergen detection, robust data interpretation and reporting are not merely academic exercises but critical components for regulatory compliance. Agencies like the FDA (USA), EFSA (EU), and Codex Alimentarius mandate stringent guidelines for analytical method validation and data reporting to ensure food safety. This application note outlines protocols and frameworks for interpreting and reporting ELISA-derived allergen data in a compliant manner.
2. Regulatory Validation Parameters: Data Interpretation Framework Method validation for quantitative allergen ELISAs requires interpretation against predefined performance criteria. Key quantitative parameters, based on current guidelines (e.g., AOAC INTERNATIONAL, USP), are summarized below.
Table 1: Key Analytical Validation Parameters and Compliance Criteria for Quantitative Allergen ELISA
| Parameter | Experimental Protocol | Compliance Criteria | Typical Target Value for Allergen ELISA |
|---|---|---|---|
| Limit of Detection (LoD) | Analyze at least 20 matrix blank samples. LoD = Mean(blank) + 3*SD(blank). Confirm with low-level spiked samples. | Signal must be distinguishable from blank with 95% confidence. | < 2 ppm allergen protein in food matrix. |
| Limit of Quantification (LoQ) | Analyze at least 20 matrix samples spiked at LoQ level. LoQ = Mean(blank) + 10*SD(blank). Assess precision and accuracy at this level. | CV ≤ 20% and recovery of 80-120%. | Typically 5-10 ppm allergen protein. |
| Precision (Repeatability) | Intra-assay: Analyze 6 replicates of low, mid, high concentration spiked samples in one run. Inter-assay: Analyze same in 3 separate runs. | Intra-assay CV ≤ 15%. Inter-assay CV ≤ 20%. | CV < 10% (intra), < 15% (inter). |
| Accuracy (Recovery) | Spike known allergen concentrations into various negative food matrices (e.g., cookie, sauce). Analyze via ELISA. | Mean recovery between 80-120%. | 90-110% recovery. |
| Specificity/Cross-Reactivity | Test ELISA against a panel of related and unrelated food proteins. Calculate: %Cross-Reactivity = (Measured conc. of interferent / Actual conc. of target)*100. | Minimal cross-reactivity (<5%) with non-target proteins. Must detect all relevant allergenic protein isoforms. | <1% with unrelated species. |
| Matrix Effects | Compare standard curve in buffer vs. in matrix extract (diluted). Assess curve parallelism and signal suppression/enhancement. | Standard curves should be parallel. Matrix factor (MF) should be 0.8-1.2. | Minimal deviation; addressed via adequate dilution. |
3. Protocol: Comprehensive Validation Study for an In-House Peanut Allergen ELISA Objective: To validate an in-house sandwich ELISA for Ara h 1 quantification in baked goods per regulatory guidelines. Materials: See "Scientist's Toolkit" below. Workflow:
- Sample Preparation: Homogenize 10g of control (peanut-free) matrix. Spike with purified Ara h 1 at LoQ, Low (2xLoQ), Mid (50 ppm), and High (100 ppm) levels. Perform protein extraction using PBS-Tween buffer (1:10 w/v), centrifuge, and filter.
- ELISA Execution: Run assay in triplicate for each level across three independent days. Include a standard curve (0, 2, 5, 10, 25, 50, 100 ppm) on each plate.
- Data Analysis: Generate a 4-parameter logistic (4PL) standard curve. Interpolate sample concentrations. Calculate mean, SD, CV%, and %Recovery for each level.
- Statistical Reporting: Compile all data into a validation summary report. For each parameter (Table 1), report calculated value, acceptance criteria, and pass/fail status. Use outlier tests (e.g., Grubbs') where applicable.
4. The Scientist's Toolkit: Research Reagent Solutions Table 2: Essential Materials for Compliant Allergen ELISA Validation
| Item | Function & Compliance Relevance |
|---|---|
| Certified Reference Material (CRM) | Purified, quantified allergenic protein (e.g., NIST RM 2387 Peanut Butter). Provides traceable standard for calibration and accuracy assessment. |
| Matrix-Matched Negative Controls | Verified allergen-free food matrices (e.g., wheat flour, chocolate). Essential for determining LoD/LoQ and assessing matrix effects accurately. |
| Multi-Antibody Pairs (Capture/Detection) | Monoclonal or polyclonal antibodies targeting different epitopes of the allergen. Enhances specificity and reduces risk of false negatives from processed allergens. |
| Standardized Extraction Buffer | Buffer with consistent pH, ionic strength, and surfactants (e.g., PBS with 0.1% Tween-20, 1% BSA). Ensures reproducible recovery and minimizes variability. |
| Laboratory Information Management System (LIMS) | Software for tracking samples, managing calibration data, and maintaining audit trails. Critical for data integrity under 21 CFR Part 11. |
| Quality Control (QC) Charts | Visual tools (e.g., Levey-Jennings charts) plotting results of control samples across runs. Monitors assay performance and identifies drift. |
5. Data Reporting for Regulatory Submission A compliant report must include:
- Executive Summary: Method scope and performance conclusion.
- Detailed Methodology: SOP with any deviations.
- Complete Data Set: All raw data (absorbance values), standard curves, calculations.
- Statistical Analysis: Summary tables for validation parameters.
- Uncertainty of Measurement: Combined standard uncertainty from precision, accuracy, and calibration curve fitting.
- Statement of Compliance: Direct mapping of results to regulatory requirements (e.g., Commission Regulation (EU) No 1169/2011).
Diagram 1: ELISA Data Workflow for Compliance
Diagram 2: Regulatory Drivers for Validation
Conclusion
ELISA remains a cornerstone technology for sensitive, quantitative food allergen detection due to its specificity, throughput, and relative accessibility. Success hinges on a deep understanding of foundational immunology, meticulous execution of protocols with rigorous optimization for complex matrices, and comprehensive validation against defined performance criteria. While ELISA is highly effective for monitoring major allergens, researchers must be aware of its limitations regarding detectability of denatured epitopes and potential cross-reactivity. The future of allergen analysis lies in method harmonization and the strategic combination of ELISA with confirmatory techniques like LC-MS/MS for unparalleled accuracy. For biomedical research, robust allergen detection protocols are critical not only for food safety but also for informing clinical threshold studies, improving diagnostic assays, and supporting the development of novel therapeutics for food allergy.