ELISA for Urine Biomarkers: A Comprehensive Protocol Guide for Researchers and Clinical Scientists
This article provides a detailed, step-by-step guide for performing ELISA assays on urine samples, a crucial but challenging matrix in biomarker research and drug development.
ELISA for Urine Biomarkers: A Comprehensive Protocol Guide for Researchers and Clinical Scientists
Abstract
This article provides a detailed, step-by-step guide for performing ELISA assays on urine samples, a crucial but challenging matrix in biomarker research and drug development. It covers the foundational principles of adapting ELISA to urine, a complete methodological workflow from sample collection to data analysis, common troubleshooting and optimization strategies specific to urinary analytes, and validation approaches to ensure assay reliability. Designed for researchers, scientists, and drug development professionals, this guide synthesizes current best practices to ensure accurate, reproducible quantification of proteins, cytokines, and other biomarkers in urine for preclinical and clinical applications.
Why ELISA on Urine? Understanding the Matrix, Challenges, and Key Applications in Research
Urine is an increasingly valued biofluid in clinical diagnostics and biomedical research, offering a non-invasive, readily available, and information-rich matrix. Its composition reflects both systemic physiological states and local urogenital tract conditions, providing a window into metabolic, inflammatory, and infectious processes. For researchers, particularly in drug development, urine sampling facilitates longitudinal studies with high participant compliance. Within the context of developing and optimizing ELISA protocols for urine, understanding its unique advantages and pre-analytical variables is paramount for generating reliable, reproducible data.
Application Notes: Key Considerations for Urine Analysis
- Pre-Analytical Variables: Urine composition is highly variable. Standardization of collection, processing, and storage is critical.
- Normalization: Due to variable hydration, analyte concentrations in urine are often normalized to urinary creatinine to account for dilution effects.
- Matrix Effects: Urine contains salts, urea, and other compounds that can interfere with immunoassays. Optimization of ELISA protocols, including sample dilution and buffer composition, is essential to mitigate this.
- Analyte Stability: The stability of target analytes (e.g., proteins, cytokines, drug metabolites) in urine post-collection must be empirically determined to define appropriate handling protocols.
Quantitative Advantages of Urine Sampling
Table 1: Comparative Analysis of Biofluid Sampling Methods
| Parameter | Blood (Serum/Plasma) | Urine | Saliva | Tissue Biopsy |
|---|---|---|---|---|
| Invasiveness | High (Venipuncture) | Non-Invasive | Non-Invasive | High (Surgical) |
| Collection Volume | Limited (ml) | High (10s-100s ml) | Limited (<1-2 ml) | Very Limited (mg-g) |
| Collection Frequency | Low | High (Frequent, Longitudinal) | High | Very Low |
| Patient Compliance | Moderate | High | High | Low |
| Pre-Analytical Complexity | High (Centrifugation, clotting) | Low (Simple collection) | Moderate | Very High |
| Primary Analytic Classes | Proteins, electrolytes, cells, drugs | Proteins, metabolites, exosomes, drugs | Hormones, drugs, microbes | Histology, genomics, localized proteins |
Table 2: Common Urinary Biomarkers and Their Research/Clinical Relevance
| Biomarker Category | Example Analytes | Associated Research/Therapeutic Area | Typical ELISA Role |
|---|---|---|---|
| Kidney Injury | NGAL, KIM-1, Cystatin C | Nephrotoxicity in drug development, AKI diagnosis | Quantification of low-abundance proteins |
| Inflammation | Cytokines (IL-6, IL-8, MCP-1), MMP-9 | Urological cancers, autoimmune diseases, UTIs | Multiplex or single-plex cytokine profiling |
| Oncology | PCA3, BLCA-4, Survivin | Bladder, prostate cancer detection and monitoring | Detection of tumor-associated antigens |
| Metabolic/Bone | Cortisol, Osteopontin, Collagen fragments | Endocrinology, osteoporosis research | Hormone and bone turnover marker assessment |
Detailed Protocol: ELISA for Urinary Cytokine (e.g., IL-8) Quantification with Creatinine Normalization
I. Pre-Collection & Collection
- Obtain informed consent and institutional ethics approval.
- Provide participant with a sterile, leak-proof polypropylene collection container.
- Collect a spot mid-stream urine sample (10-50 mL) to minimize genital tract contaminants.
- Record collection time and any relevant clinical metadata.
II. Immediate Processing & Storage
- Within 2 hours of collection, centrifuge the urine at 2,000 x g for 10 minutes at 4°C to remove cells and debris.
- Aliquot the clear supernatant into cryovials. Avoid repeated freeze-thaw cycles.
- Store aliquots at -80°C for long-term preservation. Analyze samples in a single batch where possible.
III. Creatinine Assay (for Normalization)
- Thaw a sample aliquot on ice or at 4°C.
- Perform a colorimetric creatinine assay (e.g., Jaffe or enzymatic method) according to manufacturer's protocol.
- Calculate creatinine concentration (mg/dL) for each sample.
IV. ELISA Protocol for Target Cytokine Materials: Commercial human IL-8 ELISA kit, microplate reader, pipettes, wash buffer, TMB substrate, stop solution.
- Sample Prep: Dilute urine samples 1:2 or 1:4 in the kit's provided sample diluent to reduce matrix interference. Determine optimal dilution factor empirically.
- Assay Setup: Add 100 µL of standards, controls, and diluted samples to appropriate wells of the pre-coated microplate. Incubate 2 hours at room temperature (RT) with gentle shaking.
- Washing: Aspirate and wash wells 4 times with 300 µL wash buffer. Blot plate on absorbent paper.
- Detection Antibody: Add 100 µL of biotinylated detection antibody. Incubate 1 hour at RT.
- Washing: Repeat wash step as in #3.
- Enzyme Conjugate: Add 100 µL of HRP-Streptavidin conjugate. Incubate 30 minutes at RT, protected from light.
- Washing: Repeat wash step as in #3.
- Substrate Reaction: Add 100 µL of TMB substrate. Incubate for 15-20 minutes at RT in the dark until color develops.
- Stop Reaction: Add 100 µL of stop solution. The blue color will turn yellow.
- Read Plate: Measure absorbance at 450 nm (reference 570 nm or 620 nm) within 30 minutes.
V. Data Analysis
- Generate a standard curve from the known standards using a 4- or 5-parameter logistic fit.
- Interpolate the sample absorbance values to determine the raw cytokine concentration (pg/mL) in the diluted urine.
- Normalization: Calculate the normalized cytokine concentration: (Raw Cytokine [pg/mL]) / (Urine Creatinine [mg/dL]) = pg/mg creatinine.
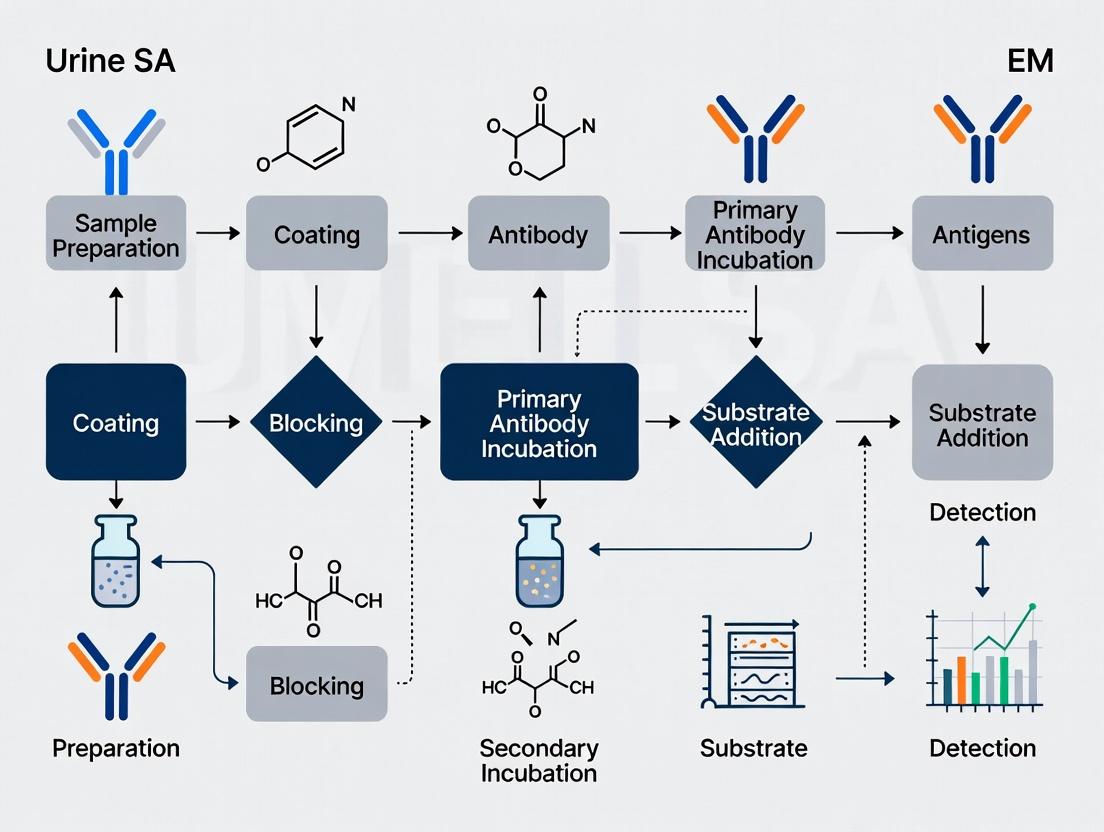
Title: Urine ELISA Workflow with Creatinine Normalization
Title: Logical Framework of Urine as a Research Matrix
The Scientist's Toolkit: Key Reagent Solutions for Urine ELISA Research
Table 3: Essential Materials and Reagents
| Item | Function & Importance in Urine ELISA |
|---|---|
| Protease Inhibitor Cocktails | Added immediately post-collection to prevent proteolytic degradation of target protein analytes, preserving epitope integrity. |
| Sterile Polypropylene Collection Tubes | Prevents adhesion of proteins to container walls and avoids leaching of chemicals that could interfere with assays. |
| Creatinine Assay Kit (Enzymatic) | For accurate normalization of analyte concentration to account for urine dilution, crucial for inter-sample comparison. |
| ELISA Kit Validated for Urine | Kits with matrix validation demonstrate measured recovery and linearity in urine, reducing initial optimization burden. |
| Assay Diluent with Blocking Agents | Specific diluents designed to mitigate urine matrix effects (e.g., high salt, urea) reduce background and improve sensitivity. |
| Recombinant Protein Standards | Quantification standards matching the endogenous analyte are essential for generating a reliable standard curve. |
| High-Binding 96-Well Microplates | For in-house ELISA development, these plates ensure efficient and consistent capture antibody immobilization. |
| HRP-Conjugated Detection Antibodies | Provide the enzymatic signal generation in sandwich ELISA; choice of conjugate is key to assay sensitivity. |
| Low-Autofluorescence Substrate (e.g., SuperSignal) | Enhances signal-to-noise ratio, important for detecting low-abundance analytes in a complex matrix like urine. |
| Urine Biomarker QC Pools | Charitably derived or synthetic control samples with known analyte ranges for inter-assay precision monitoring. |
Within the broader thesis on ELISA protocol development for urine samples, addressing the inherent challenges of this biofluid is paramount. Urine ELISA offers non-invasive advantages for clinical diagnostics, toxicology, and drug development but is confounded by its variable composition, the presence of interfering substances, and analyte instability. This document details these challenges and provides application notes and protocols to mitigate them, ensuring reliable, reproducible results.
Core Challenges and Mitigation Strategies
Variable Composition
Urine composition varies significantly due to hydration, diet, medication, and circadian rhythms, affecting analyte concentration and matrix effects.
Table 1: Sources and Impact of Urine Variability
| Variability Factor | Primary Impact on ELISA | Typical Quantitative Range of Impact |
|---|---|---|
| Urine Flow Rate | Analyte concentration (dilution) | Creatinine concentration: 0.3 - 3.0 g/L |
| pH | Antigen-antibody binding, conjugate activity | Normal range: 4.5 - 8.0 |
| Specific Gravity | Matrix density/ionic strength | Normal range: 1.002 - 1.030 |
| Diurnal Variation | Analyte concentration timing | Cortisol levels can vary by 100% |
Protocol: Normalization to Creatinine
- Purpose: Correct for urine dilution variability.
- Materials: Creatinine assay kit (Jaffé or enzymatic), microplate reader.
- Procedure:
- Perform target analyte ELISA and creatinine assay on the same urine aliquot.
- Calculate creatinine concentration using a standard curve.
- Normalize the target analyte concentration (e.g., ng/mL) using the formula:
(Analyte Concentration) / (Creatinine Concentration)= ng/mg creatinine.
Interfering Substances
Endogenous and exogenous substances can cause false positives or negatives.
Table 2: Common Urine Interferents in ELISA
| Interferent Class | Example Compounds | Mechanism of Interference |
|---|---|---|
| Endogenous | Urea, Uric Acid, Proteins (e.g., BSA), Hormones | Non-specific binding, high background, cross-reactivity |
| Exogenous | Drugs (e.g., NSAIDs, Antibiotics), Vitamin C, Dietary Metabolites | Cross-reactivity with antibodies, chemical degradation of reagents |
| Particulates | Cells, Casts, Crystals | Physical obstruction, non-specific binding |
Protocol: Sample Pre-Treatment for Interference Removal
- Purpose: Reduce interferents prior to ELISA.
- Materials: 10kDa molecular weight cut-off (MWCO) centrifugal filters, lipid removal agents (e.g., LipidURE), dilution buffer (PBS, pH 7.4).
- Procedure:
- Clarification: Centrifuge fresh urine at 10,000 x g for 10 minutes at 4°C. Use supernatant.
- Dilution: Dilute sample 1:5 or higher in assay buffer to reduce ionic strength and urea concentration.
- Filtration (Analyte-dependent): For low-MW analytes (<10kDa), use a 0.22µm filter. For protein analytes, use 10kDa MWCO filters to remove urea/salts (follow manufacturer's spin protocol).
- Lipid Removal (if needed): Incubate with lipid removal agent per manufacturer's instructions, then centrifuge.
Analyte Stability
Many target analytes (e.g., cytokines, phosphorylated proteins) degrade rapidly in urine.
Table 3: Analyte Stability Under Different Conditions
| Analyte Class | Room Temp (25°C) | 4°C | -20°C | -80°C | Recommended Stabilizer |
|---|---|---|---|---|---|
| Cytokines (e.g., IL-6) | <24 hrs | 7 days | 30 days | >1 year | 0.1% BSA, Protease Inhibitor Cocktail |
| Phosphoproteins | <2 hrs | 12 hrs | 7 days | 90 days | Phosphatase Inhibitor Cocktail |
| Small Molecules (e.g., drugs) | 7 days | 30 days | 1 year | >1 year | Adjust pH to 5.0-6.0 |
Protocol: Urine Collection and Stabilization for Labile Analytes
- Purpose: Preserve analyte integrity from collection to analysis.
- Materials: Sterile collection cups, protease/phosphatase inhibitor cocktail (100X), 0.22µm syringe filters, pH strips, cryovials.
- Procedure:
- Collect mid-stream urine into a pre-chilled cup.
- Immediately add 1% (v/v) of 100X inhibitor cocktail.
- Measure pH; adjust to optimal range (typically 7.0-7.4 for most ELISAs) using 1M NaOH or HCl if necessary.
- Aliquot, freeze in cryovials at -80°C within 2 hours of collection.
- Thaw on ice for analysis; avoid freeze-thaw cycles (>2).
Integrated Workflow for Robust Urine ELISA
Diagram Title: Urine ELISA Quality Control Workflow
The Scientist's Toolkit: Key Research Reagent Solutions
Table 4: Essential Materials for Urine ELISA Protocols
| Item | Function | Example/Supplier |
|---|---|---|
| Protease Inhibitor Cocktail (EDTA-free) | Inhibits urinary proteases to preserve protein/peptide analytes. | Roche cOmplete, Sigma-Aldrich |
| Phosphatase Inhibitor Cocktail | Preserves phosphorylation state of target proteins. | PhosSTOP (Roche) |
| BSA (IgG-Free, Protease-Free) | Blocks non-specific binding in ELISA and stabilizes dilute analytes. | Jackson ImmunoResearch |
| Creatinine Assay Kit (Enzymatic) | Accurately measures creatinine for sample normalization. | Cayman Chemical, Abcam |
| MWCO Centrifugal Filters (10kDa) | Removes low-MW interferents (urea, salts) while retaining protein analytes. | Amicon Ultra (Merck Millipore) |
| Lipid Removal Agent | Binds and precipitates lipids reducing matrix turbidity and NSB. | LipidURE (Bovine Serum) |
| Stable-Light or Similar Chemiluminescent Substrate | Provides high sensitivity for detecting low-abundance analytes in dilute urine. | PerkinElmer |
| Validated ELISA Kit for Urine/Sera | Kit optimized for complex matrices; includes urine-specific protocol notes. | R&D Systems DuoSet, Abcam |
Detailed Experimental Protocol: Validating a Urine ELISA Assay
Title: Protocol for ELISA Validation in Urine Matrix: Precision, Recovery, and Parallelism.
Objectives: Determine intra- and inter-assay precision, analyte recovery after spiking, and demonstrate dilution linearity (parallelism).
Materials:
- Pooled, clarified, and characterized human urine (normal).
- Target analyte ELISA kit.
- Purified native or recombinant target analyte standard.
- Low-bind microplates and pipettes.
Procedure: Part A: Precision
- Prepare three pools of urine (low, mid, high analyte concentration) by spiking.
- Assay each pool 8 times on the same plate (intra-assay).
- Assay each pool in duplicate over 5 separate days (inter-assay).
- Calculate CV%:
(Standard Deviation / Mean) x 100. Accept if CV <15%.
Part B: Spike/Recovery
- Prepare a known concentration of pure analyte (spike) in assay diluent.
- Add spike to the urine matrix at low, mid, and high levels within the assay range.
- Also add spike to assay diluent (no matrix) as a control.
- Run ELISA. Calculate % Recovery:
(Measured [ ] in spiked urine - Measured [ ] in native urine) / Theoretical Spike [ ] x 100. Target: 85-115%.
Part C: Parallelism (Dilution Linearity)
- Select a high-concentration native urine sample.
- Serially dilute it (e.g., 1:2, 1:4, 1:8) using the assay's recommended diluent.
- Run ELISA on all dilutions.
- Plot measured concentration vs. dilution factor. The curve should be linear, demonstrating consistent immunoreactivity across dilutions.
The quantification of biomarkers in urine via ELISA presents unique challenges and opportunities for non-invasive diagnostics and therapeutic monitoring within drug development. This application note, framed within a broader thesis on optimizing ELISA protocols for urine matrices, details the measurement of key biomarker classes: cytokines (inflammatory mediators), specific kidney injury molecules (KIM-1, NGAL), hormones (cortisol, prostaglandins), and novel drug targets (e.g., soluble receptors). Urine offers a complex, variable matrix requiring standardized pre-analytical handling to ensure assay validity.
Table 1: Common Urinary Biomarkers: Classes, Representative Analytes, and Typical Concentration Ranges
| Biomarker Class | Representative Analytes | Typical Basal Concentration Range in Healthy Urine | Pathophysiological/Induced Range | Key Clinical/Drug Development Context |
|---|---|---|---|---|
| Cytokines/Chemokines | IL-6, IL-8, TNF-α, MCP-1 | Very low (pg/mg creatinine): IL-8: 5-25 pg/mg cr | Can increase 10-100 fold (e.g., MCP-1: >500 pg/mg cr) | Monitoring systemic/renal inflammation, response to anti-inflammatory therapies. |
| Kidney Injury Molecules | KIM-1, NGAL | KIM-1: <1.5 ng/mg cr; NGAL: <25 ng/mg cr | KIM-1: >2.7 ng/mg cr; NGAL: >150 ng/mg cr (acute injury) | Gold-standard for detecting acute kidney injury (AKI) in preclinical/clinical trials. |
| Hormones | Cortisol, Prostaglandin E2 (PGE2) | Cortisol: 10-100 μg/g cr; PGE2: 100-500 pg/mg cr | Varies widely with stress, disease, and drug modulation. | Assessing HPA axis function, renal eicosanoid production; target engagement for hormone modulators. |
| Soluble Drug Targets | sVEGFR2, sIL-6R | Analyte-specific (e.g., sVEGFR2: detectable ng/mL) | Changes from baseline indicate target engagement or shedding. | Pharmacodynamic readouts for drugs targeting membrane receptors (e.g., TKIs, biologics). |
Experimental Protocols
Protocol 1: Standardized Urine Sample Collection and Pre-Processing for ELISA
Objective: To ensure consistent, artifact-free urine samples for biomarker quantification.
- Collection: Collect mid-stream urine into sterile containers. For timed collections (e.g., 24h), maintain at 4°C during collection.
- Preservation: Add protease inhibitor cocktail immediately upon collection (e.g., 10 μL per mL urine).
- Processing: Centrifuge at 1,000-2,000 x g for 10 min at 4°C to remove cells and debris.
- Aliquoting & Storage: Aliquot supernatant into low-protein-binding tubes. Store at -80°C. Avoid freeze-thaw cycles (>2 cycles significantly degrades many cytokines).
- Normalization: Measure creatinine concentration for all samples using a validated assay (e.g., Jaffe method). Report biomarker levels as normalized to urine creatinine (e.g., pg/mg cr) to correct for dilution variance.
Protocol 2: Modified Sandwich ELISA for Urine Cytokines (e.g., IL-8)
Objective: To accurately quantify low-abundance cytokines in a interfering substance-rich matrix.
- Reagent Preparation: Bring all reagents and samples to room temperature. Dilute samples 1:2 or 1:5 in the provided assay diluent (often contains blockers for urine matrix effects).
- Plate Setup: Add 100 μL of standards (reconstituted in artificial urine or diluent) and pre-diluted samples to appropriate wells of the pre-coated antibody plate. Include blank (diluent only). Incubate 2 hrs at RT on a plate shaker.
- Wash: Aspirate and wash wells 4x with 300 μL wash buffer (automated or manual).
- Detection Antibody: Add 100 μL of biotinylated detection antibody. Incubate 1-2 hrs at RT.
- Wash: Repeat wash step 4x.
- Streptavidin-Enzyme Conjugate: Add 100 μL of Streptavidin-HRP. Incubate 30 min at RT, protected from light.
- Wash: Repeat wash step 4x.
- Substrate & Stop: Add 100 μL TMB substrate. Incubate 15-20 min for color development. Stop reaction with 50 μL stop solution (e.g., 1M H2SO4).
- Reading & Analysis: Read absorbance at 450 nm (correction 570 nm) within 30 min. Generate a 4- or 5-parameter logistic standard curve. Multiply sample concentrations by dilution factor and normalize to creatinine.
Visualization: Pathways and Workflows
Title: Urine Biomarker ELISA Analysis Workflow
Title: Kidney Injury Molecule Release Pathway
The Scientist's Toolkit: Key Research Reagent Solutions
Table 2: Essential Materials for Urine Biomarker ELISA Studies
| Item | Function & Rationale |
|---|---|
| Urine Collection Tubes (Sterile, with Protease Inhibitors) | Standardizes collection, immediately inhibits protein degradation, improving biomarker stability. |
| Low-Protein-Binding Microtubes (e.g., polypropylene) | Prevents adsorption of low-concentration biomarkers to tube walls during storage and aliquoting. |
| Artificial Urine / Assay-Specific Diluent | Provides a matrix-matched standard diluent, improving standard curve accuracy and parallelism. |
| High-Sensitivity Sandwich ELISA Kits (Validated for Urine) | Kits with antibodies selected for minimal cross-reactivity and optimized to overcome urine matrix interference. |
| Creatinine Assay Kit (Jaffe or Enzymatic) | Essential for normalizing analyte concentration to account for urine output variability. |
| Microplate Washer & Reader | Ensures consistent, reproducible washing and accurate optical density measurement. |
| Data Analysis Software (4/5-PL Curve Fitting) | Correctly models the non-linear ELISA standard curve for accurate concentration interpolation. |
Within the broader context of developing robust ELISA protocols for biofluid analysis, urine presents a unique matrix that necessitates significant adaptation from standard serum or plasma protocols. Its variable composition, lower analyte concentration, and presence of interfering substances mandate a tailored approach to ensure assay sensitivity, specificity, and reproducibility for research and drug development applications.
Key Challenges & Required Adaptations
Standard ELISA protocols fail in urine due to matrix effects. The table below summarizes the core challenges and requisite adaptations.
Table 1: Urine-Specific Challenges and Protocol Adaptations
| Challenge | Impact on ELISA | Required Protocol Adaptation |
|---|---|---|
| Variable Osmolarity & pH | Alters antibody-antigen binding kinetics; denatures proteins. | Mandatory pre-assay normalization: Adjust all samples to a consistent pH (7.2-7.4) and osmolarity using a concentrated neutralization buffer. |
| Low Total Protein & Analyte Concentration | Increases risk of signal falling below the assay's limit of detection (LoD). | Sample Concentration: Use centrifugal filters (e.g., 10kDa cutoff). Increased Sample Volume: Double or triple the standard volume per well (e.g., 100µL → 200µL). |
| High Levels of Urea & Other Interferents | Causes non-specific binding and high background noise. | Enhanced Blocking: Use protein-based blockers (e.g., 5% BSA, 10% non-fat dry milk) with 0.1% Tween-20. Sample Dilution: Use a heterophilic blocking reagent or a proprietary urine diluent/assay buffer. |
| Presence of Proteases & Bacteria | Degrades target analytes and capture/detection antibodies. | Addition of Inhibitors: Include broad-spectrum protease inhibitors and antimicrobial agents (e.g., sodium azide) in collection and assay buffers. |
| Lack of Universal Reference | Difficult to perform spike-and-recovery for validation. | Use of Synthetic Urine: For standard curve generation and validation, use a synthetic urine matrix matched for salts, urea, and creatinine. |
Detailed Experimental Protocols
Protocol 1: Urine Sample Pre-Processing for Cytokine Detection
Objective: To prepare human urine samples for the quantification of low-abundance cytokines (e.g., IL-6, TNF-α).
- Collection: Collect mid-stream urine in sterile containers with 0.1% (v/v) protease inhibitor cocktail. Centrifuge at 2,000 x g for 10 min at 4°C to remove cells and debris. Aliquot and store at -80°C.
- pH/Osmolarity Adjustment: Thaw samples on ice. Add 1/10 volume of 10X Neutralization Buffer (1M HEPES, 1.5M NaCl, pH 7.4). Vortex gently.
- Concentration: Transfer up to 4mL of adjusted urine to a 10kDa molecular weight cut-off centrifugal filter. Concentrate at 4,000 x g at 4°C to a final volume of 200-400µL. Recover the retentate.
- Dilution: Dilute the concentrated sample 1:2 in the ELISA's specified diluent supplemented with 1% BSA and 0.05% Tween-20.
Protocol 2: Validation via Spike-and-Recovery in Urine Matrix
Objective: To validate assay accuracy by determining the percentage recovery of a known amount of analyte spiked into urine.
- Prepare a pool of analyte-negative urine (from healthy donors) and process as in Protocol 1.
- Spike the processed urine pool with a known concentration of recombinant analyte standard (at low, mid, and high points of the standard curve).
- Run the spiked samples alongside an unspiked pool and the standard curve (diluted in synthetic urine matrix) in the same ELISA plate.
- Calculate % Recovery:
(Measured concentration in spiked sample – Measured concentration in unspiked sample) / Known spiked concentration * 100. Acceptable recovery is typically 80-120%.
Visualization: Experimental Workflow & Validation Logic
Title: Urine Sample Pre-Processing Workflow for ELISA
Title: Spike-and-Recovery Validation Logic for Urine ELISA
The Scientist's Toolkit: Key Research Reagent Solutions
Table 2: Essential Materials for Urine-Adapted ELISA
| Item | Function & Rationale |
|---|---|
| Synthetic Urine Matrix | A standardized, analyte-free solution mimicking urine composition. Critical for generating accurate standard curves and as a dilution matrix. |
| HEPES-based Neutralization Buffer (10X) | Buffers samples to a consistent physiological pH (7.4), stabilizing protein interactions and optimizing antibody binding. |
| Protease Inhibitor Cocktail (Broad Spectrum) | Prevents proteolytic degradation of both the target analyte and assay antibodies during sample collection and storage. |
| Centrifugal Filter Units (e.g., 10kDa MWCO) | Concentrates low-abundance analytes to levels within the dynamic range of standard ELISA kits. |
| Heterophilic Blocking Reagent (HBR) | Binds interfering human antibodies (e.g., rheumatoid factors) to reduce false-positive signals. |
| BSA (Bovine Serum Albumin), Ultra-Pure | A superior blocking agent for urine ELISAs, reducing non-specific binding more effectively than standard blockers. |
| Urine Collection Tubes with Preservatives | Tubes pre-filled with stabilizers (e.g., boric acid, protease inhibitors) ensure sample integrity from point of collection. |
The integrity of any ELISA-based biomarker study on urine samples is fundamentally dependent on rigorous pre-analytical protocols and adherence to ethical and regulatory standards. This document provides essential Application Notes and Protocols, framed within a broader thesis on urine ELISA development, to ensure the generation of valid, reproducible, and ethically sound data for research and drug development.
Ethical and Regulatory Framework
Prior to any sample collection, researchers must navigate a complex ethical and regulatory landscape. Key considerations are summarized in Table 1.
Table 1: Key Ethical and Regulatory Requirements for Urine Biomarker Research
| Requirement | Description | Key Considerations for Urine ELISA Studies |
|---|---|---|
| Informed Consent | Participants must be fully informed of the study's purpose, procedures, risks, and benefits. | Consent must cover specific use of urine for biomarker discovery, potential for future genetic analysis, and data sharing plans. |
| IRB/EC Approval | Institutional Review Board or Ethics Committee approval is mandatory. | Protocol must detail urine collection, storage, anonymization procedures, and measures to protect participant privacy. |
| GDPR/HIPAA Compliance | Compliance with data protection regulations (e.g., General Data Protection Regulation, Health Insurance Portability and Accountability Act). | Pseudonymization of samples and data; secure storage of the key linking code to identity; defined data retention periods. |
| Bioresource Governance | Ethical stewardship of human biological samples. | Clear documentation of ownership, permitted uses, and conditions for transfer to collaborating laboratories or biobanks. |
Pre-Analytical Variables: Impact on Urine ELISA
Pre-analytical factors significantly influence analyte stability and ELISA outcomes. Standardized protocols are critical to minimize variability.
Table 2: Critical Pre-Analytical Variables and Their Impact on Urine ELISA
| Variable | Potential Impact on Urine Analyte | Recommended Control Protocol |
|---|---|---|
| Collection Time | Diurnal variation in hormone (e.g., cortisol), protein, and metabolite concentrations. | Standardize to first-morning void (for concentrated analysis) or 24-hour collection (for total output). Document time precisely. |
| Collection Container | Adsorption of proteins to container walls; chemical contamination. | Use sterile, non-cytotoxic, low-protein-binding polypropylene containers. Avoid preservatives unless validated. |
| Preservative/Additive | May stabilize some analytes but interfere with ELISA detection. | For general protein/cytokine ELISA, no additive is often best. For peptides, protease inhibitors may be needed. Must be validated. |
| Processing Delay & Temperature | Bacterial growth, proteolysis, and precipitation can alter analyte levels. | Process within 2 hours at 4°C. If not possible, aliquot and freeze at -80°C immediately after collection. |
| Centrifugation | Presence of cells and debris can interfere with assay and cause variability. | Centrifuge at 2000-3000 x g for 10-20 minutes at 4°C. Carefully collect the supernatant without disturbing the pellet. |
| Aliquoting & Freeze-Thaw | Improper aliquoting leads to repeated freeze-thaw cycles, degrading proteins. | Aliquot into single-use volumes prior to initial freezing. Avoid more than 2-3 freeze-thaw cycles. Store at ≤ -80°C. |
Detailed Experimental Protocols
Protocol 4.1: Standardized Urine Collection and Processing for ELISA
Objective: To obtain cell-free urine supernatant suitable for biomarker analysis via ELISA. Materials: See "The Scientist's Toolkit" (Section 6). Procedure:
- Consent & Labeling: Obtain informed consent. Label a pre-chilled, sterile 50mL conical polypropylene tube with a unique study ID and collection time.
- Collection: Collect a mid-stream urine sample (minimum 10mL) directly into the tube.
- Initial Handling: Place the sample immediately on wet ice or at 4°C.
- Processing (Within 2 hours): a. Measure and record total volume. b. Centrifuge at 2,500 x g for 15 minutes at 4°C. c. Carefully decant the supernatant into a new, labeled tube, avoiding the pellet. d. Aliquot the supernatant into 0.5mL or 1.0mL cryovials (single-experiment volumes).
- Storage: Place aliquots directly at -80°C for long-term storage. Do not use a -20°C freezer for long-term storage of urine proteins.
Protocol 4.2: Assessment of Sample Hemolysis and Contamination
Objective: To qualify urine samples prior to costly ELISA analysis. Materials: Spectrophotometer or plate reader, phosphate-buffered saline (PBS). Procedure:
- Thaw a single aliquot of each sample on ice or at 4°C.
- Clarify by brief centrifugation (10,000 x g, 5 min, 4°C) if any precipitate is visible.
- Dilute urine sample 1:5 in PBS.
- Measure absorbance at 415 nm (hemoglobin), 540 nm (other blood derivatives), and 280 nm (total protein reference).
- Interpretation: An absorbance at 415 nm >0.2 (for the diluted sample) suggests significant hemolysis, which may interfere with certain ELISAs. The sample should be flagged or excluded.
Workflow and Data Integrity Visualization
Title: Urine ELISA Pre-Analytical and Ethical Workflow
Title: Pre-Analytical Variable Impact Pathway
The Scientist's Toolkit: Research Reagent Solutions
Table 3: Essential Materials for Urine Collection and Processing for ELISA
| Item | Function & Rationale |
|---|---|
| Sterile Polypropylene Conical Tubes (50mL) | Primary collection vessel. Polypropylene minimizes protein adsorption. Sterile to prevent bacterial overgrowth during short-term holding. |
| Protease Inhibitor Cocktail (e.g., tablets) | Added immediately after collection to prevent degradation of protein biomarkers by endogenous urinary proteases. Critical for peptide analytes. |
| Low-Protein-Binding Microcentrifuge Tubes & Cryovials | For aliquoting supernatant. Prevents loss of low-abundance proteins to tube walls. |
| Refrigerated Centrifuge | Maintains samples at 4°C during processing to slow down enzymatic and chemical degradation. |
| Permanent Cryogenic Labels & Frost-Free Ink | Ensures sample identification remains legible after long-term storage at -80°C and exposure to liquid nitrogen vapor. |
| Portable Cooler with Wet Ice | Maintains recommended 4°C temperature chain from point of collection to the laboratory processing site. |
| Standardized Urine Creatinine Assay Kit | For normalization of analyte concentration. Corrects for variations in urine dilution/ concentration, a critical step for spot urine samples. |
| pH Indicator Strips | Rapid assessment of urine pH. Extreme pH (<5 or >8) can affect analyte stability and ELISA antibody binding, indicating need for buffering. |
Step-by-Step ELISA Protocol for Urine: From Sample Prep to Plate Reading
In the context of broader ELISA-based biomarker research, the pre-analytical phase is the most critical yet vulnerable component. Standardizing urine collection, preservation, and storage is paramount for generating reliable, reproducible data. Variations in pre-analytical handling significantly impact analyte stability, directly confounding ELISA results for cytokines, kidney injury markers, and other proteins. This document provides detailed application notes and protocols to mitigate these variables.
Urine Collection Standardized Protocol
Patient Preparation & Collection
- Instructions: Provide subjects with written instructions for a first-morning, mid-stream clean-catch collection.
- Container: Use sterile, polypropylene, additive-free containers. Note lot number.
- Timing: Record exact time of collection. Process within 2 hours if unpreserved.
- Volume: Document total volume. Aliquot for analysis prior to any centrifugation or preservation steps.
Initial Processing
- Mixing: Gently invert the container 5-10 times to ensure homogeneity.
- Centrifugation: For cell-free supernatant, centrifuge at 400 x g for 10 minutes at 4°C. For some analyses, 2,000 x g may be required—standardize across study.
- Aliquoting: Immediately aliquot supernatant into pre-labeled, low-protein-binding cryovials. Avoid multiple freeze-thaw cycles by creating single-use aliquots (recommended: 0.5-1.0 mL).
Preservation & Storage Comparative Analysis
The choice of storage temperature is analyte-dependent. The following table summarizes key quantitative data from recent studies on the stability of common urine biomarkers under different storage conditions.
Table 1: Analyte Stability in Urine at Different Storage Temperatures
| Analyte Class | Example Biomarkers | Recommended Preservation | Stability at -20°C | Stability at -80°C | Key Degradation Notes |
|---|---|---|---|---|---|
| Cytokines/Chemokines | IL-6, IL-8, MCP-1 | None, or protease inhibitors | 1-3 months (variable) | >24 months | Susceptible to proteolysis; rapid loss at 4°C. |
| Kidney Injury Molecules | NGAL, KIM-1, Cystatin C | None typically required | 6-12 months | >36 months | Generally stable; avoid repeated thawing. |
| Extracellular Vesicles | CD63, miRNAs | Protease/RNase inhibitors, no freeze-thaw | Days to weeks | >12 months | Vesicle integrity and cargo degrade rapidly at -20°C. |
| Metabolites | Citrate, Succinate | Immediate freezing, bacteriostatic (e.g., sodium azide) | 1-6 months | >24 months | Bacterial overgrowth alters profile at 4°C. |
| Proteins (General) | Albumin, Total Protein | None or broad-spectrum protease inhibitor cocktail | 3-6 months | >24 months | Aggregation and fragmentation increase over time at -20°C. |
Protocol: Experiment to Determine Optimal Storage Temperature for a Novel Biomarker
- Sample Pooling: Pool fresh, well-mixed urine samples from healthy donors (ensure IRB approval). Centrifuge at 400 x g, 10 min, 4°C.
- Baseline Aliquot: Immediately aliquot and analyze one set of samples (Time=0).
- Preservation & Storage: Aliquot remaining supernatant into four sets:
- Set A: Store at 4°C. Analyze at 6, 24, 48, 72 hours.
- Set B: Store at -20°C. Analyze at 1, 2, 4, 12, 24 weeks.
- Set C: Store at -80°C. Analyze at 1, 2, 4, 12, 24, 52 weeks.
- Set D: Add 0.1% v/v protease inhibitor cocktail (PIC), then store at -80°C. Analyze same as Set C.
- Analysis: Perform ELISA in duplicate for the target analyte. Normalize values to creatinine.
- Stability Criterion: Define stability as <15% deviation from the Time=0 mean concentration.
Workflow and Decision Pathway
Title: Urine Pre-Analytical Workflow for ELISA
The Scientist's Toolkit: Key Research Reagent Solutions
Table 2: Essential Materials for Standardized Urine Processing
| Item | Function & Rationale | Example/Note |
|---|---|---|
| Sterile Polypropylene Containers | Initial collection; inert, low protein binding, leak-proof. | Sarstedt 75.9922.XXX |
| Low-Protein-Binding Cryovials | Prevents analyte adsorption during storage. | Thermo Scientific Nunc 2.0 mL Internal Thread |
| Protease Inhibitor Cocktail (PIC) | Broad-spectrum inhibition of serine, cysteine, metalloproteases to preserve protein integrity. | Roche cOmplete Mini EDTA-free |
| RNase Inhibitor | Essential for preserving RNA in urine EVs for downstream miRNA analysis in biomarker studies. | Protector RNase Inhibitor |
| Sodium Azide | Bacteriostatic agent (0.1%) to prevent microbial growth altering metabolites. | CAUTION: Toxic; handle with PPE. |
| Urine Creatinine Assay Kit | For normalization of analyte concentration to correct for hydration status. | Jaffe or enzymatic, ELISA-compatible. |
| Precision Pipettes & Sterile Tips | Accurate and consistent aliquotting to minimize volumetric error and cross-contamination. | Calibrate regularly. |
| Benchtop Centrifuge (Refrigerated) | For gentle cell removal at 4°C to slow degradation during processing. | Must accommodate standard collection tubes. |
| -80°C Ultra-Low Freezer | Gold-standard long-term storage; ensures maximal stability for most labile biomarkers. | Monitor with continuous temperature loggers. |
| Cryobox Storage System | Organized, traceable sample archiving in freezer. | Use barcoded, color-coded systems. |
1. Introduction
Within the broader thesis "Optimization of ELISA Protocols for Novel Biomarker Detection in Human Urine," effective sample preparation is paramount. Urine is a complex matrix containing salts, urea, organic acids, and particulate matter that can cause significant matrix effects, leading to inaccurate quantification in immunoassays. This application note details a standardized pre-analytical workflow encompassing centrifugation, systematic dilution, and the strategic use of assay buffer to mitigate these interferences, ensuring reliable and reproducible ELISA results.
2. Key Research Reagent Solutions
Table 1: Essential Materials and Reagents
| Item | Function in Urine ELISA Prep |
|---|---|
| Polypropylene Collection Tubes | Inert material prevents analyte adsorption. |
| Refrigerated Microcentrifuge | Maintains sample integrity during pelleting of particulates. |
| Low-Protein-Binding Pipette Tips | Minimizes loss of low-abundance target analytes. |
| Assay-Specific ELISA Diluent Buffer | Matches assay matrix; contains proteins (e.g., BSA) to block non-specific binding and stabilize pH/ionic strength. |
| Universal ELISA Sample Diluent | Used for serial dilution studies; typically a neutral pH buffer with carrier protein. |
| Protease Inhibitor Cocktail (optional) | Added immediately after collection if target is protease-sensitive. |
3. Protocols and Methodologies
3.1. Protocol A: Standardized Urine Clarification by Centrifugation
- Purpose: To remove cells, debris, and insoluble salts that cause light scattering or non-specific binding.
- Procedure:
- Mix freshly thawed urine samples thoroughly by vortexing for 10 seconds.
- Aliquot 1 mL into a labeled, low-binding microcentrifuge tube.
- Centrifuge at 4°C for 15 minutes at 2,000 x g.
- Carefully pipette the supernatant (~900 µL) into a new, labeled low-binding tube, avoiding the pellet.
- Use clarified supernatant immediately for assay or dilution.
3.2. Protocol B: Determination of Optimal Minimum Required Dilution (MRD)
- Purpose: To identify the dilution factor that minimizes matrix interference while maintaining analyte detectability.
- Procedure:
- Prepare a standard dilution series of a pooled urine sample (post-centrifugation) in the assay's specified diluent buffer (e.g., neat, 1:2, 1:4, 1:8, 1:16).
- In parallel, prepare the same dilution series of the analyte standard in an artificial urine matrix or the diluent alone.
- Run both sets in the same ELISA plate according to the kit protocol.
- Calculate the apparent recovery at each dilution:
(Observed Conc. in Urine / Expected Conc. in Standard) x 100%. - The MRD is the lowest dilution where recovery falls within 80-120% and parallelism is observed with the standard curve.
3.3. Protocol C: Use of Assay Buffer for Spike-and-Recovery Assessment
- Purpose: To validate the sample preparation workflow and confirm matrix effects are controlled.
- Procedure:
- Divide a clarified urine sample into three aliquots.
- Low Spike: Add a known low concentration of the pure analyte standard.
- High Spike: Add a known high concentration of the pure analyte standard.
- Unspiked: Add an equivalent volume of assay buffer.
- Process all aliquots through the finalized protocol (including the determined MRD) and the ELISA.
- Calculate percentage recovery:
[(Spiked Sample Result – Unspiked Sample Result) / Amount Added] x 100%. Acceptable recovery is typically 80-120%.
4. Data Presentation
Table 2: Example Data from MRD Determination for Urinary Biomarker X
| Dilution Factor | Observed Conc. in Urine (pg/mL) | Expected Conc. in Standard (pg/mL) | Apparent Recovery (%) | Acceptable Recovery (Y/N) |
|---|---|---|---|---|
| Neat | 450 | 250 | 180 | N |
| 1:2 | 220 | 230 | 96 | Y |
| 1:4 | 115 | 120 | 96 | Y |
| 1:8 | 58 | 60 | 97 | Y |
| 1:16 | 28 | 30 | 93 | Y |
Conclusion: A Minimum Required Dilution (MRD) of 1:2 is sufficient for this analyte/matrix combination.
Table 3: Spike-and-Recovery Validation Post-Optimization
| Sample Condition | Amount Added (pg/mL) | Measured (pg/mL) | Recovery (%) | Mean Recovery ± SD |
|---|---|---|---|---|
| Unspiked Urine | 0 | 105 | - | 96.5% ± 3.5 |
| Low Spike | 100 | 201 | 96 | |
| High Spike | 500 | 583 | 95.6 |
5. Workflow and Pathway Diagrams
Introduction Within the broader thesis investigating ELISA protocols for urine biomarker research, the initial choice between a commercial kit and an in-house (or "homebrew") assay is a pivotal decision. This application note delineates the critical considerations for this selection, focusing on the paramount parameters of sensitivity and specificity in the complex urine matrix. The quantitative comparison and detailed protocols herein are designed to guide researchers and drug development professionals in optimizing their experimental approach.
Quantitative Comparison: Commercial vs. In-House ELISA
Table 1: Comparative Analysis of Key Performance and Operational Parameters
| Parameter | Commercial ELISA Kit | In-House (Homebrew) Assay |
|---|---|---|
| Development Time | Immediate use (0-2 days for procurement) | 3-12 months for development, optimization, and validation |
| Initial Cost | Moderate to High (per kit) | Low (per plate), but high initial R&D investment |
| Long-term Cost | High for large-scale/long-term studies | Very low at scale after validation |
| Sensitivity (LoB/LoD) | Pre-defined, fixed; typically well-characterized. | Fully customizable; can be optimized for ultra-sensitive detection. |
| Specificity | Fixed; depends on vendor's antibody pair validation. | Customizable; selection of antibody pairs allows targeting of specific epitopes or variants. |
| Urine Matrix Effects | May include generic urine normalization buffers; not sample-specific. | Assay buffers can be meticulously optimized for the target analyte in urine (e.g., pH, ionic strength). |
| Standard Curve | Provided, traceable. Range may not be ideal for all urine analyte concentrations. | User-defined range, tailored to expected physiological/pathological urine levels. |
| Validation Burden | Vendor provides core performance data; user must still perform in-lab verification for their sample type. | Full validation (precision, accuracy, recovery, stability) is the user's responsibility (GLP/GCP may require it). |
| Scalability & Reproducibility | High inter-batch variability possible; lot-to-lot consistency is vendor-dependent. | High intra-lab reproducibility possible; inter-lab transfer requires rigorous standardization. |
Detailed Experimental Protocols
Protocol 1: Verification of a Commercial ELISA Kit for Urine This protocol is essential for establishing kit performance in the researcher's specific context.
- Sample Preparation: Centrifuge fresh urine at 1,000-2,000 x g for 10 min. Aliquot and freeze supernatant at -80°C if not used immediately. Avoid repeated freeze-thaw cycles.
- Dilutional Linearity & Recovery: Spike a known quantity of recombinant analyte into a pooled urine sample. Serially dilute the spiked sample and a non-spiked control with the kit's recommended sample diluent (or a characterized proxy). Calculate % recovery at each dilution.
- Parallelism Assessment: Dilute a high-concentration native urine sample with the sample diluent. The resulting dose-response curve should be parallel to the kit's standard curve, indicating similar immunoreactivity.
- Precision Profile: Analyze three urine pools (low, mid, high analyte concentration) in replicates (n≥5) within a single run (intra-assay) and across different days/operators (inter-assay). Calculate CV%.
- Sensitivity Calculation: Measure the kit's zero standard (or diluent) in at least 20 replicates. Limit of Blank (LoB) = mean(blank) + 1.645SD(blank). Limit of Detection (LoD) = LoB + 1.645SD(low-concentration sample).
Protocol 2: Development and Optimization of an In-House Sandwich ELISA for Urine This outlines the core steps for developing a custom assay.
- Antody Pair Selection: Coat plate with capture antibody (1-10 µg/mL in carbonate/bicarbonate buffer, pH 9.6) overnight at 4°C.
- Blocking Optimization: Block with 1-5% BSA, casein, or commercial protein blockers in PBS for 1-2 hours at RT. Compare background.
- Urine-Specific Matrix Optimization: Dilute urine samples and standards in buffers containing varying concentrations of salts (e.g., NaCl), detergents (e.g., Tween-20), and carrier proteins. Test different urine dilution factors (e.g., 1:2, 1:5, 1:10) to minimize matrix interference while maintaining signal.
- Detection Antibody & Conjugate Titration: Perform chessboard titrations of detection antibody and enzyme-conjugated secondary (if indirect) to find the optimal signal-to-noise ratio.
- Signal Development & Validation: Use appropriate substrate (TMB for HRP, pNPP for AP). Establish a standard curve with recombinant protein in the optimized urine-compatible diluent. Proceed with full validation as described in Protocol 1, steps 3-5.
Visualization of Workflows and Considerations
Title: Decision and Workflow for ELISA Kit Selection
Title: Urine Matrix Effects on ELISA Sensitivity & Specificity
The Scientist's Toolkit: Research Reagent Solutions
Table 2: Essential Materials for Urine ELISA Development & Execution
| Item | Function & Rationale |
|---|---|
| High-Binding ELISA Plates | Polystyrene plates with optimized surface charge for maximal antibody/antigen adsorption. |
| Capture & Detection Antibody Pair | Matched monoclonal or affinity-purified polyclonal antibodies targeting non-overlapping epitopes on the analyte. Critical for specificity. |
| Urine-Compatible Blocking Buffer | 1-5% BSA or casein in PBS-Tween, often supplemented with species-specific sera or proprietary polymers to reduce non-specific binding from urine components. |
| Analyte-Specific Standard | Highly pure, well-characterized recombinant protein for generating the standard curve. Must be compatible with the chosen urine sample diluent. |
| Urine Sample Diluent | Optimized buffer (PBS or Tris-based) containing salts, detergents, and carrier proteins to mimic urine matrix and minimize interference. |
| HRP or AP Conjugate & Substrate | Enzyme-linked detection system (e.g., HRP-Streptavidin with TMB) chosen for high signal-to-noise ratio. |
| Precision Multichannel Pipettes | Essential for ensuring reproducibility when handling samples, standards, and reagents across a 96-well plate. |
| Plate Reader with Kinetic Capability | For accurate endpoint or kinetic measurement of absorbance (e.g., 450nm for TMB, corrected at 540/570nm). |
| Data Analysis Software | For 4- or 5-parameter logistic (4PL/5PL) curve fitting of standard data and sample interpolation. |
This application note, framed within a broader thesis on ELISA protocol standardization for urine biomarker research, details optimized workflows for the four principal ELISA formats applied to urine matrices. Urine presents unique challenges, including variable solute concentration, pH, and the presence of interfering substances (e.g., urea, salts). These protocols are designed for researchers, scientists, and drug development professionals seeking robust, reproducible quantification of analytes—from small molecule drugs to proteins and antibodies—in urine for diagnostic, pharmacokinetic, and biomarker discovery applications.
Key Challenges & Pre-Analytical Considerations for Urine
- Normalization: Correct for variable dilution using creatinine concentration or specific gravity.
- Sample Stability: Add protease inhibitors immediately upon collection for protein targets. For small molecules, consider chemical stabilizers.
- Interference: Often requires sample dilution (in assay buffer) or pre-treatment (e.g., filtration, centrifugation at 10,000 x g for 10 min).
- Matrix Effects: Mandatory use of matrix-matched calibration standards prepared in pooled, analyte-free urine or an appropriate surrogate.
Research Reagent Solutions & Essential Materials
| Item | Function in Urine ELISA | Key Considerations |
|---|---|---|
| High-Binding ELISA Plates | Solid phase for antigen/antibody immobilization. | Polystyrene plates coated with protein A/G or streptavidin are alternatives for specific formats. |
| Urine-Specific Assay Buffer | Diluent for samples/conjugates. Contains blockers (BSA, casein) to reduce non-specific binding from urine components. | Typically 0.5-2% BSA in PBS-Tween. May require addition of surfactants (e.g., CHAPS) to mitigate interference. |
| Creatinine Assay Kit | For normalization of analyte concentration to urine density. | Essential for correcting spot or random urine samples. Use a standardized colorimetric or enzymatic assay. |
| Analyte-Free Urine Pool | Matrix for preparing calibration standards. | Pool urine from healthy donors, charcoal-strip if necessary, and confirm absence of target analyte. |
| Stable HRP/AP Conjugates | Enzyme-linked detection reagents. | Must be validated for low background in urine matrix. Alkaline Phosphatase (AP) can be more stable in some urine additives. |
| High-Sensitivity Chemiluminescent Substrate | Detection system for signal generation. | Offers wider dynamic range vs. colorimetric TMB, crucial for analytes with high urine variability. |
| pH-Adjustment Solutions | To standardize urine sample pH to ~7.4. | Prevents assay variability due to natural urine pH fluctuations (4.5-8.0). |
| Parameter | Direct ELISA | Indirect ELISA | Sandwich ELISA | Competitive ELISA |
|---|---|---|---|---|
| Primary Target in Urine | Antigen (with native epitope for detection antibody) | Antibodies (e.g., drug-induced, infectious) | Proteins, cytokines, biomarkers | Small molecules (drugs, hormones), haptens |
| Sensitivity (Typical) | Moderate (ng/mL) | High (pg/mL - ng/mL) | Highest (pg/mL) | Moderate to High (pg/mL - ng/mL) |
| Specificity | Lower (one antibody) | High (two antibodies) | Highest (two antibodies) | High (one antibody) |
| Key Urine Advantage | Speed, minimal steps | Amplified signal, versatile | Robust vs. matrix effects | Ideal for small analytes |
| Key Urine Disadvantage | Labeling every antibody, higher background risk | Non-specific binding from secondary | Requires two non-competing epitopes | Inverse signal relationship |
| Best for Urine: | High-abundance antigens | Serology, antibody screening | Biomarkers (e.g., NGAL, IL-18) | Therapeutic Drug Monitoring (TDM) |
Detailed Protocols
Protocol 5.1: Direct ELISA for Antigen Detection in Urine
Ideal for detecting an antigen that can be captured and detected with a single, labeled antibody.
- Coating: Dilute purified capture antibody (1-10 µg/mL) in carbonate/bicarbonate coating buffer (pH 9.6). Add 100 µL/well to plate. Incubate overnight at 4°C.
- Blocking: Aspirate. Add 200 µL/well of urine-specific blocking buffer (2% BSA, 0.05% Tween-20 in PBS). Incubate 2 hours at RT.
- Sample Incubation: Aspirate. Add 100 µL/well of urine samples (diluted in assay buffer) or matrix-matched standards. Incubate 2 hours at RT or overnight at 4°C.
- Detection: Aspirate and wash 3x with PBS-T. Add 100 µL/well of enzyme-conjugated detection antibody (direct format) in assay buffer. Incubate 1-2 hours at RT.
- Signal Development: Wash 5x. Add 100 µL chemiluminescent substrate. Incubate in dark for 5-15 min. Read plate.
Direct ELISA Workflow for Urine Antigen Detection
Protocol 5.2: Indirect ELISA for Antibody Detection in Urine
For detecting specific antibodies (e.g., anti-drug antibodies) in urine.
- Coating: Dilute target antigen (1-10 µg/mL) in coating buffer. Coat plate (100 µL/well). Incubate overnight at 4°C.
- Blocking: Block with 200 µL/well urine-specific blocking buffer for 2 hours at RT.
- Sample Incubation: Aspirate. Add 100 µL/well of urine samples (often used minimally diluted) or negative/positive controls. Incubate 2 hours at RT.
- Secondary Antibody: Wash 3x. Add 100 µL/well of enzyme-conjugated anti-species secondary antibody (e.g., anti-human IgG-HRP) diluted in assay buffer. Incubate 1 hour at RT.
- Signal Development: Wash 5x. Add substrate and read as in 5.1.
Indirect ELISA Workflow for Urine Antibody Detection
Protocol 5.3: Sandwich ELISA for Protein Biomarkers in Urine
The gold standard for sensitive, specific quantification of proteins in urine (e.g., cytokines, kidney injury markers).
- Coating: Dilute capture antibody (2-10 µg/mL) in coating buffer. Coat plate (100 µL/well). Overnight at 4°C.
- Blocking: Block with 300 µL/well of blocking buffer for 2 hours at RT.
- Sample & Standard Incubation: Aspirate. Add 100 µL/well of urine samples (must be diluted per optimization) and matrix-matched standards. Incubate 2 hours at RT or overnight at 4°C.
- Detection Antibody: Wash 3x. Add 100 µL/well of biotinylated detection antibody (0.5-2 µg/mL) in assay buffer. Incubate 1-2 hours at RT.
- Streptavidin-Enzyme Conjugate: Wash 3x. Add 100 µL/well of streptavidin-HRP/AP (diluted per manufacturer) in assay buffer. Incubate 30-45 min at RT.
- Signal Development: Wash 5x. Add substrate and read.
Sandwich ELISA Workflow for Urine Protein Biomarkers
Protocol 5.4: Competitive ELISA for Small Molecules in Urine
Used to measure concentrations of small analytes (haptens) like drugs, hormones, or toxins.
- Coating: Dilute antigen conjugate (e.g., drug-BSA conjugate) or capture antibody in coating buffer. Coat plate (100 µL/well). Overnight at 4°C.
- For the common format (competitive for antigen):
- Competitive Incubation: Simultaneously add:
- 50 µL/well of urine sample or standard (in analyte-free urine).
- 50 µL/well of constant concentration of enzyme-labeled antigen (tracer). Incubate 2 hours at RT. (Analyte in sample competes with tracer for limited antibody sites).
- Wash & Develop: Wash plate 5x thoroughly. Add 100 µL substrate. Incubate and read. Signal is inversely proportional to analyte concentration.
Competitive ELISA Workflow for Urine Small Molecules
Data Analysis & Normalization
- Standard Curve: Fit data using a 4- or 5-parameter logistic (4PL/5PL) curve. Report sample concentrations interpolated from the curve.
- Creatinine Normalization: For timed or spot urine samples, measure creatinine concentration (mg/dL) in parallel.
- Calculated Normalized Value = (Analyte Concentration) / (Creatinine Concentration)
- Report as, e.g., ng analyte/mg creatinine.
- Validation Parameters: For thesis integration, report urine-specific assay characteristics: Lower Limit of Detection (LLOD), Lower Limit of Quantification (LLOQ), intra-/inter-assay precision (%CV) in urine matrix, and spike-and-recovery rates (80-120% ideal).
In the context of a broader thesis on ELISA protocol development for urine biomarker research, accurate quantification and comparison of analyte concentrations are paramount. Urine is a biologically variable fluid, with solute concentrations heavily influenced by hydration status, renal function, and diurnal variation. To enable meaningful comparisons between individuals or across time points, measured analyte concentrations must be normalized to account for this variability. The three predominant normalization strategies involve adjusting to urine creatinine concentration, total protein content, or urine volume (timed collections). This application note details the rationales, protocols, and data interpretation for these critical post-ELISA data processing steps.
Key Normalization Strategies: Rationale and Comparison
Table 1: Comparison of Urine Normalization Methods
| Normalization Method | Primary Rationale | Best Suited For | Key Assumptions & Limitations |
|---|---|---|---|
| Creatinine | Corrects for urine dilution/ concentration. Creatinine excretion rate is relatively constant. | Spot or random urine samples. Biomarkers filtered/ secreted by kidney. | Constant creatinine excretion rate. Not valid in severe renal impairment, muscle wasting, or in very young/elderly. |
| Total Protein | Corrects for overall protein excretion load. Useful for protein-specific biomarkers. | Proteinuria studies. Conditions with glomerular or tubular damage. | Assumes biomarker co-varies with total protein. Invalid if protein excretion is the primary pathological variable. |
| Urine Volume (Timed Collection) | Direct measure of excretion rate (e.g., µg/hr). Considered the "gold standard." | Pharmacokinetics, hormone studies, metabolic research. | Requires complete, accurately timed collections. Burdensome for patients/participants. |
Experimental Protocols
Protocol 1: Creatinine Measurement (Jaffe Kinetic Method) for ELISA Normalization
Purpose: To determine urine creatinine concentration for normalization of ELISA-derived analyte values. Reagents: Creatinine standard (100 mg/dL), Picric acid (0.04M), Sodium hydroxide (0.75M). Procedure:
- Dilute urine samples 1:50 with distilled water.
- Prepare working reagent by mixing picric acid and NaOH in a 1:1 ratio.
- In a 96-well plate, add 20 µL of standard, sample, or water (blank) to respective wells.
- Add 200 µL of working reagent to each well. Mix immediately.
- Incubate at room temperature for 20-30 minutes.
- Read absorbance at 490-510 nm on a plate reader.
- Calculate creatinine concentration from the standard curve.
- Normalization: Divide the raw ELISA analyte concentration (ng/mL) by the urine creatinine concentration (mg/dL). Result expressed as ng analyte/mg creatinine.
Protocol 2: Total Protein Assay (Bradford Method) for ELISA Normalization
Purpose: To determine total urine protein concentration for normalization. Reagents: Bovine Serum Albumin (BSA) standards (0-2000 µg/mL), Coomassie Brilliant Blue G-250 dye reagent. Procedure:
- Dilute urine samples as necessary (typically 1:5 to 1:20).
- Add 10 µL of standard or sample to a microplate well.
- Add 200 µL of Bradford reagent to each well. Mix thoroughly.
- Incubate at room temperature for 10 minutes.
- Read absorbance at 595 nm.
- Determine protein concentration from the BSA standard curve.
- Normalization: Divide the raw ELISA analyte concentration (ng/mL) by the total urine protein concentration (mg/mL). Result expressed as ng analyte/mg total protein.
Protocol 3: Timed Urine Collection & Volume-Based Excretion Rate Calculation
Purpose: To collect urine for the direct calculation of analyte excretion rate. Procedure:
- Collection: Instruct participant to completely empty their bladder (discard this urine). Note the exact time.
- Collect all urine voided over the subsequent predefined period (e.g., 2, 4, 12, or 24 hours). The final void must be made at the exact end of the collection period.
- Record the total collection time period (T) in hours.
- Upon receipt in the lab, mix the total collection thoroughly. Measure and record the total urine volume (V) in milliliters.
- Aliquot for ELISA and other assays.
- Calculation:
- Perform ELISA to determine analyte concentration [A] in ng/mL.
- Total analyte excreted = [A] (ng/mL) x V (mL) = Total ng.
- Excretion Rate = Total ng / T (hr) = ng/hr.
The Scientist's Toolkit: Research Reagent Solutions
Table 2: Essential Materials for Urine Normalization Assays
| Item | Function & Importance |
|---|---|
| Creatinine Standard (100 mg/dL) | Calibrator for the creatinine assay, establishing the reference curve for quantification. |
| Picric Acid & NaOH (Jaffe Reagents) | React with creatinine to produce a yellow-orange chromogen, proportional to concentration. |
| BSA Protein Standard | Stable protein source for generating the standard curve in the Bradford total protein assay. |
| Coomassie Bradford Reagent | Dye that binds to proteins, causing a spectral shift; absorbance at 595nm is proportional to protein content. |
| UV-Transparent Microplates | For use in colorimetric assays (creatinine, protein). Must be compatible with plate reader. |
| Calibrated Piperttes & Timers | Critical for accurate timed urine collection volume measurement and reagent dispensing. |
| ELISA Kit for Target Analyte | Validated for urine matrix; provides the primary analyte concentration before normalization. |
Visualizing the Normalization Decision Pathway
Title: Decision Workflow for Urine ELISA Data Normalization
Data Presentation: Impact of Normalization Method
Table 3: Example Dataset Demonstrating Normalization Effects
| Subject | Raw ELISA [A]\n(ng/mL) | Urine Volume\n(mL/24h) | [Creatinine]\n(mg/dL) | [Total Protein]\n(mg/mL) | Normalized to Creatinine\n(ng/mg Cr) | Normalized to Total Protein\n(ng/mg TP) | Excretion Rate\n(ng/24h) |
|---|---|---|---|---|---|---|---|
| 1 (Hydrated) | 10.0 | 2000 | 50 | 0.05 | 20.0 | 200.0 | 200,000 |
| 2 (Dehydrated) | 50.0 | 400 | 250 | 0.25 | 20.0 | 200.0 | 20,000 |
| 3 (Proteinuric) | 20.0 | 1200 | 100 | 0.80 | 20.0 | 25.0 | 240,000 |
Note: Subjects 1 & 2 have identical normalized values after creatinine or protein adjustment, revealing similar underlying physiology masked by hydration. Subject 3 shows disparity between methods, highlighting glomerular protein leak. The excretion rate provides the absolute mass output.
Solving Common ELISA Problems in Urine: Optimization Strategies for Sensitivity and Reproducibility
Within the broader context of ELISA protocol optimization for urine biomarker research, matrix-specific interferences present a significant analytical hurdle. Urine is a complex and variable matrix containing endogenous compounds—such as urea, salts, pigments, and heterophilic antibodies—that frequently cause high background or suppressed target signal, compromising assay accuracy and sensitivity. This document provides structured application notes and protocols to identify, characterize, and mitigate these interferences.
Common Urine Interferents & Quantitative Impact
The table below summarizes key interferents, their mechanisms, and typical quantitative impacts on ELISA performance.
Table 1: Primary Urine Interferents and Their Effects on ELISA
| Interferent Category | Specific Compound/Element | Mechanism of Interference | Typical Impact on Signal (vs. Buffer Control) |
|---|---|---|---|
| Ionic Strength & pH | High [Na⁺], [K⁺], [Cl⁻], variable pH | Alters antibody-antigen binding kinetics; denatures proteins. | Signal variation from -50% to +200%. |
| Non-Specific Proteins | Albumin, Tamm-Horsfall protein | Non-specific binding to solid phase or detection components. | Background increase up to 300%. |
| Endogenous Enzymes | Alkaline phosphatase, peroxidases | Competes with detection enzyme, causing false-positive signal. | Background increase up to 400%. |
| Pigments | Urobilin, hemoglobin | Quenches fluorescent or chromogenic signal; absorbs light. | Signal decrease up to 70%. |
| Heterophilic Antibodies | Human Anti-Animal Antibodies (HAAA) | Bridges capture and detection antibodies sans antigen. | False-positive signal increase up to 500%. |
| Metabolites | Urea (high concentration) | Disrupts hydrogen bonding; can denature assay antibodies. | Signal decrease up to 60%. |
Experimental Protocols for Identification and Mitigation
Protocol 1: Interference Screening via Spike-and-Recovery & Linear Dilution
Objective: Determine the presence and magnitude of matrix effects. Materials: Native urine samples, analyte of interest (recombinant standard), assay calibrator diluent, ELISA kit components. Procedure:
- Prepare a pool of urine from healthy donors (ideally ≥5 individuals). Centrifuge at 10,000×g for 10 min to remove particulates.
- Prepare a high-concentration analyte spike in a compatible buffer.
- Perform a spike-and-recovery experiment:
- Group A (Buffer Baseline): Spike analyte into recommended assay diluent at low, mid, and high calibrator levels (n=3 each).
- Group B (Matrix): Spike the same amounts of analyte into the clarified urine pool.
- Group C (Matrix + Dilution): Dilute the urine pool 1:2, 1:4, and 1:8 with assay diluent before spiking with the mid-level analyte concentration.
- Run all samples in a single ELISA plate following the standard protocol.
- Calculate: % Recovery = (Measured concentration in matrix / Measured concentration in buffer) × 100.
- Perform a linearity-of-dilution test: Serially dilute a high-analyte native positive urine sample with assay diluent. Plot measured concentration vs. dilution factor. Deviation from linearity indicates interference.
Protocol 2: Characterization of Interference Type
Objective: Differentiate between specific (e.g., HAAA) and non-specific (e.g., protein binding) interference. Procedure:
- Heterophilic Antibody Blocking: Repeat Protocol 1, Group B, pre-incubating samples for 1 hour with a commercial Heterophilic Blocking Reagent (HBR) or 5-10 µg/mL of nonspecific immunoglobulin from the same species as the ELISA detection antibodies.
- Protein/Non-Specific Binding Blocking: Test different sample diluents:
- Diluent A: Standard assay buffer.
- Diluent B: Assay buffer supplemented with 1-5% BSA or 0.5% casein.
- Diluent C: Assay buffer with 0.1-1% Tween-20 or Triton X-100.
- Compare recoveries and background OD values (from zero-analyte urine samples) across conditions.
Protocol 3: Sample Pre-Treatment Protocols
Objective: Apply physical or chemical treatments to remove interferents. Procedures (Test Independently):
- Dialysis or Desalting: Dialyze urine samples against assay buffer (or PBS) overnight at 4°C using a 3.5 kDa MWCO membrane to remove small ions and urea.
- Solid-Phase Extraction (SPE): Pass urine through a C18 or polymeric SPE column. Elute proteins/analytes with acetonitrile/water mixture, evaporate, and reconstitute in assay buffer.
- Precipitation: Add polyethylene glycol (PEG, final conc. 2-10%) to urine, vortex, incubate on ice for 30 min, centrifuge (12,000×g, 15 min). Collect supernatant for assay.
- Heat Treatment: Heat urine at 56°C for 30 minutes to denature and precipitate some interfering proteins. Centrifuge thoroughly before assay.
The Scientist's Toolkit
Table 2: Essential Research Reagent Solutions for Urine ELISA Troubleshooting
| Item | Function/Application in Protocol |
|---|---|
| Heterophilic Blocking Reagent (HBR) | Blocks human anti-animal antibodies to reduce false-positive signal. Use in sample pre-incubation. |
| IgG from Assay Antibody Host Species | An affordable alternative to HBR for blocking heterophilic interference. |
| High-Purity BSA or Casein | Added to sample diluent to saturate non-specific protein binding sites on plate and components. |
| Non-Ionic Detergent (Tween-20) | Reduces hydrophobic interactions leading to non-specific binding. Optimize concentration (0.01-1%). |
| Synthetic Urine / Artificial Matrix | Serves as an interference-free control matrix for method development and validation. |
| Protease Inhibitor Cocktail (Tablet/Liquid) | Added immediately upon urine collection to prevent analyte degradation, stabilizing signal. |
| Dialysis Tubing (3.5 kDa MWCO) | For desalting and removing low molecular weight interferents like urea and salts. |
| Polymeric Solid-Phase Extraction (SPE) Columns | For selective cleanup and concentration of analyte from the urine matrix. |
| PEG 6000/8000 | For precipitating high molecular weight interferents like uromodulin from samples. |
Visualizing Workflows and Pathways
Title: Urine ELISA Interference Troubleshooting Workflow
Title: Classification of Urine Interferents and Mitigation Strategies
In the context of a broader thesis on ELISA protocol development for urine biomarker research, determining the optimal sample dilution is a critical pre-analytical step. Urine presents a complex matrix with variable osmolarity, pH, and interfering substances (e.g., urea, salts, metabolites) that can cause matrix effects, leading to antigen masking, non-specific binding, or assay signal suppression/enhancement. An improperly chosen dilution can yield inaccurate quantitative results, compromising data validity. This application note details a systematic two-pronged experimental approach—linear range assessment and spike-and-recovery—to empirically determine the optimal dilution factor that ensures analyte quantification falls within the assay's dynamic range while minimizing matrix interference.
Core Experimental Strategy
The optimal dilution is defined as the lowest dilution that adequately minimizes matrix effects to yield accurate recovery (typically 80-120%), while still providing a measurable signal within the assay's established linear range. The workflow is sequential.
Experiment 1: Determining the Assay's Linear Range
Objective: To establish the concentration range over which the ELISA signal response is linear for the target analyte in an ideal (buffer) matrix. This defines the target window for the diluted sample signal.
Protocol:
- Standard Preparation: Reconstitute the ELISA kit's standard according to the manufacturer's instructions using the recommended diluent (often assay buffer or PBS).
- Serial Dilution: Perform a serial dilution (e.g., two-fold or five-fold) of the standard to create a concentration series that spans beyond the kit's claimed range. Include a zero standard (diluent alone).
- ELISA Execution: Run the diluted standards in duplicate or triplicate according to the kit's core protocol (plate coating, blocking, incubation, washing, detection, stop solution).
- Data Analysis: Plot the mean absorbance (y-axis) against the known standard concentration (x-axis). Perform linear regression analysis on the portion of the curve that is visually linear. The Linear Range is defined as the concentration interval where the coefficient of determination (R²) is ≥ 0.99. Record the upper and lower limits.
Table 1: Example Linear Range Data for Urinary IL-8 ELISA
| Standard Concentration (pg/mL) | Mean Absorbance (450 nm) | Within Linear Range? (R² ≥ 0.99) |
|---|---|---|
| 0 | 0.051 | - |
| 3.9 | 0.075 | Yes |
| 7.8 | 0.110 | Yes |
| 15.6 | 0.195 | Yes |
| 31.3 | 0.380 | Yes |
| 62.5 | 0.720 | Yes |
| 125 | 1.450 | Yes |
| 250 | 2.150 | No (Plateau) |
| 500 | 2.300 | No (Plateau) |
Determined Linear Range: 3.9 – 125 pg/mL.
Experiment 2: Spike-and-Recovery to Assess Matrix Effects
Objective: To evaluate the extent of matrix interference at different dilution factors and identify the dilution at which interference is minimized (<20% deviation).
Protocol:
- Sample Pooling: Create a pooled urine sample from multiple donors to average individual variations.
- Baseline Sample: Aliquot a portion of the pooled urine as the "unspiked" sample to determine the endogenous analyte concentration.
- Spike Preparation: Spike another aliquot of the pooled urine with a known concentration of the purified analyte (from the ELISA standard). The spike concentration should be within the assay's linear range and approximately double the expected endogenous level. A second spike at a different concentration is recommended.
- Dilution Series: Prepare a dilution series (e.g., neat, 1:2, 1:5, 1:10, 1:20) of both the unspiked and spiked samples using the ELISA assay buffer.
- ELISA Execution: Analyze all diluted samples (unspiked and spiked) in the same ELISA run.
- Calculation:
- Calculate the measured concentration for each sample from the standard curve.
- Observed Spike Concentration = [Spiked Sample] – [Unspiked Sample]
- % Recovery = (Observed Spike Concentration / Expected Spike Concentration) * 100
Interpretation: Recovery between 80-120% is generally acceptable, indicating minimal matrix effect. The optimal dilution is the lowest dilution factor that yields a recovery within this acceptable range, as it maximizes assay sensitivity.
Table 2: Example Spike-and-Recovery Data for a Pooled Urine Sample
| Dilution Factor | Unspiked [Analyte] (pg/mL) | Spiked (Expected +50 pg/mL) | Observed Spike (pg/mL) | % Recovery | Meets 80-120% Criterion? |
|---|---|---|---|---|---|
| Neat (1:1) | 15.2 | 48.1 | 32.9 | 65.8% | No |
| 1:2 | 7.4 | 38.5 | 31.1 | 62.2% | No |
| 1:5 | 3.1 | 46.2 | 43.1 | 86.2% | Yes |
| 1:10 | 1.5 | 44.8 | 43.3 | 86.6% | Yes |
| 1:20 | 0.7 | 42.1 | 41.4 | 82.8% | Yes |
Optimal Dilution Factor: 1:5 (lowest dilution achieving acceptable recovery).
Integration and Final Optimal Dilution Determination
The final step is to integrate results from both experiments. The chosen dilution must satisfy two conditions: 1) The measured concentration of the diluted sample falls within the assay's linear range, and 2) It demonstrates acceptable spike recovery.
Verification: Using the optimal dilution factor (1:5 from Table 2), calculate the expected concentration range for your study samples. For example, if the highest endogenous concentration in your sample set is estimated at 200 pg/mL, a 1:5 dilution yields 40 pg/mL, which is well within the linear range of 3.9–125 pg/mL (Table 1). This confirms 1:5 as the validated, optimal dilution.
Workflow for Determining Optimal ELISA Dilution
The Scientist's Toolkit: Key Research Reagent Solutions
Table 3: Essential Materials for Dilution Optimization Experiments
| Item | Function & Rationale |
|---|---|
| Urine Pool | A composite sample from multiple donors provides a more consistent and representative matrix for interference testing than individual samples. |
| ELISA Kit Standard | Provides the purified target analyte of known concentration for generating the standard curve and for spiking into the urine matrix. |
| Assay Buffer / Kit Diluent | The recommended matrix for diluting standards and samples. Its composition is optimized to minimize non-specific binding in the ELISA. |
| Low-Binding Microcentrifuge Tubes & Pipette Tips | Prevents analyte adsorption to plastic surfaces, which is critical when working with low-abundance biomarkers at high dilutions. |
| Automated Plate Washer | Ensures consistent and thorough washing between ELISA steps, reducing background noise and improving data precision for accurate recovery calculations. |
| Matrix-Matched Calibrators (Advanced) | For highest accuracy, standards are prepared in a synthetic or analyte-stripped urine matrix rather than buffer, correcting for remaining matrix effects post-dilution. |
Mechanism of Dilution Minimizing Matrix Interference
Addressing Hook Effect and Prozone Phenomenon in High-Abundance Urinary Biomarkers
This application note is a critical component of a broader thesis investigating optimized ELISA protocols for urinary biomarkers. A significant methodological challenge in quantifying high-abundance analytes (e.g., albumin, monocyte chemoattractant protein-1 (MCP-1), neutrophil gelatinase-associated lipocalin (NGAL)) in urine is the Hook Effect or Prozone Phenomenon. This occurs at extremely high analyte concentrations where the excess analyte saturates both capture and detection antibodies, preventing the formation of the requisite sandwich complex, leading to a falsely low or negative signal. This document provides detailed protocols for identification, mitigation, and resolution of this effect to ensure assay accuracy.
Identification and Diagnostic Protocols
Protocol 1: Serial Dilution Screening for Hook Effect
Purpose: To diagnostically identify the presence of a Hook Effect in suspect samples. Materials: Suspect urine sample, assay diluent, microplate reader, ELISA kit components. Procedure:
- Prepare a starting 1:10 dilution of the neat urine sample in recommended assay diluent.
- Perform a two-fold serial dilution across 8-10 wells (e.g., 1:10, 1:20, 1:40... up to 1:5120).
- Run all dilutions through the standard ELISA protocol in parallel.
- Plot the observed concentration (from the standard curve) against the dilution factor. Interpretation: A monotonic increase in calculated concentration with dilution (e.g., a 1:2 dilution yields ~2x higher concentration) indicates no Hook Effect. A non-monotonic curve where calculated concentration increases with further dilution confirms the Hook Effect in the neat sample.
Protocol 2: Spike-Recovery at High Dilutions
Purpose: To confirm assay linearity and absence of matrix effects at the working dilution. Materials: Patient sample, purified analyte standard, assay diluent. Procedure:
- Dilute the sample to a level where the Hook Effect is resolved (determined from Protocol 1).
- Split the diluted sample into three aliquots.
- Spike aliquots with low, mid, and high concentrations of purified analyte standard.
- Measure the concentration in spiked and unspiked samples.
- Calculate % Recovery = (Measured [spiked] – Measured [unspiked]) / Added * 100%. Acceptance Criterion: Recovery between 85-115%.
Table 1: Characteristic Signals Indicative of Hook Effect in Urinary Albumin ELISA
| Sample Description | Neat OD Signal | 1:100 Dilution OD Signal | Apparent [Albumin] Neat (mg/L) | Apparent [Albumin] 1:100 (mg/L) | Hook Effect Present? |
|---|---|---|---|---|---|
| Severe Proteinuria | 0.45 (low) | 2.85 (high) | 120 | >2000 | Yes |
| Normal Urine | 0.15 | 0.02 (below cutoff) | 8 | <2 | No |
| Moderate Proteinuria | 1.85 | 0.95 | 850 | 900 | No |
Table 2: Recommended Initial Dilution Factors for Common High-Abundance Urinary Biomarkers
| Biomarker | Typical Pathological Range | Recommended Initial Screening Dilution | ELISA Dynamic Range (ng/mL) |
|---|---|---|---|
| Albumin | 30 - >2000 mg/L | 1:100 | 5 - 500 |
| NGAL | 50 - >5000 ng/mL | 1:20 | 10 - 1000 |
| MCP-1 | 100 - >2000 pg/mL | 1:10 | 15 - 2000 |
| Cystatin C | 0.1 - >10 mg/L | 1:50 | 0.05 - 10 |
Mitigation and Resolution Protocols
Protocol 3: Optimized Two-Step Incubation for High-Abundance Targets
Purpose: To reduce Hook Effect by allowing solid-phase capture to reach equilibrium before introducing detection antibody. Modified Workflow:
- Capture Incubation: Add diluted sample to coated well. Incubate for 60-90 min (longer than standard). Wash. This allows capture of analyte without competition from detection antibody.
- Detection Incubation: Add detection antibody. Incubate for 60-90 min. Wash.
- Continue with standard substrate incubation and stop solution. Advantage: Minimizes the simultaneous saturation of both antibodies.
Protocol 4: Automated Reflex Testing Algorithm
Purpose: To institute a lab protocol for automatic re-testing of high-concentration samples. Procedure:
- Run all samples at a single, standard low dilution (e.g., 1:10).
- For any sample yielding a result at the upper 95% of the standard curve, flag it.
- Automatically re-run the flagged sample at a higher pre-defined dilution (e.g., 1:100 and 1:1000).
- Report the result from the dilution that yields an OD within the linear portion of the standard curve (typically 20-80% of max OD).
The Scientist's Toolkit: Key Research Reagent Solutions
Table 3: Essential Materials for Hook Effect Management in Urine ELISA
| Item | Function & Rationale |
|---|---|
| High-Affinity, Monoclonal Antibody Pair | Minimizes Hook Effect by providing rapid, stable immune-complex formation. Essential for high-abundance targets. |
| Matrix-Matched Calibrators | Calibrators prepared in synthetic or pooled normal urine correct for matrix interference, improving accuracy at high dilutions. |
| Universal Assay Diluent with Blockers | Contains inert proteins (e.g., BSA, casein) and detergents to reduce non-specific binding in diluted urine samples. |
| Pre-Dilution Tubes with Pre-Measured Buffer | Facilitates rapid, accurate serial dilutions for high-throughput screening of suspect samples. |
| Linearity / Hook Effect Control (High-Value) | A sample with analyte concentration near the assay's maximum defines the limit before Hook Effect onset. |
| Enhanced Chemiluminescence (ECL) Substrate | Expands dynamic range, allowing detection of very high and very low concentrations in the same run, aiding diagnostics. |
Visualizing Workflows and Phenomena
Title: Hook Effect vs. Correct ELISA Signal Formation
Title: Reflex Testing Algorithm for Hook Effect
Application Notes
Within the broader thesis on ELISA protocol optimization for urine biomarker research, a primary challenge is the detection of low-abundance analytes. Factors such as high salt content, variable pH, and the presence of interfering substances necessitate sample pre-treatment. This document details practical strategies for analyte pre-concentration and the implementation of next-generation high-sensitivity ELISA (HS-ELISA) platforms to overcome these limitations, enabling reliable detection in the low pg/mL range from complex urine matrices.
Urine Sample Pre-Concentration Techniques
Pre-concentration is often essential to bring analyte levels above the detection limit of standard assays. The choice of method depends on analyte properties (size, charge, hydrophobicity) and available laboratory resources.
Table 1: Comparison of Urine Analyte Concentration Methods
| Method | Principle | Typical Concentration Factor | Target Analyte Class | Key Advantages | Key Limitations |
|---|---|---|---|---|---|
| Ultrafiltration (Centrifugal) | Size-exclusion using molecular weight cut-off (MWCO) membranes. | 10-100x | Proteins, peptides (>3 kDa) | Rapid, simple, maintains native state. | Membrane adsorption losses, not suitable for small molecules. |
| Lyophilization (Freeze-Drying) | Sublimation of water under vacuum. | 50-200x (volume-dependent) | All non-volatile analytes. | High concentration factor, preserves most proteins. | Time-consuming, may denature some proteins, requires resolubilization. |
| Precipitation (e.g., TCA/Acetone) | Denaturation and precipitation of proteins. | 10-50x | Proteins, primarily. | Effective for broad protein classes, removes some contaminants. | Harsh, may precipitate interfering substances, requires careful pellet washing. |
| Solid-Phase Extraction (SPE) | Selective adsorption to a cartridge resin (C18, ion-exchange, etc.). | 10-100x | Small molecules, peptides, specific protein classes. | Selective, desalts sample, multiple chemistries available. | Method development needed, potential for low recovery. |
Protocol 1: Urine Protein Concentration via Centrifugal Ultrafiltration
Materials:
- Freshly collected or aliquoted, centrifuged (2000 x g, 10 min) urine sample.
- Centrifugal ultrafiltration device (e.g., 10 kDa MWCO, Amicon Ultra).
- Refrigerated centrifuge with fixed-angle rotor.
- Appropriate collection tubes.
- Reconstitution buffer (e.g., PBS, ELISA assay buffer).
Procedure:
- Preparation: Add up to 15 mL of clarified urine to the sample reservoir of the ultrafiltration device.
- Centrifugation: Centrifuge at 4°C according to manufacturer's instructions (typically 4000 x g until desired volume (~100 µL) is achieved in the retentate chamber). Do not spin to complete dryness.
- Recovery: Invert the device into a fresh collection tube. Centrifuge at 1000 x g for 2 min to recover the concentrated retentate.
- Reconstitution: If necessary, dilute the retentate with an appropriate volume of assay buffer to ensure compatibility with the ELISA's sample matrix requirements. Mix gently.
- Proceed to HS-ELISA analysis. Include a control of unconcentrated urine spiked with a known analyte to calculate recovery efficiency.
High-Sensitivity ELISA (HS-ELISA) Platforms
HS-ELISA employs enhanced signal amplification and background reduction technologies. Key platforms include:
Table 2: High-Sensitivity ELISA Technology Platforms
| Platform | Core Enhancement Mechanism | Typical Sensitivity Gain (vs. Standard ELISA) | Best For |
|---|---|---|---|
| Chemiluminescence ELISA | Enzymatic generation of sustained light emission measured by a luminometer. | 10-100x | Broad applications, wide dynamic range. |
| Electrochemiluminescence (ECL) ELISA | Electrochemically triggered light emission at an electrode surface. | 100-1000x | Highest sensitivity, extremely low background. |
| Amplification Systems (e.g., Tyramide) | Enzyme-catalyzed deposition of numerous reporter molecules near the target. | 100-1000x | Detecting extremely low copy numbers. |
Protocol 2: Workflow for a Commercial HS-ELISA (Chemiluminescent)
Materials:
- Commercial HS-ELISA kit (e.g., R&D Systems DuoSet ELISA or similar).
- Pre-concentrated urine samples and standards.
- Microplate luminometer.
- Plate shaker and washer.
Procedure:
- Plate Preparation: Coat a 96-well microplate with capture antibody (diluted in PBS) overnight at room temperature.
- Blocking: Block plate with recommended buffer (e.g., 1% BSA, 5% Trehalose in PBS) for 1-2 hours.
- Sample & Standard Incubation: Add pre-concentrated urine samples and freshly prepared standard dilutions to the plate. Incubate for 2 hours on a shaker.
- Detection Antibody Incubation: Add biotinylated detection antibody. Incubate for 2 hours.
- Streptavidin-Enzyme Conjugate: Add Streptavidin-Horseradish Peroxidase (SA-HRP). Incubate for 20 minutes (protected from light).
- Chemiluminescent Substrate: Add a 1:1 mixture of stabilized hydrogen peroxide and luminol-based substrate. Incubate for 5-20 minutes.
- Readout: Measure relative light units (RLU) immediately using a luminometer with integration time of 0.1-1 second/well.
Experimental Workflow for Urine Biomarker Analysis
Key Signaling Pathway in Enzymatic Signal Amplification
The Scientist's Toolkit: Essential Reagent Solutions
Table 3: Key Research Reagents for HS-ELISA in Urine
| Reagent / Material | Function in the Protocol | Key Consideration for Urine Samples |
|---|---|---|
| Protease Inhibitor Cocktail | Added during urine collection to prevent analyte degradation. | Essential for labile biomarkers; use broad-spectrum inhibitors. |
| Ultrafiltration Devices (e.g., 10kDa MWCO) | Concentrates proteins and peptides via centrifugal force. | Low protein-binding membranes minimize analyte loss. |
| High-Binding ELISA Plates (e.g., Costar 9018) | Maximizes adsorption of capture antibody for assay sensitivity. | Consistency between plate lots is critical for reproducibility. |
| Recombinant Capture/Detection Antibody Pair | Provides high specificity and affinity for the target analyte. | Must be validated for recognition of native vs. modified urinary analyte. |
| Biotinylated Detection Antibody | Enables strong signal amplification via streptavidin-biotin interaction. | Optimal biotin-to-antibody ratio must be optimized. |
| Streptavidin-Poly-HRP Conjugate | Provides multiple enzyme molecules per binding event for amplified signal. | Poly-HRP offers significantly higher sensitivity than monomeric SA-HRP. |
| Stabilized Chemiluminescent Substrate | HRP substrate yielding sustained, bright light signal. | Low background "glow" kinetics are preferable for flexible read times. |
| Artificial Urine Matrix | Used as a diluent for standard curve preparation to match sample matrix. | Mitigates matrix effects, leading to more accurate quantification. |
In the context of a broader thesis on ELISA protocol development for urinary biomarkers, ensuring methodological rigor is paramount. Urine matrices introduce variability from factors like hydration, diurnal variation, and the presence of interferents. This application note details the protocols for calculating intra- and inter-assay Coefficients of Variation (CV) and the systematic integration of Quality Control (QC) samples. These practices are essential for establishing assay precision, monitoring performance over time, and ensuring data reproducibility in longitudinal clinical studies or drug development trials.
Key Concepts & Calculations
Coefficient of Variation (CV): A standardized measure of dispersion, expressed as a percentage, calculated as (Standard Deviation / Mean) x 100. It allows comparison of precision across assays with different concentration scales.
Intra-Assay CV: Measures precision within a single assay run. It assesses repeatability of replicates run simultaneously.
Inter-Assay CV: Measures precision between different assay runs performed over time (different days, different operators, different reagent lots). It assesses the reproducibility of the method.
Quality Control (QC) Samples: Pooled, characterized samples with known analyte concentration ranges, run in every assay to monitor performance. Typically, Low, Mid, and High concentration QCs are used.
Experimental Protocols
Protocol 3.1: Intra-Assay CV Determination
Objective: To determine the repeatability precision of the ELISA for urine samples within a single plate.
- Prepare a urine pool sample with analyte concentration within the dynamic range of the assay.
- Aliquot this sample into a minimum of 10 replicate wells on the same ELISA plate.
- Perform the entire ELISA protocol according to established procedures.
- Calculate the concentration for each of the 10 replicates from the standard curve.
- Calculate the mean (µ) and standard deviation (σ) of these 10 concentration values.
- Calculate Intra-Assay CV: (σ / µ) x 100.
Protocol 3.2: Inter-Assay CV Determination
Objective: To determine the reproducibility precision of the ELISA across multiple independent runs.
- Prepare three separate urine QC pools (Low, Mid, High concentration). Characterize each by assaying 20 times over several days to establish a mean target value and acceptable range (e.g., mean ± 2SD).
- In each subsequent ELISA run (performed on different days), include these three QC samples in duplicate.
- Perform a minimum of 10-20 independent assay runs.
- For each QC level, calculate the mean concentration from all runs and the overall standard deviation across runs.
- Calculate Inter-Assay CV for each QC level: (Overall σ / Overall µ) x 100.
Protocol 3.3: Integration of QC Samples for Run Acceptance
Objective: To establish objective criteria for validating each ELISA run.
- Pre-Run Criteria: The calibration (standard) curve must meet predefined parameters (e.g., R² > 0.99, acceptable back-calculated standard concentrations).
- In-Run QC Criteria: Implement Westgard Multi-Rules for objective decision-making:
- 1₂₅ Rule: A run is rejected if any one QC measurement falls outside the ±2SD limit from the established target mean.
- 1₃₅ Rule: A run is rejected if any one QC measurement falls outside the ±3SD limit.
- R₄₅ Rule: A run is rejected if the range between duplicate QCs exceeds 4SD.
- Document all QC results in a Levey-Jennings chart to visualize trends and shifts.
Data Presentation
Table 1: Example Precision Data for a Urinary Cytokine ELISA
| QC Level | Target Conc. (pg/mL) | Intra-Assay CV (%, n=10) | Inter-Assay CV (%, n=20 runs) | Acceptable Range (pg/mL) |
|---|---|---|---|---|
| Low | 15.2 | 5.8% | 12.1% | 11.7 - 18.7 |
| Mid | 89.5 | 4.1% | 8.5% | 75.1 - 103.9 |
| High | 250.0 | 3.7% | 7.9% | 214.0 - 286.0 |
Table 2: Summary of Key Westgard QC Rules for Run Acceptance
| Rule | Symbol | Condition | Interpretation |
|---|---|---|---|
| Warning Rule | 1₂₅ | One QC point ±2SD-3SD | Potential error; investigate. |
| Rejection Rule | 1₃₅ | One QC point >±3SD | Random error likely; reject run. |
| Rejection Rule | R₄₅ | Difference between QCs >4SD | Excessive random error; reject run. |
Visualizations
Diagram Title: ELISA QC Run Acceptance Workflow
Diagram Title: Intra vs Inter-Assay CV Calculation
The Scientist's Toolkit: Research Reagent Solutions
| Item | Function & Importance |
|---|---|
| Urine QC Pools | Characterized, pooled urine samples with defined analyte ranges. Critical for tracking assay performance in the relevant matrix. |
| ELISA Kit with Matched Antibodies | Provides the core capture/detection antibodies, standards, and conjugate. Lot-to-lot consistency is key for inter-assay CV. |
| Matrix-Blanked Standards | Calibrators prepared in analyte-free urine or a suitable buffer matching urine's protein/salt composition. Reduces matrix effects. |
| Stable Signal Detection Reagent | TMB or other chromogenic/chemiluminescent substrate. Consistent formulation minimizes inter-assay signal variation. |
| Plate Reader with Precision Optics | Accurate and consistent absorbance/fluorescence/luminescence measurement is fundamental for low CVs. Regular calibration is required. |
| Statistical Software (e.g., R, GraphPad Prism) | Essential for calculating CVs, generating Levey-Jennings charts, and applying Westgard rules systematically. |
| Liquid Handling Automation | Pipetting robots or electronic multi-channel pipettes drastically reduce intra-assay variability from manual pipetting errors. |
Validating Your Urine ELISA Assay: Guidelines, Comparison to Other Methods, and Clinical Translation
Application Notes
Within a thesis focused on developing and validating an ELISA protocol for biomarker detection in urine, rigorous assay validation is paramount. Urine presents a complex matrix with variable pH, salt concentrations, and interfering substances (e.g., urea, creatinine, pigments). This document outlines the core validation parameters—Specificity, Sensitivity, Precision, Accuracy, and Linearity—providing application notes and detailed protocols tailored for urine-based ELISA assays.
Specificity
Specificity assesses the assay's ability to measure solely the analyte of interest amidst potential cross-reactors in the urine matrix. For urinary biomarkers, this includes evaluating interference from structurally similar compounds, metabolic derivatives, and common drugs.
Key Experiment: Cross-reactivity & Interference Assessment.
- Protocol: Prepare a series of samples spiked into pooled normal human urine.
- Cross-reactivity: Spike the urine with the target analyte and potential interfering substances (e.g., metabolite analogs, common pharmaceuticals) at physiologically relevant high concentrations (typically 1000 ng/mL). Run the ELISA. Calculate cross-reactivity as:
(Apparent concentration of interfering substance / Actual concentration of interfering substance) x 100%. - Matrix Interference (Hemoglobin, Lipids, Drugs): Spike a known mid-range concentration of the analyte into urine samples deliberately supplemented with interfering agents (e.g., 0.5 mg/mL hemoglobin, 3 mg/mL intralipid, common OTC drugs). Compare recovery against the same analyte concentration in a clean, artificial urine matrix.
- Cross-reactivity: Spike the urine with the target analyte and potential interfering substances (e.g., metabolite analogs, common pharmaceuticals) at physiologically relevant high concentrations (typically 1000 ng/mL). Run the ELISA. Calculate cross-reactivity as:
- Data Interpretation: Cross-reactivity <1-5% is typically acceptable. Recovery in the presence of interferants should remain within 85-115%.
Sensitivity: LOD and LOQ
Sensitivity defines the lowest amount of analyte that can be reliably detected (Limit of Detection, LOD) and quantified (Limit of Quantification, LOQ). The high background noise in urine necessitates robust statistical determination.
Key Experiment: Determination of LOD and LOQ.
- Protocol: Analyze at least 20 independent replicates of the "blank" sample (analyte-free urine pool or zero calibrator). Perform a standard calibration curve alongside these replicates. Calculate the mean and standard deviation (SD) of the measured signal from the blanks.
- Calculations:
- LOD: Typically defined as the mean signal of the blank + 3 SD. Interpolate this signal value onto the calibration curve to obtain the concentration.
- LOQ: Defined as the mean signal of the blank + 10 SD, or the lowest standard that can be measured with an inter-assay precision (CV) ≤20% and accuracy of 80-120%. Interpolate onto the calibration curve.
Precision
Precision measures assay reproducibility and is tested at multiple levels (repeatability/intra-assay, intermediate precision/inter-assay) across the assay range using quality control (QC) samples in a urine matrix.
Key Experiment: Intra-assay and Inter-assay Precision.
- Protocol: Prepare three QC samples in urine (low, mid, high concentration across the calibration range). For intra-assay precision, assay each QC sample a minimum of 10 times in a single run. For inter-assay precision, assay each QC sample in duplicate across a minimum of 5 separate runs, on different days, with different operators and reagent lots if possible.
- Data Analysis: Calculate the mean, SD, and coefficient of variation (CV%) for each QC level.
Accuracy
Accuracy reflects the closeness of agreement between the measured value and the true value. For urine ELISAs, this is evaluated via spike-and-recovery and parallelism (dilution linearity).
Key Experiment: Spike-and-Recovery & Parallelism.
- Protocol:
- Spike-and-Recovery: Spike a known amount of pure analyte into at least 5 different individual urine matrices at low, mid, and high concentrations. Also, prepare the same concentrations in the assay buffer (non-matrix). Run the ELISA and calculate % Recovery:
(Measured concentration in spiked urine / Expected concentration) x 100%. Expected concentration is based on the buffer calibration curve. - Parallelism: Serially dilute (e.g., 1:2, 1:4, 1:8) several native urine samples with high endogenous analyte levels using the assay's zero calibrator or appropriate buffer. The measured concentrations, when corrected for dilution, should be consistent.
- Spike-and-Recovery: Spike a known amount of pure analyte into at least 5 different individual urine matrices at low, mid, and high concentrations. Also, prepare the same concentrations in the assay buffer (non-matrix). Run the ELISA and calculate % Recovery:
Linearity
Linearity assesses whether the assay response is directly proportional to the analyte concentration across the intended range. It validates the calibration model.
Key Experiment: Dilution Linearity.
- Protocol: Select a high-concentration urine sample (native or spiked). Perform a series of dilutions (e.g., neat, 1:2, 1:4, 1:8, 1:16) using the assay's zero calibrator or a validated diluent. Assay all dilutions in duplicate. Plot the observed concentration (y-axis) against the expected concentration (corrected for dilution factor, x-axis).
- Data Analysis: Perform linear regression. The ideal slope is 1.00 and intercept is 0. Acceptance criteria are typically: regression coefficient (R²) ≥0.98, slope of 0.95-1.05, and individual point recoveries within 85-115%.
Table 1: Summary of Validation Parameters and Typical Acceptance Criteria for Urine ELISA
| Parameter | Experiment | Typical Acceptance Criteria | Key Consideration for Urine |
|---|---|---|---|
| Specificity | Cross-reactivity | <1-5% for closely related compounds | Test prevalent urinary metabolites and common drugs. |
| Matrix Interference | Recovery within 85-115% in presence of interferants | Assess effects of bilirubin, hematuria, proteinuria, and specific gravity variations. | |
| Sensitivity | Limit of Detection (LOD) | Signal (MeanBlank + 3SD) | Use a pooled, screened "blank" urine matrix, not just buffer. |
| Limit of Quantitation (LOQ) | Signal (MeanBlank + 10SD) & CV ≤20%, Accuracy 80-120% | Must be validated with actual low-concentration urine samples. | |
| Precision | Intra-assay (Repeatability) | CV <10% for mid/high QC; CV <15% for low QC | Homogeneous urine QC pools are critical. |
| Inter-assay (Intermediate) | CV <15% for mid/high QC; CV <20% for low QC | Include variability from different days, operators, and reagent lots. | |
| Accuracy | Spike-and-Recovery | Mean recovery of 85-115% across the range | Use multiple, diverse individual urine matrices, not just one pool. |
| Parallelism (Dilution) | Recovery of 85-115% for each dilution; linear regression R² ≥0.98 | Demonstrates lack of matrix effects across different sample concentrations. | |
| Linearity | Dilution Linearity | Linear regression slope 0.95-1.05, intercept near 0, R² ≥0.98; point recovery 85-115% | Validates the dynamic range and appropriate diluent for urine samples. |
Experimental Protocols in Detail
Protocol 1: Determination of LOD and LOQ
- Reagents: Calibrators in synthetic urine matrix, analyte-free pooled human urine (minimum 20 individual donors), assay buffer, ELISA kit components.
- Procedure: a. Prepare the calibration curve and the blank (analyte-free urine) samples according to kit instructions. b. Assay the blank sample in at least 20 replicates within the same run. c. Assay the calibration curve in duplicate. d. Calculate the mean optical density (OD) and SD of the blank replicates. e. Calculate LOD OD = Mean(Blank OD) + 3SD(Blank OD). f. Calculate LOQ OD = Mean(Blank OD) + 10SD(Blank OD) OR determine the lowest calibrator that yields a CV ≤20% in independent testing. g. Using the 4- or 5-parameter logistic (4PL/5PL) curve fit from the calibrators, interpolate the LOD and LOQ concentrations from their corresponding OD values.
- Validation: Prepare and assay urine samples spiked at the calculated LOD and LOQ concentrations (n=6 each). For LOQ, confirm CV ≤20% and accuracy 80-120%.
Protocol 2: Inter-assay Precision (Intermediate Precision)
- Reagents: Three levels of QC materials (Low, Medium, High) prepared in a urine matrix, stored in single-use aliquots at appropriate temperature.
- Procedure: a. Over the course of 5-10 separate analytical runs (different days, ideally different operators), perform the ELISA. b. In each run, include the calibration curve and assay each QC level in duplicate. c. Record the calculated concentration for each QC duplicate.
- Analysis: a. Pool all concentration results for each QC level from all runs. b. For each QC level, calculate the overall mean, SD, and CV%. c. CV% = (SD / Mean) * 100%.
The Scientist's Toolkit: Research Reagent Solutions
Table 2: Essential Materials for Urine ELISA Validation
| Item | Function & Rationale |
|---|---|
| Synthetic Urine Matrix | A consistent, analyte-free base for preparing calibrators. Eliminates lot-to-lot variability of pooled human urine, crucial for a stable standard curve. |
| Charcoal-stripped Human Urine Pool | Used as a "blank" matrix for LOD/LOQ and spike-recovery. Charcoal treatment removes endogenous analytes and interfering substances, providing a clean baseline. |
| Individual Donor Urine Samples | Essential for assessing matrix variability in specificity and accuracy experiments. Must be screened for disease status, drugs, and baseline analyte levels. |
| Stable, Lyophilized QC Pools | Quality Control materials at low, mid, and high concentrations in urine. Required for longitudinal precision and accuracy monitoring. Must mimic patient samples. |
| High-Affinity, Monoclonal Antibodies | The core of a specific ELISA. Validated for no cross-reactivity with common urinary interferants. Critical for assay specificity. |
| Urine-Specific Assay Buffer | Optimized to normalize urine pH, ionic strength, and contain blocking agents to minimize non-specific binding from urinary proteins and other components. |
| Analyte Analogues & Metabolites | Pure substances used in cross-reactivity studies to confirm assay specificity for the target biomarker. |
| Common Interferent Stocks | Prepared solutions of hemoglobin, bilirubin, intralipid (for lipids), and common drugs (e.g., ibuprofen, ascorbic acid) for systematic interference tests. |
Visualizations
Diagram 1: Urine ELISA Validation Workflow (57 chars)
Diagram 2: LOD & LOQ Determination Logic (39 chars)
Application Notes & Protocols Thesis Context: Validation of a novel ELISA for the quantification of biomarker 'X' in human urine for clinical drug development studies.
Accurate quantification of analytes in complex biological matrices like urine is critical in drug development research. Urine presents significant matrix effects due to variable salt concentrations, pH, and interfering substances. This document outlines the mandatory validation experiments—Spike-and-Recovery and Parallelism—to demonstrate that the ELISA protocol reliably measures the analyte of interest without matrix interference, ensuring data integrity for the broader thesis research.
Key Experiments & Data
The Spike-and-Recovery Test
Objective: To assess the accuracy of the assay by determining if the analyte can be quantitatively recovered when spiked into the sample matrix.
Protocol:
- Prepare a pooled urine matrix from control subjects (prescreened to be negative for the target analyte).
- Prepare a high-concentration analyte stock solution in the appropriate buffer.
- Create three sample sets in triplicate:
- Set A (Neat Matrix): 100 µL of pooled urine + 0 µL spike.
- Set B (Spiked Matrix): 75 µL of pooled urine + 25 µL of spike solution.
- Set C (Spiked Buffer): 75 µL of assay buffer + 25 µL of spike solution.
- Run all samples through the validated ELISA protocol.
- Calculate recovery:
- Recovery (%) = [ (Measured Conc. of Set B - Measured Conc. of Set A) / Theoretical Conc. of Spike in Set B ] x 100
Acceptance Criterion: Recovery between 80% and 120%.
Table 1: Spike-and-Recovery Data for Urine ELISA
| Sample Set | Matrix | Mean Measured Conc. (pg/mL) | Theoretical Spike (pg/mL) | % Recovery |
|---|---|---|---|---|
| Set A | Urine | 15.2 | 0 | -- |
| Set B | Urine (Spiked) | 138.9 | 125.0 | 99.0 |
| Set C | Buffer (Spiked) | 128.5 | 125.0 | 102.8 |
The Parallelism Dilution Test
Objective: To confirm that the analyte in the native sample behaves identically to the reference standard diluted in buffer, proving the absence of matrix-induced interference across the assay's dynamic range.
Protocol:
- Select two positive urine samples with high endogenous analyte concentrations.
- Perform serial dilutions (e.g., 1:2, 1:4, 1:8) of each urine sample using the recommended assay buffer.
- In parallel, create a standard curve by serially diluting the pure analyte standard in the same buffer.
- Run all diluted samples and standards in the same ELISA plate.
- Calculate the observed concentration for each dilution and correct for the dilution factor.
- Plot the corrected concentration vs. dilution factor.
Acceptance Criterion: The dilution curve should be parallel to the standard curve, and the calculated concentrations should be consistent across dilutions (typically <20% CV).
Table 2: Parallelism Test Data for Urine Sample #1
| Dilution Factor | Observed Conc. (pg/mL) | Corrected Conc. (pg/mL) | % of Mean |
|---|---|---|---|
| Neat | 480.0 | 480.0 | 104.3 |
| 1:2 | 210.5 | 421.0 | 91.5 |
| 1:4 | 112.8 | 451.2 | 98.1 |
| 1:8 | 58.1 | 464.8 | 101.0 |
| Mean ± SD | -- | 460.0 ± 24.5 | -- |
| % CV | -- | 5.3% | -- |
The Scientist's Toolkit: Essential Research Reagent Solutions
Table 3: Key Reagents for Matrix Effect Validation
| Item | Function in Validation |
|---|---|
| Analyte-Free Pooled Urine Matrix | Provides a consistent background matrix for spike-and-recovery tests, representing the sample population. |
| Recombinant/Purified Analyte Standard | Serves as the reference material for spiking and for generating the standard curve to assess parallelism. |
| Assay Diluent Buffer | Used for sample dilutions in parallelism tests; its composition is critical to match the standard curve matrix. |
| ELISA Kit Components | Includes pre-coated plates, detection antibodies, and enzyme conjugates validated for the target. |
| Matrix-Modifying Reagents | (e.g., protease inhibitors, pH adjustment buffers) May be required to stabilize the analyte in urine. |
Experimental Workflow & Logical Diagrams
Diagram 1: Matrix Effect Validation Workflow (82 chars)
Diagram 2: Concept of Parallelism in Immunoassay (68 chars)
Within the broader context of optimizing ELISA protocols for urine biomarker research, selecting the appropriate analytical platform is critical. Urine presents unique challenges, including low analyte concentration, high salt content, and the presence of interfering substances. This application note provides a detailed comparison of traditional ELISA with four alternative platforms—MSD, Luminex, LC-MS/MS, and Western Blot—for urine sample analysis, focusing on performance parameters, practical protocols, and applications in drug development and clinical research.
Platform Comparison and Quantitative Data
Table 1: Comparative Performance Characteristics for Urine Analysis
| Platform | Dynamic Range | Sensitivity (Typical) | Multiplexing Capability | Sample Throughput (Samples/Day) | Sample Volume Required | Key Advantage for Urine |
|---|---|---|---|---|---|---|
| Colorimetric ELISA | 2-3 logs | pg/mL | Low (Single) | 40-80 | 50-100 µL | Cost-effective; widely validated |
| MSD (ECL) | 3-4 logs | fg-pg/mL | Medium (1-10) | 80-120 | 25-50 µL | Wide dynamic range; reduced matrix effect |
| Luminex (xMAP) | 3-4 logs | pg/mL | High (up to 500) | 150-300 | 25-50 µL | High multiplex in single well |
| LC-MS/MS | 2-5 logs | pg/mL (fg for some) | Medium (up to 100) | 50-100 | 500-1000 µL* | Unmatched specificity; absolute quantitation |
| Western Blot | 1-2 logs | ng/mL | Low (Limited) | 10-20 | 10-20 µL* | Size confirmation; post-translational modifications |
*Volume for initial processing; often requires prior concentration. MSD: Meso Scale Discovery; ECL: Electrochemiluminescence.
Table 2: Suitability for Urine Biomarker Types
| Biomarker Type | Recommended Platform(s) | Rationale |
|---|---|---|
| Low-Abundance Cytokines | MSD, Luminex | Superior sensitivity in complex matrix |
| Multi-Panel Biomarker Signature | Luminex, MSD | Multiplex efficiency from single sample |
| Small Molecules/Metabolites | LC-MS/MS | Specificity for low-MW analytes |
| Protein Fragments & Modifications | LC-MS/MS, Western Blot | Structural identification capability |
| High-Abundance Proteins (e.g., Albumin) | ELISA | Adequate sensitivity, cost-effective |
Detailed Experimental Protocols
Protocol 1: Urine Sample Preparation for Multiplex Immunoassays (MSD/Luminex)
Objective: To normalize and dilute urine for accurate analysis while minimizing matrix interference.
- Collection & Storage: Collect mid-stream urine in preservative-free containers. Centrifuge at 2,000 x g for 10 min at 4°C to remove cells/debris. Aliquot supernatant and store at -80°C. Avoid more than two freeze-thaw cycles.
- Normalization: Adjust all samples to a consistent creatinine concentration using a commercial creatinine assay kit. Alternatively, perform specific gravity measurement and normalize to a standard specific gravity (e.g., 1.010).
- Dilution & Additives: Dilute samples 1:2 or 1:4 in the provided assay diluent (often containing blockers for interfering substances). For some assays, add a proprietary matrix solution (e.g., MSD’s Buffer 13) to further neutralize urine matrix effects.
- Assay Execution: Follow manufacturer’s protocol for the specific multiplex kit. For MSD, apply samples to pre-coated 96-well plates, incubate, wash, and add SULFO-TAG labeled detection antibodies before reading on an MSD SECTOR imager. For Luminex, incubate samples with antibody-coated magnetic beads, then add biotinylated detection antibody and streptavidin-PE before reading on a Luminex analyzer.
Protocol 2: LC-MS/MS Workflow for Urinary Metabolites/Peptides
Objective: To quantify low molecular weight biomarkers in urine with high specificity.
- Sample Cleanup: Thaw urine on ice. Centrifuge at 15,000 x g for 15 min at 4°C.
- Solid-Phase Extraction (SPE): Activate and equilibrate a reverse-phase C18 SPE cartridge. Load clarified urine. Wash with 5% methanol/water. Elute analytes with 80% methanol/water containing 0.1% formic acid. Dry eluents under a gentle nitrogen stream.
- Reconstitution: Reconstitute dried extracts in 100 µL of mobile phase A (0.1% formic acid in water). Vortex thoroughly and centrifuge.
- LC-MS/MS Analysis:
- Chromatography: Inject 10 µL onto a reverse-phase UPLC column (e.g., C18, 2.1 x 100 mm, 1.7 µm). Use a gradient from 2% to 98% mobile phase B (0.1% formic acid in acetonitrile) over 10 minutes at 0.3 mL/min.
- Mass Spectrometry: Operate a triple quadrupole MS in positive/negative MRM mode. Optimize precursor/product ion transitions, collision energies, and cone voltages for each target analyte. Use stable isotope-labeled internal standards for precise quantification.
Protocol 3: Western Blot for Urinary Protein Confirmation
Objective: To detect and confirm the size of a specific protein in urine.
- Protein Concentration: Concentrate 1-5 mL of centrifuged urine using a centrifugal filter unit (10 kDa cutoff) to a final volume of 50-100 µL.
- Quantitation & Denaturation: Determine protein concentration (e.g., BCA assay). Mix 20-30 µg of protein with Laemmli buffer containing β-mercaptoethanol. Heat at 95°C for 5 min.
- Electrophoresis & Transfer: Load samples onto a 4-20% gradient SDS-PAGE gel. Run at constant voltage (120-150V). Transfer proteins to a PVDF membrane using a wet transfer system (100V, 60 min).
- Immunodetection: Block membrane with 5% non-fat milk in TBST for 1 hour. Incubate with primary antibody (diluted in blocking buffer) overnight at 4°C. Wash (3 x 10 min TBST). Incubate with HRP-conjugated secondary antibody for 1 hour at RT. Wash. Develop using enhanced chemiluminescence (ECL) substrate and image.
Visualizations
Title: General Urine Sample Prep Workflow
Title: Platform Selection Logic for Urine Analysis
The Scientist's Toolkit: Research Reagent Solutions
Table 3: Essential Materials for Urine Biomarker Assays
| Item | Function/Description | Example/Supplier |
|---|---|---|
| Creatinine Assay Kit | Normalizes urine analyte concentration for dilution variance. | Abcam Creatinine Assay Kit, Cayman Chemical |
| Protease Inhibitor Cocktail | Prevents protein degradation in urine during collection/storage. | cOmplete, EDTA-free (Roche) |
| SULFO-TAG Label | ECL label for MSD assays; enables sensitive detection. | MSD GOLD SULFO-TAG NHS Ester |
| Magnetic Bead Kits | Multiplex immunoassay beads for Luminex platform. | Bio-Plex Pro Human Cytokine Assays (Bio-Rad) |
| SPE Cartridges | Clean-up and concentrate analytes prior to LC-MS/MS. | Waters Oasis HLB, 30 µm |
| Stable Isotope Standards | Internal standards for precise LC-MS/MS quantification. | Cambridge Isotope Laboratories |
| PVDF Membrane | High-binding membrane for Western blot protein transfer. | Immobilon-P (MilliporeSigma) |
| HRP-Conjugate & ECL Substrate | Chemiluminescent detection system for Western/ELISA. | Clarity Western ECL Substrate (Bio-Rad) |
| Assay Diluent with Blockers | Reduces nonspecific binding & matrix interference in immunoassays. | MSD Blocker A, Assay Diluent 100 |
| Centrifugal Filter Units | Concentrate low-abundance urinary proteins. | Amicon Ultra (10K MWCO, Millipore) |
Application Notes
The accurate determination of diagnostic thresholds is the cornerstone of translating ELISA-based urine biomarker research into clinical utility. This process involves two distinct but interrelated concepts: the Reference Range, derived from a healthy population, and the Clinical Cut-off, optimized for diagnostic sensitivity and specificity against a disease cohort.
- Defining the Healthy Cohort: The selection of a healthy reference population must be rigorously controlled. Inclusion criteria should account for age, sex, ethnicity, renal function (e.g., eGFR > 90 mL/min/1.73m²), absence of acute/chronic illness, and lifestyle factors (e.g., hydration status, diurnal variation). Exclusion criteria must be explicitly defined to eliminate subclinical disease. For urine ELISAs, normalization to creatinine (ng/mg creatinine) or total protein is essential to correct for urine concentration.
- Defining the Disease Cohort: The disease cohort should be well-phenotyped using established diagnostic criteria (e.g., histopathology, imaging, clinical scores). Staging and severity stratification within the disease cohort are critical for evaluating a biomarker's dynamic range. Inclusion of relevant disease control cohorts (e.g., other inflammatory conditions for an autoimmune biomarker) is necessary to assess specificity.
- Statistical Considerations: Reference ranges are typically established as the central 95% interval (2.5th to 97.5th percentiles) of the healthy population distribution, often after log-transformation if data are non-parametric. Clinical cut-offs are determined by analyzing the overlap between healthy and disease cohort distributions using Receiver Operating Characteristic (ROC) curve analysis. The optimal cut-off is selected based on the intended use—maximizing sensitivity for screening or specificity for confirmation.
Quantitative Data Summary
Table 1: Example Data Distribution for a Hypothetical Urine Biomarker (Protein X)
| Cohort | N | Mean Concentration (ng/mg Cr) | 95% Reference Interval (ng/mg Cr) | Median (IQR) (ng/mg Cr) | Assay CV (%) |
|---|---|---|---|---|---|
| Healthy Adults | 120 | 5.2 | 1.5 – 12.8 | 4.8 (2.1 – 9.3) | <8% (Intra), <12% (Inter) |
| Disease Stage I | 45 | 18.7 | N/A | 16.4 (12.1 – 24.9) | <8% (Intra) |
| Disease Stage IV | 38 | 125.3 | N/A | 98.5 (65.2 – 210.7) | <8% (Intra) |
Table 2: ROC Curve Analysis for Disease Detection (All Stages vs. Healthy)
| Potential Cut-off (ng/mg Cr) | Sensitivity (%) | Specificity (%) | Youden's Index (J) |
|---|---|---|---|
| 8.5 | 95.2 | 89.2 | 0.844 |
| 12.0 | 88.0 | 95.8 | 0.838 |
| 15.0 | 81.9 | 98.3 | 0.802 |
Experimental Protocols
Protocol 1: Establishment of a Healthy Cohort Reference Range Objective: To determine the central 95% reference interval for biomarker Y in spot urine samples from a healthy adult population.
- Cohort Recruitment: Recruit N≥120 individuals meeting stringent health criteria. Obtain informed consent.
- Sample Collection: Collect first-morning void spot urine in sterile containers. Centrifuge at 2,000 x g for 10 min at 4°C. Aliquot supernatant and store at -80°C.
- Biomarker Assay: Perform ELISA in duplicate according to manufacturer's protocol. Include a standard curve and QC samples on each plate.
- Normalization: Measure urine creatinine for each sample using a standardized assay (e.g., Jaffe method). Express biomarker result as mass/creatinine (e.g., pg/mg Cr).
- Data Analysis: Inspect data distribution (Shapiro-Wilk test). If non-Gaussian, apply log10 transformation. Calculate the 2.5th and 97.5th percentiles to establish the 95% reference interval.
Protocol 2: Determination of a Clinical Diagnostic Cut-off Objective: To define an optimal diagnostic cut-off value using ROC curve analysis.
- Cohort Assembly: Assay samples from a pre-characterized disease cohort (N≥50) and the defined healthy reference cohort using Protocol 1.
- Data Compilation: Compile normalized biomarker concentrations with cohort status (Healthy=0, Disease=1).
- ROC Analysis: Use statistical software (e.g., R, MedCalc, GraphPad Prism) to generate an ROC curve plotting sensitivity vs. 1-specificity.
- Cut-off Selection: Calculate Youden's Index (J = Sensitivity + Specificity - 1) for all possible cut-offs. The point with the maximum J is the optimal cut-off for balanced performance. Alternatively, select a cut-off favoring high sensitivity or specificity based on clinical need.
- Validation: Validate the selected cut-off in an independent, blinded cohort of samples.
Diagrams
The Scientist's Toolkit
Table 3: Essential Research Reagent Solutions for Urine Biomarker ELISA Studies
| Item | Function/Benefit |
|---|---|
| High-Binding ELISA Plates | Optimized polystyrene surface for efficient capture antibody immobilization. |
| Matched Antibody Pair | Monoclonal or affinity-purified polyclonal antibodies against distinct epitopes of the target antigen for sandwich ELISA. |
| Recombinant Antigen Standard | Highly purified, quantified protein for generating the standard curve, enabling absolute quantification. |
| Stable Chemiluminescent/Colorimetric Substrate | Provides sensitive, linear signal detection. Chemiluminescence offers wider dynamic range. |
| Urine Creatinine Assay Kit | Essential for normalizing biomarker concentration to account for urine dilution, standardizing results. |
| Matrix Interference Blocker | Specialty buffer (e.g., containing heterophilic blocking reagents) to minimize non-specific signal in complex urine matrices. |
| Low-Protein Binding Tubes & Tips | Prevents analyte loss due to adhesion to plastic surfaces during sample handling. |
| Multiplex Bead-Based Immunoassay Panel | For validation, allows simultaneous measurement of the target biomarker and related markers in scarce sample volumes. |
Introduction Within the broader context of developing robust ELISA protocols for urine matrix research, this document presents application notes highlighting the critical role of urine-based immunoassays in translational science. Urine ELISA offers a non-invasive method for quantifying biomarkers and pharmacokinetic parameters, facilitating drug development and biomarker discovery.
Case Study 1: Quantifying Renal Drug Transporters in Preclinical Development Objective: To assess the renal clearance mechanism of a novel diuretic drug (Candidate DX-12) by quantifying human organic anion transporter 3 (hOAT3) shedding in rat urine. Protocol:
- Sample Collection & Preparation: Collect rat urine over 24 hours in containers with 0.1% sodium azide. Centrifuge at 3,000 x g for 10 minutes at 4°C. Dilute supernatant 1:5 in Standard Diluent Buffer (PBS, 0.1% BSA, 0.05% Tween-20, pH 7.4).
- ELISA Execution: Use a commercial sandwich ELISA kit for hOAT3. Load 100 µL of diluted sample and standards in duplicate. Follow kit protocol: incubate 2 hours at RT, wash, add detection antibody (1 hour), wash, add HRP-conjugated streptavidin (30 min), wash, add TMB substrate (15 min), stop with 1N H₂SO₄.
- Data Analysis: Read absorbance at 450 nm (correction 570 nm). Generate a 4-parameter logistic standard curve. Apply dilution factor for final concentration (pg/mL).
Results: A dose-dependent increase in urinary hOAT3 was observed post-DX-12 administration.
Table 1: Urinary hOAT3 Levels Post-DX-12 Administration
| DX-12 Dose (mg/kg) | Mean Urinary hOAT3 (pg/mL) ± SEM | Fold Increase vs. Control |
|---|---|---|
| 0 (Control) | 125.4 ± 15.2 | 1.0 |
| 1 | 310.7 ± 28.9 | 2.5 |
| 5 | 845.2 ± 75.3 | 6.7 |
| 25 | 1850.6 ± 210.4 | 14.8 |
Case Study 2: Clinical Validation of a Kidney Injury Biomarker Panel Objective: To validate a multiplex urine ELISA panel (NGAL, KIM-1, Cystatin C) for early detection of drug-induced kidney injury (DIKI) in a Phase I oncology trial. Protocol:
- Batch Sample Analysis: Thaw patient urine aliquots at 4°C overnight. Vortex and centrifuge at 10,000 x g for 5 min.
- Multiplex ELISA Protocol: Use a validated multiplex magnetic bead-based ELISA kit. Mix 25 µL of sample/standard with antibody-conjugated magnetic beads. Incubate 2 hours on a shaker. Wash beads twice using a magnetic plate washer. Add biotinylated detection antibody mixture (1 hour), wash, add streptavidin-PE (30 min), wash, resuspend in reading buffer.
- Instrument Reading & Analysis: Analyze on a multiplex array reader. Generate standard curves for each analyte using 5-PL curve fitting. Report concentrations in ng/mL, normalized to urinary creatinine.
Results: The panel identified subclinical kidney injury 48-72 hours before serum creatinine elevation.
Table 2: Performance of Urinary Biomarker Panel for DIKI Prediction
| Biomarker | AUC (95% CI) | Cut-off (ng/mg Cr) | Sensitivity (%) | Specificity (%) |
|---|---|---|---|---|
| NGAL | 0.92 (0.85-0.97) | 150 | 88 | 90 |
| KIM-1 | 0.88 (0.80-0.94) | 2.1 | 85 | 82 |
| Cystatin C | 0.79 (0.70-0.87) | 250 | 80 | 75 |
| Panel (Combined) | 0.96 (0.91-0.99) | -- | 95 | 93 |
The Scientist's Toolkit: Key Reagent Solutions
| Item | Function in Urine ELISA |
|---|---|
| Urine Stabilizer Cocktail (e.g., protease inhibitors, azide) | Preserves labile protein biomarkers from degradation during collection/storage. |
| Standard Diluent Buffer with Synthetic Urine Matrix | Mimics native urine composition to ensure accurate standard curve generation and reduce matrix interference. |
| High-Affinity, Cross-Reactivity Validated Antibody Pairs | Ensures specific detection of the target analyte amidst a complex and variable urine proteome. |
| Creatinine Assay Kit (Colorimetric) | Enables normalization of biomarker concentration to account for variations in urine concentration and hydration status. |
| Low-Protein-Binding Microplates & Pipette Tips | Minimizes nonspecific adsorption of analytes, which is critical for low-abundance urine biomarkers. |
Diagrams
Title: Urine ELISA Core Workflow
Title: Drug-Induced Kidney Biomarker Pathways
Conclusion
Successfully performing ELISA on urine samples requires a meticulous, tailored approach that addresses the unique complexities of the urinary matrix. By understanding the foundational challenges, following a robust methodological protocol, proactively troubleshooting, and rigorously validating the assay, researchers can generate reliable and meaningful data. This enables the full exploitation of urine as a rich, non-invasive source of biomarkers for mechanistic studies, drug development, and clinical diagnostics. Future directions include greater harmonization of pre-analytical variables, adoption of multiplex and digital ELISA technologies for enhanced sensitivity, and the integration of urine biomarker data with other omics platforms for comprehensive systems biology approaches. Mastering urine ELISA protocols is thus a critical skill for advancing personalized medicine and translational research.