ELISA Plate Coating: A Step-by-Step Protocol for Researchers and Drug Development Professionals
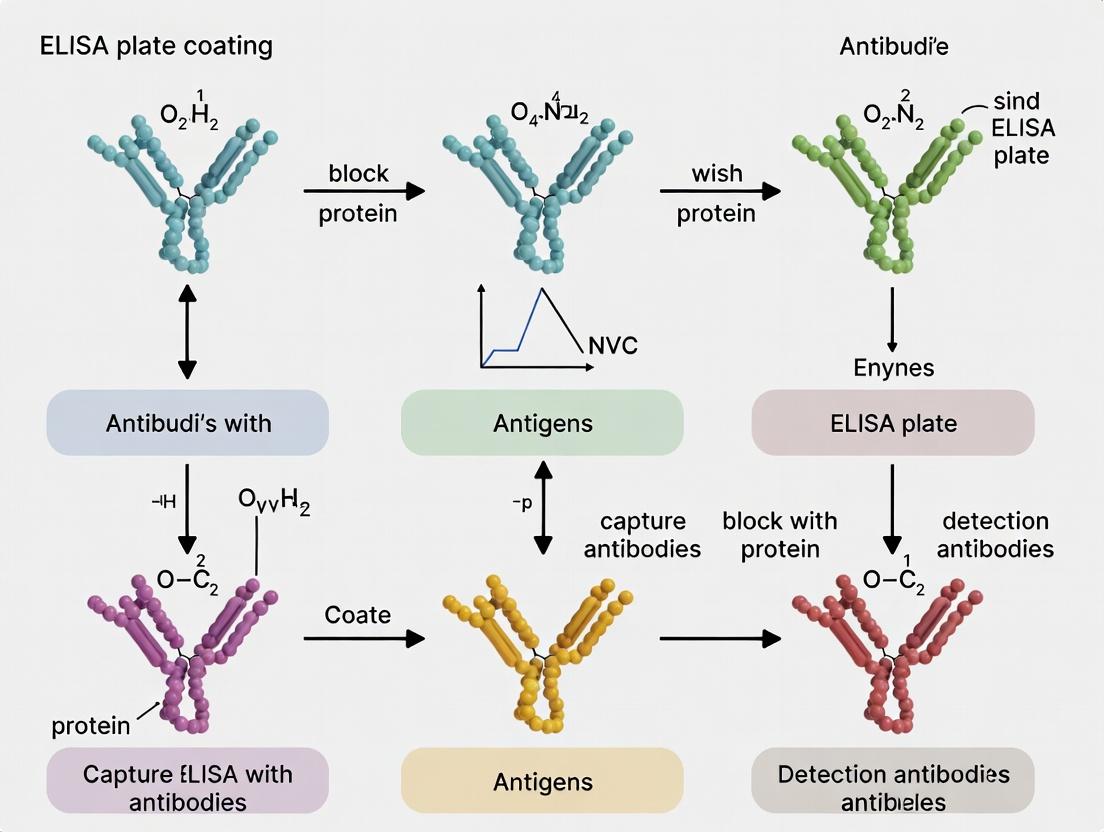
This comprehensive guide details the ELISA plate coating procedure, the critical first step that determines assay sensitivity and reliability.
ELISA Plate Coating: A Step-by-Step Protocol for Researchers and Drug Development Professionals
Abstract
This comprehensive guide details the ELISA plate coating procedure, the critical first step that determines assay sensitivity and reliability. Tailored for researchers, scientists, and drug development professionals, we explore the foundational principles of passive adsorption and covalent coupling, provide a robust methodological protocol, offer in-depth troubleshooting for common pitfalls, and discuss validation strategies. Learn how to optimize coating conditions for your specific antigen-antibody pair, ensure reproducibility, and lay the groundwork for high-quality diagnostic and research ELISA data.
ELISA Plate Coating Fundamentals: Principles, Mechanisms, and Reagent Selection
What is ELISA Plate Coating? Defining the Critical First Step
Within the broader thesis on ELISA plate coating procedure optimization, this whitpaper establishes coating as the fundamental, rate-limiting step in Enzyme-Linked Immunosorbent Assay (ELISA) development. The process immobilizes a capture molecule—typically an antigen or antibody—onto the surface of a microplate, forming the assay's foundation. The efficiency, uniformity, and stability of this layer directly dictate the sensitivity, specificity, and reproducibility of the entire immunoassay. This guide details the physicochemical principles, current methodologies, and quantitative parameters defining this critical first step.
ELISA plate coating is the non-covalent or covalent attachment of a biomolecule to the solid phase of a polystyrene or polyvinyl chloride microplate. The primary objective is to present the capture agent in a functionally active orientation, maximizing its availability for subsequent binding events. The performance ceiling of an ELISA is intrinsically set during this phase; suboptimal coating cannot be compensated for in later steps.
Physicochemical Principles of Adsorption
Passive adsorption, the most common coating method, relies on hydrophobic and electrostatic interactions between the protein and the plastic surface.
- Hydrophobic Interactions: Non-polar regions of the protein interact with the hydrophobic polystyrene surface, driven by entropy gain from released ordered water molecules.
- Electrostatic Interactions: The net charge of the protein (dependent on buffer pH relative to its pI) and the slightly negative charge of treated polystyrene plates influence binding strength and orientation.
Optimal coating requires a buffer pH that ensures sufficient protein solubility while promoting hydrophobic interaction. A pH slightly above the protein's pI is often used for antibodies to encourage orientation via the hydrophobic Fc region.
Detailed Experimental Protocols
Standard Passive Adsorption Protocol
This is the benchmark method for most antibody or protein antigen coating.
- Dilution: Dilute the purified capture protein (typically at 1-10 µg/mL for antibodies, 0.5-5 µg/mL for antigens) in a suitable coating buffer (e.g., 0.05 M carbonate-bicarbonate, pH 9.6, or 0.01 M PBS, pH 7.4). Filter the solution through a 0.22 µm membrane.
- Dispensing: Pipette 50-100 µL of the coating solution into each well of a high-binding microplate. For 96-well plates, 100 µL/well is standard.
- Incubation: Seal the plate to prevent evaporation. Incubate typically for 1-2 hours at 37°C or overnight (12-16 hours) at 2-8°C. Overnight coating at 4°C often yields more uniform layers.
- Washing: Aspirate the coating solution. Wash the plate three times with 200-300 µL of wash buffer (e.g., PBS with 0.05% Tween 20, PBST). Blot the plate on absorbent paper to remove residual liquid.
- Blocking: Immediately add 200-300 µL of blocking agent (e.g., 1-5% BSA, 3-5% non-fat dry milk, or 1% gelatin in PBS) to each well. Incubate for 1-2 hours at room temperature.
- Storage: Wash the plate three times as before. The plate can be used immediately, dried under vacuum, and sealed for short-term storage, or lyophilized for long-term preservation.
Covalent Coating Protocol (e.g., for Carbohydrates or Haptens)
Used when passive adsorption is inefficient.
- Plate Activation: Use pre-activated plates (e.g., NHS-ester, maleimide) or activate standard plates with 100 µL/well of 2.5% glutaraldehyde in PBS for 2-4 hours at RT.
- Washing: Wash the activated plate 3x with PBS.
- Ligand Coupling: Add the ligand (e.g., a modified hapten or carbohydrate) diluted in a coupling buffer (often 0.1 M carbonate, pH 8.5). Incubate for 2-4 hours at RT or overnight at 4°C.
- Quenching: Aspirate and add 200 µL of quenching solution (e.g., 1 M Tris-HCl, pH 7.5, for glutaraldehyde; 0.1 M ethanolamine for NHS esters). Incubate for 30 minutes.
- Washing and Blocking: Wash 3x with PBST, then proceed to standard blocking (Step 5 above).
Quantitative Analysis of Coating Parameters
The following table summarizes critical variables and their optimized ranges based on current literature and product datasheets.
Table 1: Optimization Parameters for ELISA Plate Coating
| Parameter | Typical Range | Impact on Assay Performance | Recommended Starting Point |
|---|---|---|---|
| Coating Buffer pH | 7.4 - 9.6 | Affects protein charge, solubility, and binding orientation. | pH 9.6 Carbonate buffer for most antibodies. |
| Coating Concentration | 0.5 - 20 µg/mL | Determines surface density; too high can cause steric hindrance. | 2-5 µg/mL for mAbs; 1-2 µg/mL for recombinant antigens. |
| Incubation Time | 1 hr @ 37°C to O/N @ 4°C | Longer, cooler incubation can increase uniformity. | Overnight at 4°C for consistency. |
| Plate Binding Capacity | 200-500 ng IgG/cm² | Maximal protein binding for high-binding plates. | Calculate volume needed to saturate ~50% capacity. |
| Blocking Agent | 1-5% Protein / 0.1-1% Detergent | Reduces non-specific binding. Must be unrelated to assay components. | 3% BSA in PBS for most research assays. |
| Coating Stability | 4°C (weeks), -20°C (months) | Dependent on protein stability and drying method. | Use vacuum-sealed, lyophilized plates for long-term storage. |
Table 2: Comparison of Common ELISA Plate Surfaces
| Plate Type | Binding Mechanism | Ideal For | Advantages | Limitations |
|---|---|---|---|---|
| High-Binding (Hydrophobic) | Passive, hydrophobic | Antibodies, large proteins | High capacity, cost-effective | Denaturation risk, random orientation |
| Medium-Binding | Mixed hydrophobic/ionic | Proteins prone to denaturation | Better activity retention | Lower capacity |
| Covalent (e.g., NHS-Activated) | Covalent amine coupling | Small peptides, haptens, carbohydrates | Stable, oriented binding | Complex protocol, higher cost |
| Streptavidin/Biotin | High-affinity biotin-streptavidin | Biotinylated capture molecules | Flexible, oriented, high sensitivity | Requires biotinylation step |
The Scientist's Toolkit: Essential Coating Materials
Table 3: Research Reagent Solutions for Plate Coating
| Item | Function & Rationale |
|---|---|
| High-Binding Polystyrene Microplates | The solid phase with a treated surface to maximize hydrophobic protein adsorption. |
| Carbonate-Bicarbonate Buffer (pH 9.6) | Common alkaline coating buffer promoting hydrophobic interaction for antibodies. |
| Phosphate-Buffered Saline (PBS, pH 7.4) | Neutral coating buffer for sensitive antigens or when aiming for varied orientation. |
| Bovine Serum Albumin (BSA) | The gold-standard blocking agent to occupy remaining hydrophobic sites. |
| Casein or Non-Fat Dry Milk | Effective, economical blocking agent; avoid if using phospho-specific antibodies. |
| Tween 20 | Non-ionic detergent added to wash buffers (PBST) to reduce non-specific binding. |
| Glutaraldehyde / NHS-Esters | Crosslinkers for covalent immobilization strategies. |
| Microplate Sealing Tape | Prevents evaporation and contamination during incubation steps. |
| Plate Washer (or Manual Washer) | Ensures consistent and thorough washing between all assay steps. |
Visualization of Workflows and Relationships
ELISA Plate Coating Workflow
Coating Method Decision Logic
The coating step is the definitive foundation of a robust ELISA. Its optimization—tailoring buffer, concentration, time, and surface chemistry to the specific capture molecule—is non-negotiable for achieving high sensitivity and reproducibility. As explored in the wider thesis, innovations in plate surface engineering, oriented immobilization techniques, and novel blocking agents continue to evolve, but the core principles outlined here remain paramount. For the researcher, meticulous attention to this first step is the most effective strategy to avoid the propagation of error and variability throughout the entire immunoassay.
The selection of a plate coating methodology is a foundational decision in ELISA development, directly dictating assay sensitivity, specificity, and reproducibility. This whitepaper, framed within a broader thesis on optimizing ELISA solid-phase immobilization, provides a technical dissection of the two predominant strategies: passive adsorption and covalent coupling. Understanding the underlying science of these binding mechanisms is critical for researchers and drug development professionals to tailor immunoassays for specific target analytes, particularly challenging ones like small molecules, denatured proteins, or carbohydrates.
Fundamental Mechanisms
Passive Adsorption relies on non-covalent interactions—hydrophobic, electrostatic, and van der Waals forces—between the plate's polystyrene surface and hydrophobic regions of the protein. The process is driven by the incubation of a protein solution in a high-pH carbonate/bicarbonate buffer, which increases protein hydrophobicity.
Covalent Coupling involves the formation of irreversible chemical bonds between functional groups on the protein (e.g., primary amines, carboxyls, or thiols) and reactive groups pre-coated on the plate surface (e.g., amine-reactive N-hydroxysuccinimide esters). This method requires a chemically activated surface.
Quantitative Comparison
The following table summarizes the core characteristics and performance data of both methods, synthesized from current literature and product datasheets.
Table 1: Comparative Analysis of Coating Methods
| Parameter | Passive Adsorption | Covalent Coupling |
|---|---|---|
| Binding Mechanism | Non-covalent (hydrophobic, electrostatic) | Covalent (e.g., amide, thioether bonds) |
| Orientation | Random; depends on protein surface hydrophobicity | Controlled, if using site-specific chemistry |
| Typical Coating Efficiency | 50-500 ng/cm² (highly protein-dependent) | 70-90% of offered protein (more consistent) |
| Optimal pH | Alkaline (pH 9.6 carbonate buffer) | Varies by chemistry (often pH 7-9 for amine coupling) |
| Immobilization Time | 1-16 hours at 37°C or overnight at 2-8°C | 30 min - 2 hours at room temperature |
| Required Protein Purity | Low to Moderate | Moderate to High (avoids cross-reactivity) |
| Best For | Robust, non-sensitive antibodies; antigens with hydrophobic patches | Small molecules, peptides, carbohydrates, sensitive proteins, acidic/basic proteins |
| Stability | Moderate (can leach under harsh conditions) | High (resists leaching, denaturing agents) |
| Cost | Lower (standard plates) | Higher (activated plates, extra reagents) |
Table 2: Impact on Assay Performance (Representative Data)
| Assay Metric | Passive Adsorption | Covalent Coupling |
|---|---|---|
| Signal-to-Noise Ratio | Variable; can be high for ideal proteins | Consistently high, with lower background |
| Inter-assay CV | 10-15% | 5-10% |
| Dynamic Range | Can be limited by coating capacity | Often wider due to uniform coating |
| Susceptibility to Leaching | High under low-ionic strength or detergent | Negligible |
Experimental Protocols
Protocol A: Standard Passive Adsorption for ELISA
- Coating Buffer: Prepare 0.05 M carbonate-bicarbonate buffer, pH 9.6.
- Protein Dilution: Dilute the capture antibody or antigen to 1-10 µg/mL in coating buffer.
- Plate Coating: Add 100 µL per well to a polystyrene microplate.
- Incubation: Seal plate and incubate overnight at 4°C OR for 1-2 hours at 37°C.
- Washing: Aspirate solution and wash plate 3x with 200-300 µL PBS-T (PBS with 0.05% Tween 20) per well.
- Blocking: Add 200-300 µL of blocking buffer (e.g., 1-5% BSA or casein in PBS) per well. Incubate 1-2 hours at room temperature.
- Storage: Wash as in step 5. Plates can be dried and sealed for storage at 4°C, or used immediately.
Protocol B: NHS-Ester Based Covalent Coupling to Amine-Modified Plates
- Plate Activation: Use a commercially available amine-reactive plate (e.g., NHS-activated) OR activate a carboxyl-modified plate using a crosslinker like EDC/NHS.
- Protein Preparation: Dialyze the protein into a coupling buffer (e.g., 0.1 M MES, 0.9% NaCl, pH 6.0). Avoid buffers containing primary amines (e.g., Tris, glycine).
- Coupling: Add 100 µL of protein solution (10-100 µg/mL in coupling buffer) per well. Incubate for 2 hours at room temperature or overnight at 4°C with gentle shaking.
- Quenching: Aspirate the protein solution. Add 200 µL of quenching buffer (e.g., 1 M Tris-HCl, pH 7.5, or 1% ethanolamine) per well. Incubate for 30 minutes to block unreacted NHS esters.
- Washing: Wash the plate 5x with alternating cycles of PBS-T and a low-pH buffer (e.g., 0.1 M acetate, pH 4.0, with 0.5 M NaCl) to remove non-covalently bound protein.
- Blocking & Storage: Proceed with standard blocking (as in Protocol A, Step 6) to cover any remaining hydrophobic sites.
Visualizing the Workflow and Mechanisms
Diagram 1: ELISA Coating Method Decision & Workflow
Diagram 2: Molecular Binding Mechanisms Compared
The Scientist's Toolkit: Research Reagent Solutions
Table 3: Essential Materials for Coating Methodologies
| Item | Function/Benefit | Common Examples/Formats |
|---|---|---|
| High-Binding Polystyrene Plates | Optimized for passive adsorption; maximizes hydrophobic interaction. | Corning Costar, Nunc MaxiSorp, Greiner Bio-One HIGH BIND. |
| Amine-Reactive Plates | Pre-activated with NHS esters for direct covalent coupling of amine-containing ligands. | Thermo Fisher NHS-Activated Plates, Cytiva Amine Coupling Plates. |
| Carboxylate-Modified Plates | Surface provides -COOH groups for covalent coupling via crosslinkers like EDC/NHS. | Various specialty plates for carbodiimide chemistry. |
| Carbonate-Bicarbonate Buffer (pH 9.6) | Standard coating buffer for passive adsorption; induces protein hydrophobicity. | 0.05 M or 0.1 M concentration; easily prepared from sodium salts. |
| Coupling Buffers (Amine-free) | Maintain optimal pH for covalent reactions without interfering primary amines. | MES, PBS (pH 7.2-7.4), Borate buffers. |
| EDC (1-Ethyl-3-(3-dimethylaminopropyl)carbodiimide) | Zero-length crosslinker; activates carboxyl groups for direct reaction with amines. | Hydrochloride salt; used with NHS to form stable esters. |
| Sulfo-NHS (N-hydroxysulfosuccinimide) | Water-soluble crosslinker stabilizer; forms amine-reactive sulfo-NHS esters with carboxyls. | Often used in conjunction with EDC for efficient amine coupling. |
| Blocking Agents | Saturate remaining binding sites to minimize non-specific background. | BSA, Casein, Skim Milk, Fish Gelatin, Synthetic Blockers (e.g., Pierce Protein-Free Block). |
| Non-ionic Detergent (e.g., Tween 20) | Critical component of wash buffers; reduces non-specific binding through gentle detergent action. | Typically used at 0.05% (v/v) concentration in PBS or Tris buffers. |
Within the broader research on optimizing ELISA plate coating procedures, the selection of the solid phase is a foundational parameter that dictates assay performance. This guide provides a technical analysis of high-binding, medium-binding, and specialized microplate options, framing their selection as a critical variable in achieving desired sensitivity, specificity, and reproducibility in immunoassay development for drug discovery and diagnostic applications.
Plate Chemistry and Binding Mechanisms
The binding of biomolecules (proteins, peptides, antibodies) to polystyrene plates is governed by hydrophobic and ionic interactions. High-binding plates maximize these interactions through a hydrophobic surface or charged functional groups, while medium-binding plates offer a moderated hydrophilic surface. Specialized plates introduce specific chemical functionalities (e.g., streptavidin, Ni²⁺ chelation) for oriented capture.
Coating Mechanism Workflow
Diagram Title: ELISA Plate Coating and Assay Workflow
Quantitative Comparison of Plate Types
Table 1: Characteristic Binding Capacities and Applications of ELISA Plate Types
| Plate Type | Typical Binding Capacity (IgG) | Surface Chemistry | Optimal For | Key Limitation |
|---|---|---|---|---|
| High-Binding | 400-600 ng/cm² | Hydrophobic polystyrene; often untreated or with carboxyl groups | Capture assays with abundant antigen; screening assays where maximum coating is desired | Potential for denaturation of conformation-sensitive antigens; higher non-specific binding (NSB) risk |
| Medium-Binding | 200-350 ng/cm² | Moderately hydrophilic; often achieved via gamma irradiation or polymer grafts | Assays requiring preserved antigen conformation; reduces NSB | Lower signal potential for low-abundance targets |
| Specialized (e.g., Streptavidin) | Varies (biotin binding ~500 ng/cm²) | Covalently linked streptavidin or neutravidin | Biotinylated capture molecules; oriented immobilization | Requires biotinylation step; higher cost |
| Specialized (Ni-Coated) | Varies (His-tag dependent) | Chelated Ni²⁺ ions | Recombinant His-tagged proteins | Leaching of metal ions; incompatible with EDTA/some buffers |
| Specialized (Amino/Carboxyl) | 300-500 ng/cm² (post-activation) | Derivatized with NH₂ or COOH groups | Covalent coupling via crosslinkers (EDC/NHS) | Requires additional chemical activation steps |
Detailed Experimental Protocols
Protocol A: Determining Optimal Plate Type for a Novel Antigen
Objective: Systematically compare signal-to-noise ratio (SNR) across plate types for a specific protein antigen. Materials: See "Scientist's Toolkit" below. Procedure:
- Plate Coating: Prepare identical concentrations (1-10 µg/mL in PBS or carbonate-bicarbonate buffer, pH 9.6) of the target antigen. Aliquot 100 µL/well into selected wells of high-binding, medium-binding, and specialized (if applicable) plates. Include buffer-only wells for background. Incubate overnight at 4°C or 2 hours at 37°C.
- Washing: Aspirate and wash plates 3x with 300 µL/well of wash buffer (PBS + 0.05% Tween-20). Blot dry.
- Blocking: Add 200 µL/well of blocking buffer (e.g., 1% BSA in PBS, or 5% non-fat dry milk). Incubate for 1-2 hours at room temperature (RT). Wash as in step 2.
- Primary Antibody: Add 100 µL/well of serially diluted primary detection antibody in dilution buffer. Incubate 1-2 hours at RT. Wash.
- Secondary Antibody: Add 100 µL/well of HRP-conjugated secondary antibody at manufacturer's recommended dilution. Incubate 1 hour at RT, protected from light. Wash.
- Detection: Add 100 µL/well of TMB substrate. Incubate for 5-15 minutes in the dark.
- Stop Reaction: Add 50 µL/well of 1M H₂SO₄ or 2M H₃PO₄.
- Readout: Measure absorbance immediately at 450 nm (reference 570 nm or 620 nm).
- Analysis: Calculate SNR for each plate type: (Mean Signal - Mean Background) / Standard Deviation of Background. Plot binding curves to determine dynamic range.
Protocol B: Covalent Coating on Amino-Binding Plates
Objective: Immobilize a peptide antigen via covalent linkage. Procedure:
- Plate Activation: Add 100 µL/well of fresh 2.5% glutaraldehyde in PBS to amino-binding plate. Incubate 2-4 hours at RT.
- Wash: Wash 5x with ultrapure water to remove excess crosslinker.
- Antigen Coupling: Add 100 µL/well of peptide antigen (10-50 µg/mL in 0.1M phosphate buffer, pH 7.0). Incubate overnight at 4°C.
- Quenching: Aspirate antigen solution. Add 100 µL/well of 1M Tris-HCl, pH 8.0, to quench unreacted aldehyde groups. Incubate 30 minutes at RT.
- Wash and Block: Wash 3x with wash buffer. Proceed with standard blocking and assay steps as in Protocol A.
Decision Pathway for Plate Selection
Diagram Title: ELISA Plate Selection Decision Tree
The Scientist's Toolkit: Essential Research Reagent Solutions
Table 2: Key Materials for ELISA Plate Coating Research
| Item | Function & Rationale |
|---|---|
| High-Binding Polystyrene Plates (e.g., Corning Costar 3590, Nunc MaxiSorp) | Maximal passive adsorption via hydrophobic interactions; ideal for robust capture antibodies or resilient antigens. |
| Medium-Binding Plates (e.g., Corning Medium Binding, Greiner CELLSTAR) | Reduced hydrophobicity minimizes conformational change; suitable for labile proteins and antigens. |
| Streptavidin-Coated Plates | Pre-coated with streptavidin/neutravidin for uniform, oriented capture of biotinylated molecules; reduces NSB. |
| Ni²⁺-Chelate Plates | Immobilizes His-tagged recombinant proteins via affinity capture, enabling purification and detection in one step. |
| Amino- or Carboxyl-Modified Plates | Provide functional groups for covalent crosslinking (e.g., using EDC/sulfo-NHS), preventing leaching. |
| Carbonate-Bicarbonate Buffer (pH 9.6) | Common high-pH coating buffer that enhances electrostatic attraction between protein and polystyrene. |
| PBS (Phosphate-Buffered Saline) | Neutral pH coating buffer alternative; less denaturing for some proteins. |
| BSA (Bovine Serum Albumin) or Casein | Standard blocking agents to occupy unbound sites and minimize non-specific binding. |
| Tween-20 | Non-ionic detergent added to wash buffers (typically 0.05%) to reduce hydrophobic interactions and wash away unbound material. |
| Glutaraldehyde / EDC-NHS | Crosslinking reagents for covalent immobilization on functionalized plates. |
| TMB (3,3',5,5'-Tetramethylbenzidine) | Chromogenic HRP substrate yielding blue product measurable at 450 nm. |
| Microplate Reader (Absorbance, 450 nm) | Essential for quantifying colorimetric ELISA endpoint signal. |
Within the broader thesis investigating variables impacting antigen immobilization in Enzyme-Linked Immunosorbent Assay (ELISA) plate coating, the selection of coating buffer emerges as a critical, yet often under-optimized, parameter. The ionic composition, pH, and buffering capacity of the coating solution directly influence the binding efficiency, orientation, and stability of the adsorbed protein, thereby affecting assay sensitivity, specificity, and reproducibility. This whitepaper provides an in-depth technical comparison between the two most prevalent coating buffers: Carbonate-Bicarbonate (CB) and Phosphate-Buffered Saline (PBS), equipping researchers with the data and protocols to make an informed selection.
Buffer Chemistry and Principles of Protein Adsorption
Protein adsorption to a polystyrene plate is driven by hydrophobic and electrostatic interactions. The buffer pH relative to the protein's isoelectric point (pI) determines the net charge on the protein molecule, influencing its orientation and packing density on the similarly charged plate surface.
- Carbonate-Bicarbonate Buffer (pH 9.6): This high pH buffer is the traditional standard for ELISA. At pH 9.6, most antibodies (pI ~5-8) carry a net negative charge. The polystyrene surface also tends to be negatively charged, potentially leading to repulsion. However, the high ionic strength (typically 0.1 M) screens this charge, and adsorption is predominantly driven by hydrophobic interactions. This can promote a "flattened," denatured conformation.
- Phosphate-Buffered Saline (PBS, pH 7.4): A physiological pH buffer. At pH 7.4, many proteins carry a slight net negative or neutral charge. Electrostatic interactions with the plate can be more varied. Adsorption may be gentler, potentially preserving more native protein conformation, but may result in lower binding capacity for some antigens.
Comparative Data Analysis
The following tables summarize key performance characteristics based on current literature and experimental data.
Table 1: Fundamental Buffer Properties
| Property | Carbonate-Bicarbonate (0.05 M, pH 9.6) | Phosphate-Buffered Saline (0.01 M, pH 7.4) |
|---|---|---|
| Primary Buffer Species | CO₃²⁻/HCO₃⁻ | H₂PO₄⁻/HPO₄²⁻ |
| Standard Working pH | 9.2 - 9.6 | 7.2 - 7.4 |
| Buffering Capacity at working pH | High | Moderate |
| Ionic Strength | ~0.1 M | ~0.15 M (with 0.137 M NaCl) |
| Key Chemical Effect | High pH promotes hydrophobic adsorption | Physiological pH may preserve conformation |
Table 2: Experimental Performance in ELISA Coating
| Performance Metric | Carbonate-Bicarbonate | PBS | Notes / Experimental Context |
|---|---|---|---|
| Coating Efficiency (for IgG) | High (OD ~2.5-3.0) | Moderate to High (OD ~2.0-2.8) | Measured via direct IgG coating, detection with anti-IgG-HRP. CB often yields 10-25% higher signal. |
| Optimal Coating Concentration | Often 2-10 µg/mL | May require 5-15 µg/mL | To achieve similar saturation, PBS may require ~1.5x higher protein input. |
| Signal-to-Noise Ratio | Typically Higher | Can be Comparable | Dependent on antigen stability. Denaturation in CB can sometimes expose non-specific epitopes. |
| Reproducibility (%CV) | <10% (intra-assay) | <12% (intra-assay) | Both are excellent with proper technique. CB may show slightly better inter-assay consistency. |
| Impact on Labile Antigens | Potentially Denaturing | Potentially Preserving | Critical for peptides, certain recombinant proteins, or conformational epitopes. |
Detailed Experimental Protocols
Protocol 1: Direct Comparison of Coating Buffers
Objective: To empirically determine the optimal coating buffer for a specific antigen/antibody pair. Materials: See "The Scientist's Toolkit" below. Procedure:
- Prepare coating solutions of your target protein (e.g., capture antibody or antigen) at a fixed concentration (e.g., 5 µg/mL) in both 0.05 M CB (pH 9.6) and 0.01 M PBS (pH 7.4).
- Add 100 µL/well of each solution to a 96-well microplate. Include replicates (n=6).
- Seal plate and incubate overnight at 4°C.
- Wash plate 3x with 300 µL/well of wash buffer (e.g., PBS with 0.05% Tween-20).
- Block with 200 µL/well of blocking buffer (e.g., 3-5% BSA in PBS) for 1-2 hours at room temperature.
- Wash 3x.
- Proceed with standard ELISA steps (primary detection, secondary antibody-HRP, substrate).
- Plot mean absorbance (OD) and standard deviation for each buffer condition. Evaluate for significant difference in signal intensity and background.
Protocol 2: Assessing Antigen Stability Post-Coating
Objective: To evaluate if coating buffer affects antigen conformation for sandwich ELISA. Procedure:
- Coat plates with a capture antibody using optimal conditions (often CB, pH 9.6).
- Block and wash.
- Apply the target antigen (native protein) to the captured wells.
- Subsequently, detect the bound antigen using two different detection antibodies: one targeting a linear epitope and one targeting a conformational epitope.
- Compare the signal ratio (conformational/linear) for antigen captured from a solution prepared in CB vs. PBS. A significantly lower ratio for CB-sourced antigen suggests conformational disruption.
Visualization: Decision Workflow and Coating Mechanism
Diagram 1: Coating Buffer Selection Workflow
Diagram 2: Protein Adsorption Mechanism by Buffer
The Scientist's Toolkit
| Research Reagent / Material | Function in Coating Optimization |
|---|---|
| High-Binding Polystyrene Plates | The solid phase; surface chemistry is optimized for passive protein adsorption. |
| Carbonate-Bicarbonate Buffer (1L Pack) | Ready-to-use powder or concentrate for consistent preparation of pH 9.6 coating buffer. |
| Phosphate-Buffered Saline (PBS) Tablets | Provides precise, convenient formulation of physiological pH buffer for coating or washing. |
| Bovine Serum Albumin (BSA), Molecular Biology Grade | The gold standard blocking agent to occupy residual hydrophobic sites after coating. |
| Tween-20 (Polysorbate 20) | Non-ionic detergent added to wash buffers (e.g., 0.05% v/v) to reduce non-specific binding. |
| Microplate Sealing Tape | Prevents evaporation and contamination during overnight coating incubations. |
| Microplate Washer (or Manual Washer) | Ensures consistent and thorough washing between assay steps, critical for low background. |
| Precision pH Meter with Micro Electrode | Essential for verifying and adjusting the pH of prepared coating buffers. |
| Non-Adhesive (Low-Binding) Microcentrifuge Tubes | For storing and diluting precious protein stocks to prevent loss via surface adsorption. |
Context: This technical guide is presented within the framework of a broader thesis investigating the optimization of ELISA plate coating procedures. The foundational properties of the antigen—concentration, purity, and isoelectric point (pI)—are critical variables that directly dictate the efficiency, specificity, and reproducibility of the subsequent immunoassay.
Antigen Concentration
Optimal antigen concentration is paramount for effective plate coating. Insufficient antigen leads to high background noise and poor sensitivity, while excess antigen can cause steric hindrance, non-specific binding, and wasteful reagent use. The standard approach involves a checkerboard titration to identify the optimal concentration that yields the highest signal-to-noise ratio for a given antibody pair.
Quantitative Data on Typical Coating Concentrations
Table 1: Recommended Antigen Coating Concentrations for ELISA
| Antigen Type | Typical Coating Range | Recommended Buffer | Key Consideration |
|---|---|---|---|
| Recombinant Protein | 0.5 – 10 µg/mL | Carbonate-Bicarbonate (pH 9.6) | Avoid aggregates; centrifuge before use. |
| Whole Virus or Viral Lysate | 1 – 20 µg/mL | PBS (pH 7.4) | Purity affects uniformity; may require gradient purification. |
| Peptide (< 5 kDa) | 5 – 50 µg/mL | PBS or Carbonate-Bicarbonate | Often requires a carrier protein or biotin-streptavidin capture. |
| Complex Cell Lysate | 10 – 100 µg/mL | PBS (pH 7.4) | High background risk; requires stringent blocking. |
| Carbhydrate/Polysaccharide | 10 – 100 µg/mL | PBS (pH 7.4) | Passive adsorption can be inefficient; consider covalent coupling. |
Experimental Protocol: Checkerboard Titration for Coating Optimization
Objective: To determine the optimal antigen and detection antibody concentrations simultaneously. Materials:
- Antigen stock solution
- Carbonate-bicarbonate coating buffer (0.05 M, pH 9.6)
- PBS-T (PBS with 0.05% Tween-20)
- Blocking buffer (e.g., 5% non-fat dry milk or 1% BSA in PBS)
- Primary detection antibody
- HRP-conjugated secondary antibody
- TMB substrate and stop solution (e.g., 1M H₂SO₄)
- ELISA microplate reader
Procedure:
- Prepare serial dilutions of the antigen in coating buffer across a range (e.g., 10, 2, 0.4, 0.08 µg/mL).
- Coat a 96-well plate with 100 µL/well of each antigen dilution. Include columns with coating buffer alone as blanks. Incubate overnight at 4°C or for 2 hours at 37°C.
- Wash the plate 3x with PBS-T.
- Block with 200 µL/well of blocking buffer for 1-2 hours at room temperature (RT). Wash 3x.
- Prepare serial dilutions of the primary detection antibody in blocking buffer.
- Add the primary antibody dilutions to rows of the plate, creating a matrix where each antigen concentration is tested against each antibody concentration. Incubate 1-2 hours at RT. Wash 3x.
- Add the HRP-conjugated secondary antibody at manufacturer-recommended dilution. Incubate 1 hour at RT. Wash 3-5x.
- Add TMB substrate (100 µL/well). Incubate in the dark for 5-15 minutes.
- Stop the reaction with 100 µL/well of stop solution.
- Read absorbance at 450 nm immediately.
- Analysis: Identify the antigen/antibody concentration pair that gives the highest signal for positive controls while maintaining a low background (typically OD < 0.1 for blanks).
Antigen Purity
Purity directly influences assay specificity and consistency. Impurities (e.g., host cell proteins, nucleic acids, endotoxins) can compete for binding sites on the plate, lead to non-specific antibody binding, and increase inter-assay variability.
Key Purity Assessment Methods
- SDS-PAGE: Visual assessment of band intensity. >90% single band is typically desired.
- High-Performance Liquid Chromatography (HPLC): Quantifies percent purity based on peak area.
- Mass Spectrometry: Confirms identity and detects modifications.
- Endotoxin Assay (LAL): Critical for antigens used in cellular or in vivo applications.
Experimental Protocol: Assessing Purity via SDS-PAGE and Densitometry
Objective: To quantify the percentage of the target protein in an antigen preparation. Procedure:
- Prepare antigen samples and known standards in Laemmli buffer.
- Load samples onto a polyacrylamide gel (gradient or appropriate % for protein size) alongside a pre-stained protein ladder.
- Run electrophoresis at constant voltage until the dye front nears the bottom.
- Stain the gel with Coomassie Blue or a more sensitive fluorescent stain (e.g., SYPRO Ruby).
- Image the gel using a documentation system with appropriate filters.
- Use densitometry software (e.g., ImageJ, Image Lab) to analyze lane profiles.
- Calculate the purity percentage as:
(Intensity of target band / Total intensity of all lanes in the lane) x 100.
Antigen Isoelectric Point (pI)
The pI—the pH at which a molecule carries no net electrical charge—is a crucial determinant of successful passive adsorption. At a pH above its pI, a protein carries a net negative charge and will bind readily to positively charged surfaces (like standard polystyrene, which is slightly anionic). Optimal coating is generally achieved at a pH at least 1.0 unit above the protein's pI.
Quantitative Data on pI and Coating pH
Table 2: Effect of Antigen pI on Recommended Coating Conditions
| Antigen pI Range | Recommended Coating Buffer pH | Coating Efficiency Rationale |
|---|---|---|
| Low pI (< 5.0) | 9.6 (Carbonate) | Ensures strong net negative charge for adsorption to plate. |
| Medium pI (5.0-8.0) | 9.6 or 7.4 (PBS) | pH 9.6 is generally effective; PBS may suffice for pI ~8.0. |
| High pI (> 8.0) | 7.4 (PBS) or lower | At pH 9.6, a high pI protein may be neutral/positive, leading to poor adsorption. |
Experimental Protocol: Determining Optimal Coating pH for a Novel Antigen
Objective: To empirically identify the coating buffer pH that maximizes antigen adsorption. Procedure:
- Prepare a series of 0.05 M coating buffers across a pH range (e.g., pH 4.0 acetate, pH 7.4 PBS, pH 9.6 carbonate).
- Dilute the antigen to a fixed, intermediate concentration (e.g., 2 µg/mL) in each buffer.
- Coat plate columns with 100 µL/well of each antigen-buffer solution. Include a well with buffer only for each pH as a blank.
- Incubate and block as per standard protocol.
- Use a standardized, high-affinity detection system (e.g., a well-characterized monoclonal antibody at optimal concentration) to quantify the amount of antigen captured.
- The pH condition yielding the highest specific signal (sample OD - blank OD) indicates the optimal coating pH for that antigen-plate combination.
Visualization: The Interplay of Antigen Properties in ELISA Coating Optimization
Title: Antigen Property Optimization for ELISA Coating
The Scientist's Toolkit: Essential Reagents for Antigen Characterization & Coating
Table 3: Key Research Reagent Solutions
| Item | Function in Antigen/Coating Work |
|---|---|
| Carbonate-Bicarbonate Buffer (pH 9.6) | High pH buffer commonly used for passive adsorption of most proteins to polystyrene plates. |
| Phosphate-Buffered Saline (PBS, pH 7.4) | Neutral pH buffer used for coating high pI antigens, washing, and dilution. |
| PBS with Tween-20 (PBS-T) | Standard wash buffer; Tween-20 minimizes non-specific binding. |
| Blocking Agents (BSA, Casein, Non-fat Milk) | Proteins or mixtures used to saturate remaining protein-binding sites on the plate after coating. |
| TMB (3,3',5,5'-Tetramethylbenzidine) Substrate | Chromogenic HRP substrate yielding a blue product measurable at 450 nm (after acid stop). |
| Precast Polyacrylamide Gels | For rapid, consistent SDS-PAGE analysis of antigen purity and molecular weight. |
| Coomassie Blue or SYPRO Ruby Stain | For visualizing protein bands on gels post-electrophoresis. |
| pI Marker Standards | A set of proteins of known pI used in isoelectric focusing to calibrate and estimate sample pI. |
| High-Binding Polystyrene ELISA Plates | Standard plate surface with hydrophobic properties optimized for protein adsorption. |
| Pierce BCA Protein Assay Kit | Colorimetric method for accurate quantification of total protein concentration prior to coating. |
Mastering the ELISA Coating Protocol: A Detailed Step-by-Step Guide
Within the broader research context of optimizing ELISA plate coating procedures, the pre-coating preparation phase is critical. This phase establishes the foundational conditions that dictate assay sensitivity, specificity, and reproducibility. This technical guide details the three pillars of pre-coating preparation: plate selection, buffer formulation, and antigen dilution strategy, providing current, evidence-based protocols for researchers and drug development professionals.
Plate Choice
The selection of the microplate is the first determinant of successful antigen immobilization.
Table 1: Comparison of ELISA Plate Surfaces and Binding Characteristics
| Plate Type (Surface Chemistry) | Optimal For | Binding Mechanism | Typical Protein Binding Capacity (ng/cm²)* | Key Considerations |
|---|---|---|---|---|
| High-Binding (Polystyrene, Passive) | Most antibodies, large proteins (>10 kDa) | Hydrophobic & ionic interactions | 300 - 500 | Risk of denaturation; potential for non-specific binding. |
| Medium-Binding (Polystyrene, Passive) | Medium-sized antigens, sticky proteins | Moderate hydrophobic interactions | 200 - 300 | Reduces denaturation for some sensitive proteins. |
| Low-Binding (Polystyrene, Passive) | Small peptides, hydrophobic proteins | Weaker hydrophobic interactions | 50 - 100 | May require higher antigen concentration for sufficient coating. |
| Covalent/Linker-Coated (e.g., NHS, Glutaraldehyde) | Small peptides (<10 kDa), haptens, modified proteins | Covalent linkage to functional groups | 400 - 600 (varies) | Directional immobilization possible; requires specific buffer conditions (no Tris, amine-free). |
| Streptavidin/Biotin-Coated | Biotinylated antigens/antibodies | High-affinity streptavidin-biotin interaction | N/A | Requires biotinylation step; offers precise, oriented capture. |
| Capacity values are approximate and depend on specific protein and conditions. |
Experimental Protocol: Plate Binding Capacity Determination
- Antigen Labeling: Prepare a series of dilutions of a standard protein (e.g., BSA, IgG) in coating buffer. Spike a subset with a fluorescent dye (e.g., FITC) or use a radioiodinated tracer.
- Coating: Add 100 µL of each dilution to wells of the test plates (n=4 per dilution). Incubate overnight at 4°C.
- Washing: Aspirate and wash wells 3x with PBS-Tween 20 (0.05% v/v).
- Detection:
- For fluorescent labels: Measure fluorescence directly with a plate reader.
- For radioactive labels: Count wells in a gamma counter.
- For unlabeled protein: Perform a standard total protein assay (e.g., BCA) on the coating solution before and after incubation.
- Calculation: Plot signal vs. input concentration. The plateau indicates saturation of binding sites. Calculate capacity based on well surface area.
Buffer Preparation
The coating buffer stabilizes the antigen and promotes uniform adsorption.
Table 2: Common Coating Buffer Formulations and Applications
| Buffer | Typical Composition (pH adjusted to) | Ideal Use Case | Rationale & Notes |
|---|---|---|---|
| Carbonate-Bicarbonate | 50 mM Na₂CO₃, 50 mM NaHCO₃ (pH 9.6) | Most antibodies, many proteins. | High pH increases protein hydrophobicity and net negative charge on polystyrene, enhancing hydrophobic/ionic adsorption. Gold standard for many protocols. |
| Phosphate-Buffered Saline (PBS) | 10 mM PO₄³⁻, 137 mM NaCl, 2.7 mM KCl (pH 7.4) | Sensitive proteins/antigens, cells, or peptides prone to alkaline denaturation. | Physiological pH and isotonicity help maintain native conformation. Lower binding efficiency than carbonate buffer for some proteins. |
| Tris-HCl | 50 mM Tris (pH 8.5) | Alternative near-neutral/alkaline buffer. | Avoid with amine-reactive covalent plates. |
| Acetate | 50-100 mM Sodium Acetate (pH 4.0 - 5.0) | Very acidic proteins (pI < 4). | Low pH ensures protein net positive charge, promoting binding to negatively charged plate. |
Experimental Protocol: Buffer Optimization for a Novel Antigen
- Prepare the antigen solution (at a fixed mid-range concentration, e.g., 2 µg/mL) in four different coating buffers: Carbonate (pH 9.6), PBS (pH 7.4), Tris (pH 8.5), and Acetate (pH 5.0).
- Coat a high-binding plate with 100 µL/well of each buffer-antigen combination (n=6 replicates). Include wells with buffer alone (no antigen) as blanks.
- Incubate overnight at 4°C.
- Wash plate 3x with wash buffer (e.g., PBS-T).
- Perform a standard ELISA protocol: block, add primary and secondary detection antibodies, develop with substrate.
- Analyze the signal-to-noise ratio (SNR: Mean Signal of Antigen Well / Mean Signal of Blank Well). The buffer yielding the highest SNR indicates optimal coating conditions for that antigen-plate combination.
Antigen Dilution
Determining the optimal coating concentration is essential to avoid the "hook effect" and conserve reagent.
Experimental Protocol: Checkerboard Titration for Coating Concentration
- Prepare a two-fold serial dilution of the capture antigen in the chosen coating buffer along the plate's rows (e.g., 8 dilutions from 10 µg/mL to 0.08 µg/mL).
- Prepare a two-fold serial dilution of the primary detection antibody in assay buffer down the plate's columns (e.g., 6 dilutions).
- Coat the plate with 100 µL/well of the antigen dilutions. Each antigen concentration will be tested against every antibody concentration.
- After coating, blocking, and washing, add 100 µL/well of the primary antibody dilutions.
- Complete the ELISA with secondary antibody and substrate.
- Analysis: Identify the pair of concentrations (antigen and primary antibody) that yields an optical density (OD) in the mid-linear range of the standard curve (e.g., OD ~1.0 - 2.0 for your substrate) for maximal sensitivity and dynamic range. The lowest antigen concentration that gives a strong specific signal with its optimal antibody concentration is the ideal coating condition.
The Scientist's Toolkit: Research Reagent Solutions
Table 3: Essential Materials for ELISA Pre-Coating
| Item | Function & Rationale |
|---|---|
| High-Binding Polystyrene Microplates | The most common platform; provides consistent, high-capacity hydrophobic surface for passive protein adsorption. |
| Carbonate-Bicarbonate Buffer Capsules | Ensures reproducible, pH-stable (9.6) coating buffer preparation without the need for pH adjustment. |
| Molecular Biology Grade Water | Used for all buffer prep to avoid contaminants (ions, organics, nucleases) that interfere with protein adsorption. |
| BSA (Bovine Serum Albumin) or HSA | The standard blocking agent; used after coating to occupy remaining hydrophobic sites and prevent non-specific antibody binding. |
| Tween 20 | A non-ionic detergent added to wash buffers (typically 0.05%) to reduce non-specific binding through hydrophilic masking. |
| Microplate Sealing Film | Prevents evaporation and contamination during overnight coating incubations, ensuring consistent buffer ionic strength. |
| Precision Multichannel Pipettes | Enables rapid, uniform dispensing of coating solutions across the plate, a critical factor for inter-well consistency. |
Diagrams
Title: Plate Selection Decision Tree
Title: Pre-Coating Preparation Workflow
Within the comprehensive workflow of ELISA plate coating procedure research, the initial step of aliquotting and dispensing reagents is a critical determinant of assay precision, reproducibility, and ultimately, data validity. This technical guide examines precision pipetting techniques, focusing on their impact on the accuracy of coating buffer, antigen, and capture antibody distribution in microplate wells. We provide a quantitative analysis of error sources, detailed protocols for validation, and a toolkit for optimal execution.
The uniformity of analyte capture across an ELISA plate is directly contingent upon the consistency of the coating solution dispensed into each well. Sub-microliter variations in volume can introduce significant inter-well variability, leading to skewed standard curves and compromised detection limits. This step, therefore, is not merely a preparatory task but a core experimental parameter requiring rigorous standardization.
The following table summarizes primary contributors to volumetric error during the aliquot and dispense phase of plate coating.
Table 1: Sources and Magnitudes of Pipetting Error in ELISA Coating
| Error Source | Typical Impact on Volume (Coefficient of Variation, CV%) | Mitigation Strategy |
|---|---|---|
| Liquid Handling Technique | 1.5% - 5.0% | Use of consistent, slow aspiration/dispense speed; proper immersion depth. |
| Pipette Calibration | 0.5% - 3.0% | Regular (quarterly) calibration and maintenance by certified providers. |
| Environmental Factors (e.g., temp., humidity) | 0.2% - 1.5% | Acclimatization of pipettes and reagents to lab ambient temperature. |
| Liquid Properties (e.g., viscosity of coating buffer) | 0.8% - 4.0% | Use of positive displacement pipettes for viscous solutions. |
| Tip Fit & Quality | 0.5% - 2.0% | Use of manufacturer-recommended, high-quality, low-retention tips. |
Experimental Protocol: Gravimetric Validation of Pipetting Precision for Coating Solutions
Aim: To quantify the accuracy and precision of a specific pipette for dispensing a standard ELISA coating buffer (e.g., 0.05 M Carbonate-Bicarbonate, pH 9.6).
Materials:
- Analytical balance (accuracy ±0.01 mg)
- Calibrated air-displacement pipette and compatible tips
- Purified water or specific coating buffer
- Weighing vessels
- Temperature and humidity monitor
Methodology:
- Environmental Stabilization: Conduct the assay in a controlled environment (e.g., 20-25°C, 45-60% RH). Allow pipette, tips, and liquid to equilibrate for ≥2 hours.
- Balance Preparation: Tare the weighing vessel on the analytical balance.
- Gravimetric Dispensing: Using the pipette set to the target volume (e.g., 100 µL for plate coating), dispense the liquid into the tared vessel. Record the mass.
- Replication: Repeat for n=10 replicates. Use a fresh tip for each dispense.
- Data Calculation:
- Actual Volume (µL) = Measured Mass (mg) / Density of Liquid (mg/µL). For water at 20°C, density ~0.9982 mg/µL.
- Calculate mean, standard deviation (SD), and CV%.
- Accuracy (%) = [(Mean Actual Volume - Set Volume) / Set Volume] x 100.
- Compare results to ISO 8655 or manufacturer specifications.
Optimized Workflow for ELISA Coating Dispense
Diagram 1: Precision Pipetting Workflow for ELISA Coating
The Scientist's Toolkit: Essential Reagents & Materials
Table 2: Key Research Reagent Solutions for Precision Pipetting & Coating
| Item | Function in Aliquot/Dispense & Coating | Critical Specification |
|---|---|---|
| High-Precision Air-Displacement Pipette | Accurate aspiration and dispensing of coating solutions. | Regular calibration; appropriate volume range (e.g., 10-100 µL for coating). |
| Low-Binding, Filtered Pipette Tips | Minimizes aerosol contamination and liquid retention on tip wall. | Polymer (e.g., polypropylene) with low protein binding. |
| Carbonate-Bicarbonate Coating Buffer (pH 9.6) | Common high-pH buffer for passive adsorption of proteins/antigens to polystyrene plates. | Freshly prepared, pH verified, sterile filtered. |
| Pipette Calibration Weights & Balance | For in-lab verification of pipette accuracy and precision. | Certified weights; balance with appropriate sensitivity. |
| Microplate Sealing Tape | Prevents evaporation and contamination during the coating incubation. | Low-fluorescence, adhesive seal. |
Impact of Pipetting Precision on Downstream ELISA Steps
Inconsistent coating directly affects subsequent blocking, sample addition, and detection. Non-uniform coating creates a variable foundation, amplifying noise and reducing the assay's sensitivity and dynamic range.
Diagram 2: Pipetting Precision Impact on ELISA Data Quality
Mastering precision pipetting in the aliquot and dispense step is non-negotiable for robust ELISA plate coating procedure research. By understanding error sources, implementing rigorous validation protocols, and utilizing the appropriate toolkit, researchers can ensure that this foundational step reinforces, rather than undermines, the integrity of their entire assay.
Within the broader thesis on optimizing enzyme-linked immunosorbent assay (ELISA) plate coating procedures, the incubation step is a critical determinant of assay performance. This phase, where the capture molecule adsorbs to the solid polystyrene phase, is governed by the precise interplay of time, temperature, and humidity. Suboptimal control of these parameters leads to inconsistent coating density, high well-to-well variability, and reduced assay sensitivity, ultimately compromising drug development and diagnostic research. This technical guide details the scientific principles and protocols for mastering incubation conditions.
Core Physical Principles and Quantitative Data
Protein adsorption to plastic is a complex, dynamic process influenced by:
- Diffusion: The rate at which molecules in solution reach the surface.
- Adsorption Kinetics: The non-covalent binding of molecules to the polystyrene surface (hydrophobic interactions, van der Waals forces).
- Surface Saturation: The point at which all available binding sites are occupied.
The following table summarizes the quantitative impact of incubation variables, compiled from current literature.
Table 1: Impact of Incubation Parameters on Coating Efficiency
| Parameter | Typical Range | Effect on Coating | Key Mechanism | Consequence of Deviation |
|---|---|---|---|---|
| Time | 1-24 hours (O/N common) | Increases density until plateau. | Kinetics of adsorption and surface saturation. | Short: Low signal. Long: Potential protein denaturation, wasted time. |
| Temperature | 4°C (cold) or 37°C (warm) | Higher temp increases initial rate; cold may preserve activity. | Molecular kinetic energy and protein conformational stability. | Too high: Denaturation, loss of epitopes. Too low: Slow, incomplete coating. |
| Humidity | >80% RH (sealed chamber) | Prevents evaporation of coating buffer. | Maintains consistent solute concentration and ionic strength. | Low: Edge effects, high CV%, inconsistent binding. |
Table 2: Recommended Protocols by Coating Molecule Type
| Coating Molecule | Recommended Buffer | Incubation Time | Incubation Temperature | Supporting Rationale |
|---|---|---|---|---|
| Antibodies (IgG) | 0.05M Carbonate-Bicarbonate, pH 9.6 | Overnight (12-16 hrs) | 4°C | High pH favors orientation; cold preserves activity. |
| Proteins (e.g., BSA, Avidin) | 0.01M PBS, pH 7.4 | 2 hours at 37°C or O/N at 4°C | 37°C or 4°C | Faster process; 37°C accelerates for high-throughput. |
| Small Peptides | 0.01M PBS, pH 7.4 | Overnight (16-24 hrs) | 4°C | Lower binding efficiency requires prolonged contact. |
| Streptavidin | 0.01M PBS, pH 7.4 | 1 hour | 37°C | Robust protein with high binding affinity for biotin. |
Detailed Experimental Protocols
Protocol: Optimization of Incubation Time and Temperature
Objective: To determine the optimal time-temperature combination for maximal specific signal with minimal background for a specific capture antibody. Materials: See "The Scientist's Toolkit" (Section 6). Procedure:
- Prepare coating buffer (Carbonate-Bicarbonate, pH 9.6).
- Dilute the capture antibody to a standard concentration (e.g., 2 µg/mL) in coating buffer.
- Dispense 100 µL per well into a 96-well microplate. Include buffer-only wells for background measurement.
- Set up incubation conditions in a matrix:
- Temperatures: 4°C, 25°C (room temperature), 37°C.
- Times: 1h, 2h, 4h, overnight (~16h).
- For each condition, incubate plates in a humidity-controlled environment (sealed box with wet paper towels or regulated incubator).
- After incubation, wash plate 3x with PBS-T (PBS + 0.05% Tween-20).
- Block with 200 µL/well of blocking buffer (e.g., 3% BSA in PBS) for 1-2 hours at RT.
- Proceed with standard ELISA steps (antigen addition, detection antibody, enzyme conjugate, substrate).
- Terminate reaction and read absorbance. Plot signal-to-noise (S/N) ratio for each condition.
Protocol: Assessing Evaporation and Edge Effects
Objective: To quantify the impact of uncontrolled humidity during incubation. Procedure:
- Coat two identical plates with the same antibody solution as in 3.1.
- Plate A: Incubate overnight at 4°C in a sealed, humidified container.
- Plate B: Incubate overnight at 4°C on an open lab bench.
- Complete the ELISA as per standard protocol.
- Compare the absorbance values from edge wells (A1, A12, H1, H12) to interior wells (C5, C6, F5, F6) for both plates. Calculate the coefficient of variation (%CV) for each plate.
Visualizing the Optimization Workflow and Key Interactions
Diagram Title: ELISA Coating Incubation Optimization Workflow
Diagram Title: Core Parameter Interactions in Coating Incubation
The Scientist's Toolkit: Essential Materials
Table 3: Key Research Reagent Solutions for Coating Incubation
| Item | Function & Importance |
|---|---|
| Carbonate-Bicarbonate Buffer (pH 9.6) | Standard alkaline coating buffer that enhances passive adsorption of many proteins (especially antibodies) to polystyrene. |
| PBS (Phosphate Buffered Saline), pH 7.4 | Neutral buffer for coating proteins sensitive to alkaline conditions or for certain capture ligands. |
| High-Binding Polystyrene Microplates | 96-well plates engineered for optimal protein adsorption, forming the solid phase of the ELISA. |
| Adhesive Plate Sealers or Lid Sets | Essential for maintaining humidity and preventing contamination and evaporation during incubation. |
| Humidity Chambers (Sealed boxes with wet towels) | Low-cost method to maintain >80% relative humidity, crucial for uniform coating across the plate. |
| Precision Temperature Incubators (4°C, 37°C) | Provide stable, controlled thermal environments for reproducible kinetic outcomes. |
| Non-ionic Detergent (e.g., Tween-20) | Added to wash buffers (PBS-T) to remove non-specifically bound molecules after coating. |
| Blocking Agents (BSA, Casein, Skim Milk) | Proteins used after coating to saturate remaining binding sites and prevent nonspecific signal later. |
| Multichannel Pipettes & Reagent Reservoirs | Enable rapid, uniform dispensing of coating solutions across the plate, reducing timing errors. |
| Microplate Washer (or Manual Washer Manifold) | Critical for consistent and thorough washing steps post-incubation to remove unbound reagent. |
Within the broader thesis on ELISA plate coating procedure optimization, the wash step following the initial protein adsorption is a critical determinant of assay performance. This step is not merely a passive rinsing procedure; it is a dynamic process that defines the homogeneity, specificity, and reproducibility of the coated surface. Ineffective washing leaves a heterogeneous layer of unbound or loosely adsorbed protein, leading to high background noise, reduced antigen-binding capacity, and increased inter-well variability. This technical guide delves into the physicochemical principles, quantitative benchmarks, and optimized protocols for achieving effective removal of unbound protein, thereby establishing a robust foundation for subsequent assay steps.
Physicochemical Principles of Protein Removal
The efficiency of unbound protein removal is governed by the interplay of adhesive and removal forces. Adsorbed proteins interact with the plastic surface via hydrophobic interactions, van der Waals forces, and electrostatic attractions. The wash buffer must overcome these forces for loosely bound molecules while preserving the desired, tightly bound coating layer.
Key Factors:
- Shear Force: The mechanical force generated by buffer flow that dislodges proteins. It is a function of wash buffer viscosity, dispense velocity, and impact angle.
- Interfacial Competition: Detergents (e.g., Tween-20) competitively adsorb to the surface and protein, disrupting protein-surface and protein-protein interactions.
- Ionic Strength: Buffers with appropriate ionic strength can shield electrostatic attractions, facilitating the release of proteins bound primarily through ionic interactions.
- Contact Time: The duration the wash buffer is in contact with the well influences the equilibration and elution process.
Quantitative Impact of Washing Efficacy
The consequences of suboptimal washing are quantifiable across key assay parameters. The following table summarizes experimental data from recent studies investigating wash stringency on assay performance.
Table 1: Impact of Wash Stringency on Coating Efficacy and Assay Performance
| Parameter | Insufficient Wash (Low Stringency) | Optimal Wash | Overly Stringent Wash | Measurement Method |
|---|---|---|---|---|
| Residual Unbound Protein | High (≥15% of input) | Low (≤5% of input) | Very Low (≤2% of input) | Fluorescently-tagged protein, post-wash supernatant assay |
| Coating Uniformity (CV%) | >15% | <10% | <10% | Atomic Force Microscopy (AFM), ELISA signal across plate |
| Non-Specific Binding (Background) | High (OD450 > 0.5) | Low (OD450 < 0.2) | Low (OD450 < 0.2) | Assay with no-primary antibody control |
| Specific Signal Intensity | Variable, often reduced | High, maximized | Potentially reduced | Positive control OD450 |
| Inter-Well Reproducibility | Poor (CV% > 20%) | Excellent (CV% < 10%) | Good (CV% < 12%) | Statistical analysis of replicate wells |
Experimental Protocols for Wash Optimization
Protocol A: Standardized Wash Buffer Formulation and Validation
Objective: To prepare and validate a standard wash buffer for effective removal of unbound coating protein while maintaining coated layer stability.
Materials:
- Phosphate Buffered Saline (PBS), 10X concentrate
- Polysorbate 20 (Tween-20)
- Deionized water
- pH meter
- Sterile filtration unit (0.22 µm)
Methodology:
- Aseptically prepare 1X PBS by diluting 100 mL of 10X PBS into 900 mL deionized water.
- Add 500 µL of Tween-20 per liter of 1X PBS to achieve a final concentration of 0.05% (v/v).
- Stir gently to ensure complete mixing without foaming.
- Adjust pH to 7.4 ± 0.1 if necessary.
- Sterile-filter the buffer and store at 4°C for up to 1 month.
- Validation: Coat a plate with a fluorescent protein (e.g., FITC-BSA). After coating, wash wells with the prepared buffer using a defined method (e.g., 3x350 µL aspiratory-dispense cycles). Measure fluorescence of the wash supernatant and the well post-wash to calculate the percentage of unbound protein removed.
Protocol B: Comparative Analysis of Manual vs. Automated Washing
Objective: To quantitatively compare the efficacy and reproducibility of manual plate washing versus automated microplate washer.
Materials:
- Coated ELISA plate (post-protein incubation)
- Validated wash buffer (from Protocol A)
- Multichannel pipette and reservoir (manual)
- Automated microplate washer (e.g., BioTek 405 TS)
- Fluorescence plate reader
Methodology:
- Sample Preparation: Split a single coated plate (using a consistent protein) into two sections.
- Manual Wash: For section one, use a multichannel pipette to fill each well with 350 µL wash buffer. Let stand for 30 seconds. Invert plate sharply over a sink, blotting on clean paper towels. Repeat for 3 cycles.
- Automated Wash: For section two, program the automated washer for 3 cycles with a fill volume of 350 µL, a soak time of 5 seconds, and high aspiration strength.
- Quantification: After the final wash for both methods, immediately add a non-ionic buffer to all wells. Use a fluorescence plate reader to measure residual background signal from any loosely bound protein. Calculate the coefficient of variation (CV%) across wells for each method.
The Scientist's Toolkit: Research Reagent Solutions
Table 2: Essential Materials for Effective Wash Steps
| Item | Function & Rationale |
|---|---|
| Polysorbate 20 (Tween-20) | Non-ionic detergent that competitively binds to hydrophobic sites, reducing non-specific protein adsorption and facilitating removal of unbound molecules. |
| Phosphate Buffered Saline (PBS) | Isotonic buffer maintains physiological pH and ionic strength, preventing denaturation of the coated protein while disrupting weak ionic bonds. |
| Automated Microplate Washer | Provides consistent, reproducible shear force and volume across all wells, drastically reducing inter-well variability compared to manual methods. |
| Wash Buffer Reservoir | For manual washing, ensures consistent buffer composition and volume delivery across all wells during the wash process. |
| Plate Sealers / Foils | Used to cover plates during shake incubation steps preceding washing, preventing evaporation and concentration changes at the well edges. |
| Blotting Paper / Absorbent Pads | Used after manual inversion to remove residual droplets from well openings, preventing carryover and droplet-derived striping. |
Visualizing the Wash Optimization Workflow & Impact
Diagram 1: Wash Step Optimization Decision Pathway
Diagram 2: Consequences of Wash Efficacy on Coated Surface
This guide constitutes the fourth core chapter of a comprehensive thesis on the optimization of ELISA plate coating procedures. Following plate selection (Step 1), cleaning (Step 2), and antigen/antibody immobilization (Step 3), blocking is the critical step that determines the ultimate signal-to-noise ratio of the assay. Effective blocking minimizes non-specific binding (NSB) of detection reagents to the solid phase, thereby reducing background and enhancing assay sensitivity, precision, and dynamic range.
Principles of Non-Specific Binding and Blocking Mechanisms
Non-specific binding arises from hydrophobic, ionic, and/or Van der Waals interactions between assay components (e.g., detection antibodies, streptavidin-enzyme conjugates) and unoccupied sites on the plate surface or to the immobilized capture molecule itself. Blocking agents are inert proteins or molecules that adsorb to these remaining surfaces, creating a passive layer that prevents subsequent reagent adsorption.
Primary Mechanisms of Action
- Protein-Based Blockers: (e.g., BSA, Casein, Serum) Physically occupy binding sites and can provide a hydrophilic layer. Some may also share serum components with sample diluents to minimize interference.
- Polymer-Based Blockers: (e.g., PVP, PEG, Synblock) Create a steric and hydrophilic barrier via long-chain molecules.
- Detergent-Based Blockers: (e.g., Tween 20) Added to blocking and washing buffers to reduce hydrophobic interactions and disrupt protein aggregates.
Comparative Analysis of Common Blocking Reagents
The choice of blocking agent is dependent on the assay system, the immobilized protein, and the detection conjugate. The table below summarizes key characteristics and performance data.
Table 1: Properties and Performance of Common Blocking Buffers
| Blocking Reagent | Typical Concentration | Key Mechanism | Advantages | Disadvantages (Potential NSB Sources) | Optimal For |
|---|---|---|---|---|---|
| BSA (Bovine Serum Albumin) | 1-5% (w/v) | Hydrophilic adsorption, charge masking. | Inexpensive, widely used, stable. | May contain bovine IgGs, fatty acids, or proteases; can bind lectins. | General use, phospho-specific assays. |
| Casein / Milk Protein | 1-5% (w/v) | Heterogeneous protein mix, physical coverage. | Very low cost, effective for many antibodies. | Contains biotin, phosphatases, and immunoglobulins; prone to bacterial growth. | Routine immunoassays (non-biotin, non-phospho). |
| Fish Skin Gelatin | 0.1-1% (w/v) | Low molecular weight protein coverage. | Low background, mammalian protein-free. | Less robust blocking for some high-sensitivity assays. | Assays sensitive to mammalian contaminants. |
| Serum (e.g., FBS, Goat) | 1-10% (v/v) | Mimics sample matrix, complex coverage. | Excellent for reducing matrix effects. | Highly variable, contains target analytes, immunoglobulins. | Competitive ELISAs, reducing sample matrix interference. |
| Polyvinylpyrrolidone (PVP) | 1-2% (w/v) | Hydrophilic polymer steric hindrance. | Synthetic, defined, no biological contaminants. | May be less effective alone; often combined with proteins. | Hybrid methods, custom formulations. |
| Commercial Synthetic Blockers (e.g., Synblock, BlockACE) | As per manufacturer | Proprietary polymer/protein mixes. | Defined, consistent, often biotin/phosphate free. | Higher cost. | High-sensitivity, biotin-streptavidin, or phospho-protein assays. |
Table 2: Impact of Blocking Buffer Additives on NSB Reduction
| Additive | Typical Concentration | Primary Function | Effect on Background Signal (Typical Reduction) |
|---|---|---|---|
| Tween 20 | 0.05 - 0.1% (v/v) | Non-ionic detergent | Reduces hydrophobic binding (15-30% reduction). |
| Triton X-100 | 0.1 - 0.25% (v/v) | Non-ionic detergent | Stronger solubilization of aggregates (Potential for protein denaturation). |
| EDTA | 1-5 mM | Chelating agent | Inhibits metalloproteases, reduces metal-dependent binding. |
| Sonicated Salmon Sperm DNA | 10-100 µg/mL | Anionic polymer | Blocks positively charged surfaces, reduces DNA-protein binding. |
| Protease Inhibitors (cocktail) | 1X | Enzyme inhibition | Prevents degradation of immobilized target/proteins. |
Experimental Protocols for Blocking Optimization
Protocol 4.1: Standard Blocking and Post-Coating Plate Treatment
Objective: To block a coated 96-well ELISA plate efficiently. Materials: Coated plate, blocking buffer (e.g., 3% BSA in PBS), sealing tape, microplate shaker. Procedure:
- After coating and washing (Step 3), invert the plate and blot firmly on clean paper towels.
- Add 200-300 µL of blocking buffer to each well. Ensure complete well coverage.
- Seal the plate with adhesive tape to prevent evaporation.
- Incubate at room temperature (20-25°C) for 1-2 hours with gentle agitation (≈300 rpm) on a microplate shaker. For higher stringency, incubate overnight at 4°C.
- Decant the blocking solution. The plate can be used immediately in the assay or stored. For storage, wash plate once with wash buffer (e.g., PBS + 0.05% Tween 20), blot dry, seal in a plastic bag with desiccant, and store at 4°C for short-term (1 week) or -20°C for long-term.
Protocol 4.2: Comparative Screening of Blocking Buffers
Objective: Empirically determine the optimal blocking buffer for a specific assay. Materials: Antigen-coated plates, 5-6 candidate blocking buffers (e.g., 1% BSA, 3% BSA, 2% Casein, 5% Milk, Commercial Blocker, 1% Gelatin), assay diluent, detection antibodies, substrate, plate reader. Procedure:
- Divide a single batch of coated plates into treatment groups (n=6 wells per blocker).
- Block each group with a different candidate buffer as per Protocol 4.1.
- Proceed with the standardized assay protocol (sample/detection antibody addition, washes, substrate development).
- Measure the absorbance of all wells. For each blocking buffer, calculate:
- Mean Background Signal: Average signal from wells receiving no primary antibody (or zero analyte).
- Mean Positive Signal: Average signal from wells with a mid-range positive control.
- Signal-to-Noise Ratio (S/N): (Mean Positive Signal) / (Mean Background Signal).
- Select the buffer yielding the highest S/N ratio and the lowest absolute background.
Protocol 4.3: Blocking Time and Temperature Kinetic Study
Objective: To define the minimum effective blocking time. Materials: Coated plates, chosen blocking buffer, timer. Procedure:
- Block separate plate sets (n=4 wells per time point) for the following durations: 15 min, 30 min, 60 min, 120 min, 240 min, and overnight (16 hrs). Perform all incubations at room temperature with agitation.
- Run the complete assay protocol on all plates in parallel.
- Plot Background Signal (y-axis) vs. Blocking Time (x-axis). The optimal time is at the plateau where extended blocking yields no significant further reduction in background.
The Scientist's Toolkit: Research Reagent Solutions
Table 3: Essential Materials for Blocking Optimization
| Item | Function & Rationale |
|---|---|
| Molecular Biology Grade BSA (Protease/IgG-free) | High-purity blocking protein; minimizes interference from contaminants. |
| Casein, Sodium Salt (Hammersten Grade) | Highly purified casein; low in salts and carbohydrates for consistent performance. |
| Polyoxyethylene (20) Sorbitan Monolaurate (Tween 20) | Non-ionic detergent for blocking and wash buffers; disrupts hydrophobic interactions. |
| Phosphate-Buffered Saline (PBS), 10X Concentrate | Standard isotonic buffer for preparing blocking and coating solutions. |
| Non-Fat Dry Milk (Blotting Grade) | Cost-effective blocking agent for routine assays; must be screened for biotin/phosphate content. |
| Commercial Chemically Defined Blocker (e.g., Protein-Free (PBS) Blocking Buffer) | Synthetic, animal-free blocker for applications requiring minimal background and no protein interference. |
| 96-Well Microplate Sealers (Adhesive & Thermal) | Prevents evaporation and contamination during blocking and incubation steps. |
| Microplate Shaker (with temperature control) | Ensures uniform reagent distribution and consistent binding kinetics during blocking. |
Visualizing Blocking Strategy Decision Pathways
Diagram Title: Blocking Buffer Selection Decision Tree
Diagram Title: Blocking Mechanism Preventing Non-Specific Antibody Binding
Within the broader thesis on ELISA plate coating procedure optimization, the storage of pre-coated plates represents a critical, yet often underexplored, determinant of assay robustness and long-term reproducibility. This technical guide synthesizes current research to detail best practices for sealing, drying, and stabilizing coated plates, with a focus on preserving antigen/antibody functionality for drug development applications.
The transition from a freshly coated microplate to a stored, ready-to-use assay component introduces variables that can significantly impact key immunoassay parameters such as sensitivity, dynamic range, and background noise. Systematic investigation of storage conditions is therefore integral to the development of reliable, high-throughput workflows in pharmaceutical research.
Sealing Methods and Impermeability
A primary defense against degradation during storage is an effective seal. The choice of sealing method balances practicality with performance.
Table 1: Comparative Analysis of Microplate Sealing Methods
| Sealing Method | Water Vapor Transmission Rate (WVTR)* (g/m²/day) | Ease of Removal | Re-sealable | Typical Use Case |
|---|---|---|---|---|
| Adhesive Aluminum Foil | <0.01 | Difficult | No | Long-term storage (>6 months) |
| Adhesive Polyester Film | 0.5 - 2.0 | Easy | No | Medium-term storage (1-6 months) |
| Silicone-Covered Rubber Mats | ~1.5 | Very Easy | Yes | Short-term storage, frequent access |
| Heat-Sealing Film | <0.05 | Difficult | No | Long-term storage, automated systems |
| Plate Storage Bag with Desiccant | Variable | Easy | Yes | Added layer of protection, any duration |
*Data compiled from manufacturer specifications and independent permeability studies.
Protocol 2.1: Evaluating Seal Integrity
- Objective: To empirically test the seal's effectiveness in preventing evaporation and contamination.
- Materials: Coated plates, test seals, precision balance (0.1 mg sensitivity), dry incubator.
- Method:
- Pre-equilibrate plates and seals to ambient temperature.
- Add a standard volume (e.g., 100 µL) of PBS to all wells of a plate.
- Apply the test seal according to manufacturer instructions.
- Weigh the entire plate immediately (Time 0) and record mass.
- Store the plate under accelerated conditions (e.g., 37°C) for 7 days.
- Re-weigh the plate and calculate the percent mass loss per well.
- Analysis: A mass loss of >5% typically indicates insufficient barrier properties for long-term storage.
Drying Protocols and Stabilization
The decision to store plates wet or dry is fundamental. Drying can enhance long-term stability but risks damaging the coated biomolecule.
Table 2: Impact of Drying Conditions on Coated Antibody Stability
| Drying Condition | Residual Moisture | Reported % Activity Retention (12 months, 4°C)* | Key Risk Factor |
|---|---|---|---|
| Vacuum Desiccation (Slow) | <1% | 85-95% | Protein denaturation at air-liquid interface |
| Air Drying, Ambient | ~5-10% | 60-75% | Oxidation, microbial growth |
| Lyophilization with Trehalose | <1% | 90-98% | Complex process, requires optimization |
| Wet Storage (Sealed with Buffer) | 100% | 70-85% | Hydrolysis, microbial growth, leaching |
*Activity retention is highly dependent on the specific protein and coating buffer. Representative ranges from recent studies.
Protocol 3.1: Optimization of a Protective Drying Matrix
- Objective: To identify a stabilizing excipient for drying coated plates.
- Materials: Coated plates, excipient solutions (e.g., 1% BSA, 5% Trehalose, 5% Sucrose in DI water), multichannel pipette.
- Method:
- After coating and washing, do not perform the final blocking step.
- Add 50 µL of each candidate excipient solution to designated plate rows. Use PBS as a negative control.
- Incubate for 1 hour at room temperature on a plate shaker.
- Aspirate the liquid and dry the plates under controlled vacuum desiccation for 18 hours.
- Seal plates with aluminum foil and store at 4°C and 37°C (accelerated stability).
- At timepoints (0, 1, 3, 6 months), rehydrate with assay buffer, perform standard blocking and assay procedures against a freshly coated standard curve.
- Analysis: Compare EC50 and signal-to-background ratios of stored plates to the fresh standard to calculate percent activity retention.
Long-Term Stability Assessment
Stability must be defined by functional performance, not just physical appearance.
Table 3: Accelerated Stability Testing Correlations
| Storage Condition (Accelerated) | Equivalent Real-Time Storage (Est.)* | Key Parameters Monitored |
|---|---|---|
| 37°C, 60% RH, 1 month | 4°C, 6-12 months | EC50 shift, Max Signal loss, Background increase |
| 45°C, dry, 2 weeks | 4°C, 6 months | Assessment of thermal denaturation pathways |
| 25°C, 75% RH, 3 months | 4°C, 12-24 months | Assessment of hydrolysis and oxidation |
*Correlations are empirical and protein-specific; they must be validated for each coating.
Diagram Title: Stability Testing Workflow and Degradation Pathways
The Scientist's Toolkit: Research Reagent Solutions
Table 4: Essential Materials for Coated Plate Storage Research
| Item | Function & Rationale |
|---|---|
| Adhesive Aluminum Seal | Provides a near-hermetic seal with minimal water vapor transmission for long-term storage. |
| Microplate Storage Bag with Zip Closure | Offers a secondary, scalable environment; includes desiccant pouch to control humidity. |
| Dessicant (Silica Gel) | Controls relative humidity within the storage container, preventing hydrolysis. |
| Oxygen Scavenger Sachets | Mitigates oxidation damage to coated proteins during storage. |
| Trehalose (Dihydrate) | A non-reducing disaccharide that forms a stable glassy matrix, protecting proteins during drying. |
| BSA (Fraction V) | Used in blocking and as a stabilizing excipient to occupy nonspecific sites and prevent surface denaturation. |
| Vacuum Desiccator | Enables controlled, low-humidity drying of plates post-coating to minimize drying stress. |
| Humidity & Temperature Data Logger | For continuous monitoring of the actual storage environment inside incubators or refrigerators. |
| Precision Balance (0.1 mg) | Critical for performing seal integrity tests via gravimetric analysis of evaporation. |
Integrating a scientifically rigorous approach to the sealing, drying, and storage of coated ELISA plates is a non-negotiable component of robust assay development. By treating the coated plate as a finished reagent with defined stability criteria, researchers can ensure data consistency, reduce waste, and enhance the reliability of critical assays in drug discovery and diagnostics. This chapter establishes a framework for validating storage protocols within the overarching thesis on coating optimization.
ELISA Coating Troubleshooting: Solving Common Problems and Optimization Strategies
Within the broader thesis on systematic ELISA plate coating procedure research, this guide addresses a critical, often empirical optimization step. The sensitivity and performance of a sandwich ELISA are fundamentally dictated by the initial capture antibody immobilization phase. Suboptimal coating concentration or an incompatible buffer pH leads to poor antigen capture capacity, resulting in weak signal, high background, and unreliable data. This document provides a data-driven, methodological framework for diagnosing and resolving these issues.
Core Principles of Coating Optimization
The Role of Coating Concentration
Immobilizing too little capture antibody results in insufficient antigen-binding sites, limiting assay sensitivity. Excess antibody can lead to steric hindrance, antibody denaturation due to overcrowding, and increased non-specific binding, raising background.
The Critical Influence of pH
The isoelectric point (pI) of the capture antibody determines the optimal coating buffer pH. A pH at or near the pI promotes hydrophobic interactions with the polystyrene plate, maximizing adsorption and creating a stable, correctly oriented monolayer. An incorrect pH can lead to inconsistent or weak adsorption.
Experimental Protocols for Systematic Optimization
Protocol A: Coating Concentration Titration
Objective: To determine the saturating yet non-hindering concentration of the capture antibody. Materials: See "Scientist's Toolkit" below. Procedure:
- Prepare a 2x serial dilution of the capture antibody in a standard coating buffer (e.g., 0.05 M Carbonate-Bicarbonate, pH 9.6). A suggested starting range is 0.5 to 20 µg/mL.
- Dispense 100 µL/well of each dilution across a 96-well microplate. Include wells with coating buffer only as blank controls.
- Seal the plate and incubate overnight at 4°C.
- Wash the plate 3x with 300 µL/well of PBS-T (0.05% Tween-20).
- Immediately block with 200 µL/well of a suitable blocking buffer (e.g., 1% BSA or 5% non-fat dry milk in PBS) for 1-2 hours at room temperature.
- Proceed with the standard ELISA protocol (antigen addition, detection antibody, enzyme conjugate, substrate).
- Plot the Mean Absorbance (OD) against the coating antibody concentration. The optimal concentration is typically at the inflection point just before the plateau, where signal increase per unit of antibody begins to diminish.
Protocol B: Coating Buffer pH Screen
Objective: To identify the optimal pH for maximal and stable antibody adsorption. Procedure:
- Prepare a series of 0.1 M coating buffers across a pH range:
- pH 4.0 – 0.1 M Sodium Acetate
- pH 5.0 – 0.1 M Sodium Acetate
- pH 7.0 – 0.1 M Sodium Phosphate
- pH 8.0 – 0.1 M Tris-HCl
- pH 9.6 – 0.05 M Carbonate-Bicarbonate
- Prepare a fixed, mid-range concentration of capture antibody (e.g., 2 µg/mL) in each buffer.
- Coat the plate, incubate, wash, and block as in Protocol A.
- Run the ELISA using a single, medium concentration of target antigen.
- Plot the Mean Absorbance (OD) against the coating buffer pH. The pH yielding the highest specific signal (Signal - Background) is optimal.
Data Presentation
Table 1: Representative Data from Coating Concentration Titration
| Coating Antibody Conc. (µg/mL) | Mean OD (450 nm) | Background (OD) | Signal-to-Background Ratio |
|---|---|---|---|
| 0 (Blank) | 0.051 | - | - |
| 0.5 | 0.210 | 0.159 | 4.1 |
| 1.0 | 0.580 | 0.529 | 11.4 |
| 2.0 | 1.250 | 1.199 | 24.5 |
| 5.0 | 1.480 | 1.429 | 29.0 |
| 10.0 | 1.520 | 1.469 | 29.8 |
| 20.0 | 1.510 | 1.459 | 28.6 |
Conclusion: The optimal concentration for this antibody is ~2-5 µg/mL, offering a high signal with efficient reagent use.
Table 2: Representative Data from Coating pH Screen (Antibody at 2 µg/mL)
| Coating Buffer pH | Buffer System | Mean OD (Antigen +) | Mean OD (Antigen -) | Specific Signal (ΔOD) |
|---|---|---|---|---|
| 4.0 | Sodium Acetate | 0.310 | 0.105 | 0.205 |
| 5.0 | Sodium Acetate | 0.850 | 0.095 | 0.755 |
| 7.0 | Sodium Phosphate | 1.150 | 0.085 | 1.065 |
| 8.0 | Tris-HCl | 1.420 | 0.080 | 1.340 |
| 9.6 | Carbonate-Bicarbonate | 1.610 | 0.075 | 1.535 |
Conclusion: pH 9.6 provides the highest specific signal for this antibody, suggesting its pI is likely >9.
Visualization of Experimental Workflows
Title: ELISA Coating Optimization Diagnostic Workflow
Title: Effect of Coating pH on Antibody Immobilization
The Scientist's Toolkit
Table 3: Essential Research Reagent Solutions for Coating Optimization
| Item | Function & Importance |
|---|---|
| High-Binding Polystyrene Microplates | Standard 96-well plates with treated surface for passive, high-capacity adsorption of proteins. |
| Capture Antibody (Purified, Carrier-Free) | The critical reagent to be immobilized. Must be in a low-salt, non-stabilized buffer (e.g., PBS) for reliable pH adjustment. |
| Carbonate-Bicarbonate Buffer (pH 9.6) | The most common alkaline coating buffer, effective for many antibodies (pI ~8-9.5). |
| Alternative pH Buffer Set (Acetate, Phosphate, Tris) | Allows systematic screening across a physiologically relevant pH range (4.0-9.6). |
| Blocking Agent (BSA, Casein, non-fat dry milk) | Saturates remaining protein-binding sites on the plate to minimize non-specific adsorption in subsequent steps. |
| Wash Buffer (PBS with 0.05% Tween-20) | Removes unbound reagents. Consistent washing is critical for reproducibility. |
| Positive Control Antigen | A known concentration of the target analyte is required to generate the signal for optimization. |
| Plate Reader (Absorbance, 450 nm) | For quantitative endpoint measurement of the enzymatic colorimetric reaction (e.g., using TMB substrate). |
Within the broader thesis investigating ELISA plate coating procedure optimization, this technical guide addresses a critical downstream challenge: high background signal. Non-specific binding compromises assay sensitivity and data fidelity. This whitepaper provides an in-depth analysis of two pivotal interdependent variables—blocking agent selection and incubation time—offering researchers evidence-based protocols for systematic optimization.
High background in ELISA arises primarily from the non-specific adsorption of detection antibodies or conjugated enzymes to the plate surface or capture antibodies. Effective blocking, the process of saturating unoccupied protein-binding sites after coating, is paramount. The efficacy of blocking is a direct function of the agent's biochemical properties and the kinetic parameter of incubation time.
Core Principles of Blocking
The ideal blocking agent binds rapidly and stably to all remaining hydrophobic sites on the polystyrene plate, is inert to the assay components, and does not displace the coated antigen. Common agents include proteins (e.g., BSA, casein, non-fat dry milk) and synthetic polymers (e.g., polyvinyl alcohol, PVP).
Quantitative Comparison of Blocking Agents
Recent studies (2023-2024) systematically evaluate blocking performance using signal-to-noise ratio (SNR) as the key metric.
Table 1: Performance Metrics of Common Blocking Agents (Comparative Data)
| Blocking Agent | Typical Concentration | Optimal Temp | Incubation Time Range (Min) | Key Advantages | Key Limitations | Relative SNR* (vs. BSA) |
|---|---|---|---|---|---|---|
| BSA (IgG-Free) | 1-5% w/v | 20-25°C | 60-120 | Low interference, consistent, minimal cross-reactivity | Costly for large-scale screens | 1.00 (Baseline) |
| Casein | 1-3% w/v | 20-25°C | 60-180 | Excellent for alkaline phosphatase systems, low background | Can form aggregates, variable lots | 1.15 - 1.30 |
| Non-Fat Dry Milk | 2-5% w/v | 20-25°C | 30-90 | Inexpensive, effective for many applications | Contains biotin & phosphatases, not for streptavidin/AP systems | 0.90 - 1.10 |
| Fish Skin Gelatin | 0.5-2% w/v | 20-25°C | 30-60 | Low mammalian protein cross-reactivity, clear solutions | Less robust for difficult antigens | 0.95 - 1.05 |
| PVP40 | 0.5-1% w/v | 20-25°C | 30-60 | Synthetic, no biological contaminants | May be less effective for highly hydrophobic targets | 0.80 - 0.95 |
*SNR compiled from recent publications; higher is better. Assumes optimization of time for each agent.
Experimental Protocol: Systematic Optimization
This protocol is designed to co-optimize blocking agent and incubation time within a thesis focusing on coating parameters.
Materials & Reagents (The Scientist's Toolkit)
Table 2: Essential Research Reagent Solutions
| Item | Function & Specification |
|---|---|
| Coated ELISA Plate | 96-well, high-binding polystyrene, pre-coated with target antigen/capture antibody per thesis coating protocol. |
| Blocking Buffer Stock Solutions | 5% BSA in PBS, 3% Casein in PBS (pH 7.4), 5% Non-Fat Dry Milk in PBS, 2% Fish Skin Gelatin in PBS, 1% PVP40 in PBS. All filtered (0.22 µm). |
| Assay Diluent | Matches chosen blocking buffer for sample/detection steps. |
| Detection System | Target-specific primary antibody, HRP- or AP-conjugated secondary antibody, corresponding chemiluminescent or colorimetric substrate. |
| Plate Washer & Reader | Automated microplate washer and a spectrophotometer or luminometer. |
Methodology: The Dual-Variable Optimization Experiment
Experimental Matrix Setup: Using identically coated plate batches from the thesis coating procedure, assign columns to different blocking agents (Table 1). Within each column, assign rows to different incubation times (e.g., 30, 60, 90, 120, 180 minutes).
Blocking Procedure:
- Aspirate coating solution from all wells.
- Add 200 µL of the assigned blocking buffer to each well according to the matrix.
- Incubate on a plate shaker (gentle agitation) at room temperature for the designated time.
- Wash plate 3x with 300 µL PBST (0.05% Tween-20).
Background & Signal Measurement:
- Background Wells: Add only assay diluent and proceed directly to detection (add conjugate, then substrate). No primary antibody is added.
- Positive Control Wells: Add a known concentration of analyte followed by the standard detection antibody sequence.
- Perform all incubations, washes, and signal development according to established assay conditions.
Data Analysis: Calculate the mean absorbance (or RLU) for background wells for each agent/time combination. Calculate the SNR (Positive Signal / Background) for each condition. The optimal condition maximizes SNR.
Data Interpretation and Decision Pathway
Optimal blocking is not universal; it is assay-specific. The flow diagram below outlines the decision logic for selecting and optimizing blocking based on assay components and results.
Diagram Title: Blocking Agent Selection & Optimization Logic Flow
Integrated Workflow from Coating to Blocking
The optimization of blocking is intrinsically linked to the preceding coating step defined in the broader thesis. The following workflow contextualizes this relationship.
Diagram Title: Integrated ELISA Coating and Blocking Workflow
Optimizing the blocking step is a decisive factor in mitigating high background, directly impacting the data quality generated from an optimized coating procedure. As demonstrated, a systematic, dual-variable approach testing agent chemistry and incubation kinetics is essential. This optimization must be integrated with and considered an extension of the plate coating parameters established in the broader thesis to develop a robust, reproducible ELISA protocol suitable for critical research and drug development applications.
Solving Edge Effects and Well-to-Well Variability
Within the broader thesis investigating the fundamental parameters of ELISA plate coating procedures, solving edge effects and well-to-well variability is paramount. These phenomena introduce systematic and random errors that compromise data integrity, reproducibility, and the sensitivity of immunoassays. Edge effects refer to the aberrant binding and reaction kinetics observed in the peripheral wells of a microplate, primarily due to differential evaporation and temperature gradients. Well-to-well variability encompasses random fluctuations in signal across all wells, stemming from inconsistencies in coating, washing, or sample distribution. This technical guide synthesizes current methodologies to identify, quantify, and mitigate these critical issues, ensuring robust and reliable assay performance.
The following tables summarize key quantitative findings from recent investigations into the sources and magnitude of variability.
Table 1: Impact of Physical Factors on Edge Effect Magnitude
| Factor | Experimental Condition | Signal CV at Plate Center | Signal CV at Plate Edge | Edge/Center Ratio | Reference Context |
|---|---|---|---|---|---|
| Evaporation | Unsealed plate, 37°C incubation | 8% | 35% | 1.45 | Coating antigen immobilization |
| Evaporation | Sealed with adhesive foil | 7% | 10% | 1.02 | Coating antigen immobilization |
| Incubation Time | 1 hour, ambient | 9% | 15% | 1.25 | Antibody binding step |
| Incubation Time | Overnight, 4°C | 6% | 8% | 1.08 | Antibody binding step |
| Plate Type | Standard polystyrene | 10% | 28% | 1.55 | Overall assay OD |
| Plate Type | Specialty "edge-effect" reduced | 8% | 12% | 1.05 | Overall assay OD |
Table 2: Efficacy of Mitigation Strategies on Well-to-Well CV
| Mitigation Strategy | Protocol Modification | Resultant Mean CV | Improvement vs. Baseline | Primary Impact |
|---|---|---|---|---|
| Baseline | Manual pipetting, standard washing | 18% | -- | -- |
| Automated Liquid Handling | Precision dispensing for coating & sample | 7% | 61% reduction | Well-to-well |
| Enhanced Sealing | Adhesive foil + humidified chamber | 9% | 50% reduction | Edge effect |
| Plate Washing | Automated washer (consistent pressure/aspiration) | 8% | 56% reduction | Well-to-well |
| Coating Buffer | Addition of 1% BSA as carrier protein | 10% | 44% reduction | Both |
| Plate Blocking | Extended blocking (2 hours) with protein-based blocker | 9% | 50% reduction | Both |
Experimental Protocols for Diagnosis and Mitigation
Protocol 1: Diagnostic Assay for Mapping Edge Effects
- Objective: To visually and quantitatively map evaporation-driven edge effects across a microplate.
- Materials: Clear flat-bottom 96-well plate, 0.1% (w/v) Aqueous Phenol Red solution, adhesive plate sealers, microplate reader capable of measuring 560 nm.
- Procedure:
- Using a calibrated multichannel pipette, dispense 200 µL of Phenol Red solution into all 96 wells.
- For the "unsealed" test plate, leave it uncovered. For the "sealed" control, apply a high-quality adhesive plate seal immediately.
- Incubate both plates in a 37°C dry incubator (no humidity control) for 60 minutes.
- Remove plates and allow to cool to room temperature for 10 minutes.
- Read the absorbance at 560 nm.
- Data Analysis: Plot absorbance values by well position (e.g., heat map). Calculate the mean and coefficient of variation (CV) for inner wells (e.g., columns 2-11, rows B-G) and outer wells. A higher mean absorbance and CV in outer wells of the unsealed plate indicates significant evaporation.
Protocol 2: Optimized Plate Coating Procedure to Minimize Variability
- Objective: To achieve uniform adsorption of coating antigen/antibody.
- Materials: High-binding 96-well microplate, coating antigen in carbonate-bicarbonate buffer (pH 9.6), plate sealer, humidified incubation chamber (or box with wet paper towels), precision pipettes or automated dispenser.
- Procedure:
- Preparation: Pre-warm coating buffer and samples to room temperature to prevent bubble formation.
- Dispensing: Using an automated liquid handler or a meticulously calibrated multichannel pipette, dispense the coating solution. Begin with the reagent in the reservoir well-mixed. When pipetting manually, use reverse pipetting technique for viscous solutions.
- Sealing: Immediately after dispensing, seal the plate with a low-evaporation, adhesive foil seal. Press firmly around all edges.
- Incubation: Place the sealed plate in a humidified container (a plastic box lined with damp paper towels suffices) to further minimize evaporation gradients. Incubate overnight at 4°C.
- Washing: Use an automated plate washer. Ensure consistent aspiration height and speed across all wells. Pat the plate dry on lint-free towels.
Visualizations
Edge Effect Causation Pathway
Optimized ELISA Coating Workflow
The Scientist's Toolkit: Key Research Reagent Solutions
| Item | Function/Benefit in Mitigating Variability |
|---|---|
| Low-Evaporation Adhesive Plate Sealers | Form a physical barrier to prevent differential evaporation, directly combating edge effects. Essential for long or warm incubations. |
| Automated Microplate Washer | Provides consistent and reproducible washing across all wells, eliminating a major source of well-to-well variability from manual processes. |
| Precision Liquid Handling System | Robotic or electronic pipetting systems minimize dispensing errors during coating, sample, and reagent addition, reducing random well-to-well error. |
| Humidified Incubation Chamber | Maintains a saturated atmosphere around the plate, further suppressing evaporation gradients even if seals are slightly imperfect. |
| "Edge Effect" or "High Uniformity" Coated Plates | Plates specifically engineered with modified well geometry or polymer treatments to promote even fluid distribution and reduce meniscus effects. |
| Carrier Proteins (BSA, Gelatin) | Added to coating buffer (e.g., at 0.1-1%) to saturate non-specific high-binding sites and promote more even distribution of the target coating molecule. |
| Protein-Based Blocking Buffers | Solutions like casein or BSA-based blockers (over non-protein alternatives) more effectively mask residual binding sites after coating, reducing background noise and its variability. |
Within the broader research on optimizing ELISA plate coating procedures, a significant challenge lies in the immobilization of difficult antigens—specifically peptides, lipids, and small molecules. Unlike large protein antigens, these entities often lack sufficient size, structural complexity, or chemical handles for direct, stable, and oriented adsorption to standard polystyrene plates. This whitepaper provides an in-depth technical guide to current methodologies for handling these difficult antigens, ensuring robust and reproducible assay development for researchers and drug development professionals.
Core Challenges and Coating Strategies
The primary challenge is the inefficient or denaturing adsorption of low-molecular-weight antigens to hydrophobic plate surfaces. The table below summarizes the core issues and strategic solutions for each antigen class.
Table 1: Challenges and Coating Strategies for Difficult Antigens
| Antigen Class | Typical Size Range | Core Challenge in Direct Coating | Recommended Coating Strategy | Key Advantage |
|---|---|---|---|---|
| Peptides | 0.5 - 10 kDa | Insufficient hydrophobic patches for passive adsorption; random orientation; potential denaturation. | Conjugation to a carrier protein (e.g., BSA, KLH, OVA). | Presents peptide in consistent orientation; amplifies signal. |
| Lipids | Varies (e.g., PAMPs, oxLDL) | Hydrophobic nature leads to aggregation in aqueous buffers; inconsistent presentation. | Solubilization in organic solvent or detergent followed by evaporation; incorporation into lipid vesicles. | Maintains native conformation; presents in a membrane-like context. |
| Small Molecules | < 1 kDa (Haptens) | No capacity for passive adsorption; requires presentation of multiple epitopes for detection. | Covalent conjugation to a carrier protein or dendritic linker systems. | Converts hapten into an immunogenic, coatable multivalent antigen. |
Detailed Experimental Protocols
Protocol: Peptide Conjugation to Carrier Protein for Coating
Objective: To stably immobilize a synthetic peptide to an ELISA plate via a carrier protein. Materials:
- Synthetic peptide with a terminal cysteine or lysine residue.
- Carrier Protein: Keyhole Limpet Hemocyanin (KLH) for immunization, Bovine Serum Albumin (BSA) or Ovalbumin (OVA) for plate coating.
- Heterobifunctional crosslinker: e.g., Sulfo-SMCC (sulfosuccinimidyl 4-[N-maleimidomethyl]cyclohexane-1-carboxylate).
- Purification columns (e.g., Zeba Spin Desalting Columns).
- Coating Buffer: 0.1 M Carbonate-Bicarbonate buffer, pH 9.6. Method:
- Activate Carrier Protein: Dialyze BSA (5 mg/mL) into conjugation buffer (e.g., PBS, pH 7.2). Add Sulfo-SMCC (a 20-fold molar excess) and incubate for 1 hour at RT. Remove excess crosslinker using a desalting column equilibrated with PBS.
- Conjugate Peptide: Dissolve peptide in PBS. For a cysteine-containing peptide, ensure reduction of disulfides (use TCEP if needed). Mix the activated BSA with a 15-20 molar excess of peptide. Incubate for 2 hours at RT or overnight at 4°C.
- Purification: Purify the conjugate via dialysis or size-exclusion chromatography to remove unreacted peptide.
- Plate Coating: Dilute the conjugate in carbonate coating buffer. Coat plates at 2-10 µg/mL (based on carrier protein concentration) overnight at 4°C. Proceed with standard ELISA blocking and washing steps.
Protocol: Lipid Antigen Coating via Vesicle Adsorption
Objective: To coat lipid antigens in a physiological, membrane-like bilayer structure. Materials:
- Purified lipid antigen (e.g., phosphatidylserine, LPS).
- Supporting lipids (e.g., cholesterol, phosphatidylcholine).
- Chloroform or other organic solvent.
- Nitrogen gas stream.
- PBS or Tris buffer.
- Sonicator (bath or probe). Method:
- Lipid Mixture Preparation: Combine the target lipid antigen with supporting lipids at desired molar ratios in chloroform in a glass vial. Dry the lipid film thoroughly under a gentle stream of nitrogen gas.
- Vesicle Formation: Hydrate the dried lipid film with PBS or Tris buffer (pH 7.4) to a final lipid concentration of 0.5-1 mM. Vortex vigorously to suspend. To form small unilamellar vesicles (SUVs), sonicate the suspension in a bath sonicator for 30-60 minutes until clear, or use a probe sonicator (with cooling intervals).
- Plate Coating: Dilute the SUV suspension in PBS. Add 50-100 µL per well to a high-binding ELISA plate. Incubate overnight at 4°C. The vesicles will adsorb and fuse onto the plate surface. Wash gently with PBS-Tween 20 (0.05%) to remove unadsorbed lipids.
Protocol: Small Molecule (Hapten) Conjugation via EDC/NHS Chemistry
Objective: To covalently link a carboxyl-containing hapten to an amine-bearing carrier protein. Materials:
- Hapten with a carboxylic acid group.
- Carrier protein (BSA, OVA).
- EDC (1-Ethyl-3-(3-dimethylaminopropyl)carbodiimide).
- NHS (N-Hydroxysuccinimide).
- Reaction buffer: 0.1 M MES, pH 5.0.
- Purification dialysis membrane. Method:
- Activate Hapten: Dissolve the hapten (e.g., 0.1 µmol) in MES buffer. Add NHS and EDC (each at a 10-20 fold molar excess over hapten). React for 15-30 minutes at RT to form an amine-reactive NHS ester.
- Conjugate to Carrier Protein: Add the activated hapten mixture dropwise to a solution of carrier protein (e.g., 5 mg/mL BSA in PBS, pH 7.2-7.4). Use a hapten:protein molar ratio of 10:1 to 30:1. Incubate for 2 hours at RT or overnight at 4°C with gentle mixing.
- Purification and Coating: Dialyze the reaction mixture extensively against PBS to remove unreacted reagents. Determine protein concentration. Coat plates with conjugate at 5 µg/mL in carbonate buffer overnight at 4°C.
Visualization of Strategies and Workflows
The Scientist's Toolkit
Table 2: Essential Research Reagent Solutions
| Reagent / Material | Primary Function in Coating Difficult Antigens |
|---|---|
| Heterobifunctional Crosslinkers (e.g., Sulfo-SMCC, SMPB) | Enable controlled, oriented conjugation between peptides (via thiol groups) and carrier proteins (via amine groups). |
| Carrier Proteins (BSA, KLH, OVA) | Provide a large, coatable scaffold for immobilizing peptides and haptens; enhance immune response for immunogen generation. |
| EDC and NHS | Facilitate zero-length carbodiimide chemistry for conjugating carboxyl groups to amines, essential for hapten coupling. |
| Lipid Vesicle Preparation Kit (e.g., mini-extruder, defined lipid mixes) | Standardizes the formation of unilamellar liposomes for consistent lipid antigen presentation. |
| High-Binding / Modified ELISA Plates (e.g., NeutrAvidin-coated, maleimide-activated plates) | Offers alternative, site-specific covalent immobilization strategies, bypassing passive adsorption. |
| Desalting / Dialysis Columns (e.g., Zeba, Slide-A-Lyzer) | Critical for purifying antigen conjugates from excess crosslinkers, haptens, or peptides. |
| Detergents & Solubilizers (e.g., CHAPS, n-Octyl-β-D-glucoside) | Solubilize hydrophobic lipids or peptides without denaturation for controlled plate coating. |
The reliability of any enzyme-linked immunosorbent assay (ELISA) is fundamentally dependent on the precise optimization of its core binding interaction: the coating of antigen to the solid phase and its subsequent recognition by a detection antibody. Suboptimal concentrations lead to high background, low signal, poor sensitivity, and wasted reagents. This guide details the checkerboard titration, an indispensable experimental design for the systematic, simultaneous optimization of both antigen coating and antibody detection concentrations. This work is situated within a broader thesis investigating the physicochemical parameters of plate coating procedures, aiming to establish a robust, generalizable framework for maximizing immunoassay performance.
The Principle of Checkerboard Titration
A checkerboard titration is a two-dimensional serial dilution experiment. One reagent (e.g., antigen) is diluted serially along the rows of a microtiter plate, while the other reagent (e.g., primary antibody) is diluted serially down the columns. This matrix allows every possible combination of the two reagent concentrations to be tested in a single experiment. The resulting data map identifies the optimal concentration pair that yields the highest specific signal (e.g., absorbance) with the lowest background.
Detailed Experimental Protocol
Materials and Reagents
- Coating Buffer: 0.05 M Carbonate-Bicarbonate, pH 9.6, or 0.01 M Phosphate-Buffered Saline (PBS), pH 7.4. Function: Provides optimal pH and ionic conditions for passive adsorption of antigen to the polystyrene plate.
- Wash Buffer: PBS containing 0.05% Tween 20 (PBST). Function: Removes unbound reagents and minimizes non-specific binding.
- Blocking Buffer: 1-5% Bovine Serum Albumin (BSA) or 5% non-fat dry milk in PBS. Function: Saturates uncovered plastic surface to prevent non-specific adsorption of detection antibodies.
- Detection Antibody: Horseradish peroxidase (HRP)- or Alkaline Phosphatase (AP)-conjugated secondary antibody. Function: Binds to the primary antibody and provides an enzymatic signal amplification step.
- Substrate Solution: TMB (3,3',5,5'-Tetramethylbenzidine) for HRP, or pNPP (p-Nitrophenyl Phosphate) for AP. Function: Chromogenic molecule cleaved by the enzyme to produce a measurable color change.
- Stop Solution: 1 M or 2 M Sulfuric Acid (for TMB). Function: Halts the enzymatic reaction, stabilizing the final signal for measurement.
- Microtiter Plate: 96-well flat-bottom polystyrene plate. Function: Solid phase for protein adsorption.
Procedure
Step 1: Plate Coating (Antigen Titration)
- Prepare a series of antigen dilutions in coating buffer (e.g., 10 µg/mL, 5 µg/mL, 2.5 µg/mL, 1.25 µg/mL, 0.625 µg/mL, 0.312 µg/mL). Include a "no antigen" control (coating buffer only).
- Dispense 100 µL of each antigen dilution across a single row of the plate. Each row will contain a different antigen concentration. Perform duplicates/triplicates per condition.
Step 2: Blocking
- Incubate plate overnight at 4°C or for 1-2 hours at 37°C.
- Wash plate 3 times with 300 µL/well of wash buffer.
- Add 200-300 µL/well of blocking buffer. Incubate for 1-2 hours at room temperature or 37°C.
- Wash plate 3 times as before.
Step 3: Primary Antibody Incubation (Antibody Titration)
- Prepare a series of primary antibody dilutions in blocking buffer or PBS (e.g., 1:1000, 1:2000, 1:4000, 1:8000, 1:16000, 1:32000). Include a "no primary antibody" control.
- Dispense 100 µL of each antibody dilution down a single column of the plate. Each column will now contain a different antibody concentration, creating the combinatorial matrix.
Step 4: Detection and Signal Development
- Incubate plate for 1-2 hours at room temperature.
- Wash plate 3-5 times thoroughly.
- Add 100 µL/well of appropriately diluted enzyme-conjugated secondary antibody. Incubate for 1 hour at room temperature.
- Wash plate 3-5 times.
- Add 100 µL/well of substrate solution. Incubate in the dark for 5-30 minutes.
- Stop the reaction by adding 50-100 µL/well of stop solution (if required).
- Immediately measure absorbance at the appropriate wavelength (e.g., 450 nm for TMB, 405 nm for pNPP).
Data Analysis and Interpretation
The optimal concentration pair is not simply the highest absorbance. It is the combination that provides the highest signal-to-noise ratio (SNR) or signal-to-background ratio. Key wells to analyze:
- Specific Signal: Absorbance from wells with both antigen and primary antibody.
- Background Controls: Wells with antigen but no primary antibody (checks for non-specific secondary antibody binding).
- Blank Controls: Wells with no antigen and no primary antibody (checks for substrate background).
Table 1: Example Checkerboard Titration Results (Absorbance at 450 nm)
| [Ag] (µg/mL) \ [Ab] Dilution | 1:1000 | 1:2000 | 1:4000 | 1:8000 | 1:16000 | No Ab Ctrl |
|---|---|---|---|---|---|---|
| 10.0 | 2.850 | 2.700 | 2.300 | 1.650 | 0.900 | 0.120 |
| 5.0 | 2.800 | 2.750 | 2.400 | 1.800 | 1.050 | 0.095 |
| 2.5 | 2.600 | 2.600 | 2.350 | 1.850 | 1.100 | 0.085 |
| 1.25 | 2.200 | 2.300 | 2.200 | 1.750 | 1.000 | 0.075 |
| 0.625 | 1.500 | 1.700 | 1.750 | 1.500 | 0.850 | 0.065 |
| 0.312 | 0.800 | 1.000 | 1.200 | 1.100 | 0.650 | 0.055 |
| No Ag Ctrl | 0.090 | 0.085 | 0.080 | 0.075 | 0.070 | 0.050 |
Interpretation: The highest signals are at high antigen/antibody concentrations. However, the combination of 2.5 µg/mL antigen and a 1:4000 antibody dilution offers a very high signal (~2.350) with a low background in its corresponding No-Ab control (0.085), resulting in an excellent SNR. This is often more optimal than using 10 µg/mL antigen with a 1:1000 antibody dilution, which provides marginally higher signal (2.850) but consumes significantly more of both precious reagents.
The Scientist's Toolkit: Key Research Reagent Solutions
| Item | Function in Checkerboard Titration |
|---|---|
| Carbonate-Bicarbonate Buffer (pH 9.6) | Standard high-pH coating buffer that enhances passive adsorption of many proteins (especially antibodies) to polystyrene plates. |
| PBS with 0.05% Tween 20 (PBST) | Standard washing and dilution buffer. The detergent reduces non-specific hydrophobic interactions. |
| Blocking Agent (BSA, Casein, non-fat milk) | Critical for reducing background by occupying non-specific protein-binding sites on the plastic surface after coating. |
| High-Affinity, Low-Binding 96-Well Plates | Specialized plates designed to maximize specific binding of coated proteins while minimizing passive adsorption during subsequent steps. |
| Precision Multichannel Pipettes | Essential for accurate, reproducible serial dilutions and reagent dispensing across the plate matrix. |
| Plate Washer (Automated or Manual) | Ensures consistent and thorough washing between steps, a key factor in assay reproducibility. |
| Microplate Reader (Spectrophotometer) | Accurately measures the absorbance in each well of the matrix to generate the quantitative data for analysis. |
Visualizing the Workflow and Logic
Checkerboard Titration Experimental Workflow
Logic for Selecting Optimal Concentrations
Validating Coated Plates: QC Methods and Comparing Coating Techniques
Within the broader research on optimizing ELISA plate coating procedures, robust quality control (QC) metrics are paramount. The consistency of the coated plate—the solid phase of the assay—directly dictates the reliability, sensitivity, and reproducibility of downstream immunoassay results. This technical guide focuses on two critical, interdependent QC parameters for coated plates: Signal-to-Noise Ratio (SNR or S/N) and the Coefficient of Variation percentage (CV%). Their assessment ensures that the coating process yields plates with high specific signal detection capability and minimal well-to-well variability, which is foundational for accurate quantitative analysis in drug development and clinical research.
Core QC Parameters: Definitions and Significance
Signal-to-Noise Ratio (S/N): This metric quantifies the assay's ability to distinguish the specific signal from background interference. A high S/N indicates a robust coating that provides strong specific binding while minimizing non-specific adsorption. It is calculated as:
S/N = (Mean Signal of Positive Control) / (Mean Signal of Negative Control)
A minimum S/N of 2-3 is often considered the lower limit of detectability, but for robust quantitative assays, values >10 are typically targeted.
Coefficient of Variation % (CV%): This measures the precision (well-to-well uniformity) of the coating across the plate. It is calculated as:
CV% = (Standard Deviation of Signals / Mean Signal) * 100
For coat-only QC (e.g., measuring the consistency of capture antibody adsorption), a low CV% (<10%, ideally <5%) across replicate wells is essential. High CV% indicates inconsistent coating, leading to variable assay performance.
Experimental Protocol for Coated Plate QC Assessment
This protocol details the standard method to evaluate a freshly coated microplate prior to its use in a full ELISA.
Materials & Equipment:
- Coated microplate (96-well or 384-well).
- Blocking buffer (e.g., 1% BSA, 5% non-fat dry milk in PBS).
- Detection antibody conjugate (e.g., HRP-labeled antibody against the coated protein).
- Appropriate substrate solution (e.g., TMB for HRP).
- Stop solution (e.g., 1M H₂SO₄ for TMB).
- Plate washer and microplate reader (with appropriate wavelength filter).
Procedure:
- Blocking: After coating, block all wells with 200-300 µL of blocking buffer for 1-2 hours at room temperature.
- Washing: Wash the plate 3 times with wash buffer (e.g., PBS with 0.05% Tween-20).
- Signal Generation:
- For Direct Coating QC: Add the detection antibody conjugate (e.g., anti-IgG-HRP if the coating is an IgG) diluted in blocking buffer to all wells. Incubate 1 hour. Wash.
- For Functional Coating QC (recommended): Add a known concentration of the target analyte (positive control) to half the wells, and only diluent/blank (negative control) to the other half. Then proceed with the standard detection antibody and conjugate steps of the assay.
- Substrate Development: Add substrate solution to all wells. Incubate for a consistent, predetermined time (e.g., 10 minutes).
- Signal Measurement: Stop the reaction if necessary. Read the absorbance (OD) immediately.
- Data Analysis: Designate well groups as Positive Controls (PC) and Negative Controls (NC). Calculate the mean and standard deviation for each group. Compute S/N and CV% for both PC and NC replicates.
Data Presentation
Table 1: Example QC Data from a Coated Plate Validation Experiment
| Plate Lot | Coating Conc. (µg/mL) | Mean OD (PC) | SD (PC) | CV% (PC) | Mean OD (NC) | SD (NC) | CV% (NC) | Signal-to-Noise (S/N) | QC Pass/Fail |
|---|---|---|---|---|---|---|---|---|---|
| A123 | 2.0 | 2.345 | 0.095 | 4.1% | 0.087 | 0.008 | 9.2% | 26.9 | Pass |
| A124 | 2.0 | 2.101 | 0.152 | 7.2% | 0.091 | 0.009 | 9.9% | 23.1 | Pass |
| B567 | 1.0 | 1.456 | 0.201 | 13.8% | 0.205 | 0.035 | 17.1% | 7.1 | Fail (High CV%) |
| B568 | 0.5 | 0.890 | 0.118 | 13.3% | 0.310 | 0.041 | 13.2% | 2.9 | Fail (Low S/N) |
Note: PC = Positive Control (e.g., target analyte added). NC = Negative Control (no analyte). Pass criteria defined as PC CV% <10% and S/N >10.
The Scientist's Toolkit: Research Reagent Solutions
Table 2: Essential Materials for Coated Plate QC
| Item | Function in Coating QC |
|---|---|
| High-Purity Coating Antigen/Antibody | The molecule immobilized on the plate. Purity is critical to minimize non-specific binding and ensure consistent coating density. |
| Carbonate-Bicarbonate Coating Buffer (pH 9.6) | Common buffer for passive adsorption of proteins, optimizing binding via hydrophobic interactions. |
| BSA (Bovine Serum Albumin) or Casein | Standard blocking agents to occupy remaining protein-binding sites, reducing background noise (improving S/N). |
| HRP (Horseradish Peroxide) Conjugates | Enzyme-linked antibodies for signal generation. Consistent conjugate quality is vital for reproducible S/N. |
| Chromogenic Substrate (e.g., TMB) | Generates a measurable colorimetric signal proportional to the amount of bound conjugate. |
| Precision Microplate Reader | Accurately measures optical density (OD) across all wells, essential for calculating CV% and S/N. |
| Automated Plate Washer | Ensures uniform and reproducible washing steps, reducing well-to-well variability (lowering CV%). |
Visualizing the QC Workflow and Impact
Workflow for Coated Plate Quality Control Assessment
Coating Uniformity Directly Determines Assay Reliability
Integrating rigorous assessment of Signal-to-Noise and CV% into the QC protocol for coated plates is non-negotiable for generating credible ELISA data. These parameters serve as early, predictive indicators of assay performance, directly linking the quality of the coating procedure—the subject of ongoing thesis research—to the validity of experimental outcomes. By standardizing these measurements and applying clear pass/fail criteria, researchers and development professionals can ensure that their foundational assay component supports, rather than undermines, their scientific and diagnostic objectives.
Comparing Direct Passive Adsorption to Alternative Methods (e.g., Streptavidin-Biotin)
Within the broader thesis on ELISA plate coating procedure research, the selection of an immobilization strategy is a foundational decision impacting assay sensitivity, specificity, and reproducibility. Direct passive adsorption (DPA) is the classical, simplest method. In contrast, the streptavidin-biotin interaction represents a powerful alternative for oriented, high-affinity capture. This whitepaper provides a technical comparison, focusing on performance parameters and practical implementation.
Core Methodologies and Experimental Protocols
Protocol: Direct Passive Adsorption (DPA)
Principle: Non-covalent, physical adsorption of biomolecules (typically antibodies or antigens) to the polystyrene surface via hydrophobic and ionic interactions. Detailed Procedure:
- Coating Buffer Preparation: Prepare 0.05 M carbonate-bicarbonate buffer, pH 9.6, or 0.01 M phosphate-buffered saline (PBS), pH 7.4.
- Antigen/Antibody Dilution: Dilute the capture protein in coating buffer to an optimal concentration (typically 1–10 µg/mL). A checkerboard assay is required for optimization.
- Plate Coating: Dispense 50–100 µL of the solution into each well of a 96-well microtiter plate.
- Incubation: Seal the plate and incubate overnight at 4°C (or 1–3 hours at 37°C).
- Washing: Aspirate the coating solution and wash the plate 3 times with wash buffer (e.g., PBS containing 0.05% Tween 20, PBST).
- Blocking: Add 150–300 µL of blocking agent (e.g., 1–5% BSA, 5% non-fat dry milk in PBST) per well. Incubate for 1–2 hours at room temperature.
- Final Wash: Wash plate 3 times with wash buffer. The plate is now ready for subsequent assay steps or can be dried and stored.
Protocol: Streptavidin-Biotin Mediated Coating
Principle: A two-step process involving the adsorption of streptavidin to the plate, followed by the capture of biotinylated biomolecules, enabling oriented immobilization. Detailed Procedure:
- Streptavidin Coating: Dilute recombinant streptavidin in PBS (pH 7.4) to 2–10 µg/mL. Add 50–100 µL per well and incubate overnight at 4°C.
- Washing: Wash plate 3x with PBST.
- Optional Blocking: A brief blocking step with 1% BSA in PBS may be used to minimize non-specific binding of streptavidin layers.
- Biotinylated Ligand Capture: Dilute the biotinylated antibody or antigen in assay buffer (e.g., PBS with 0.1% BSA). Add to the streptavidin-coated wells.
- Incubation: Incubate for 30–60 minutes at room temperature with gentle shaking.
- Washing: Wash plate 3x with PBST. The plate is now ready for assay. (Note: The classical blocking step is often omitted or minimized as the streptavidin surface is already largely inert).
Performance Data Comparison
Table 1: Quantitative Comparison of Coating Methods
| Parameter | Direct Passive Adsorption (DPA) | Streptavidin-Biotin |
|---|---|---|
| Immobilization Efficiency | ~1–10% of added protein; highly variable | >90% of captured biotin-ligand; highly efficient |
| Typical Assay LOD (pg/mL) | 50–500 (highly dependent on target/antibody pair) | 5–50 (consistently lower due to improved orientation) |
| Inter-assay CV (%) | 10–15% | 5–8% |
| Required Coating Time | 4–18 hours | 1.5–2 hours (streptavidin overnight, then 30-60 min for biotin ligand) |
| Orientation Control | Random; active sites may be obscured | Directed; biotin moiety is typically conjugated distal to binding site |
| Surface Denaturation Risk | High due to direct hydrophobic interaction with plastic | Low; biomolecule interacts via gentle biotin linkage |
| Best Application | Robust, high-titer antibodies; cost-sensitive screening | Critical assays requiring max sensitivity; low-affinity or small ligands |
The Scientist's Toolkit: Key Reagents & Materials
Table 2: Essential Research Reagent Solutions
| Item | Function & Explanation |
|---|---|
| High-Binding Polystyrene Plates | Standard plate chemistry optimized for passive protein adsorption via hydrophobic interaction. |
| Carbonate-Bicarbonate Buffer (pH 9.6) | Common alkaline coating buffer promoting electrostatic interaction between protein and negatively charged plastic. |
| Recombinant Streptavidin | Purified tetrameric protein with high affinity for biotin; used to pre-coat plates for capture systems. |
| Sulfo-NHS-LC-Biotin | A water-soluble, amine-reactive biotinylation reagent for labeling antibodies or antigens without aggregation. |
| Blocking Agent (BSA, Casein) | Inert protein used to occupy remaining hydrophobic sites on the plate after coating, reducing background noise. |
| Low-Binding/Neutral Plates | Plates with hydrophilic surfaces used in alternative methods to prevent unwanted passive adsorption. |
Visualized Workflows and Pathways
Title: Direct Passive Adsorption ELISA Workflow
Title: Streptavidin-Biotin ELISA Coating Workflow
Title: Antibody Orientation in DPA vs. Streptavidin-Biotin
This guide is framed within a broader research thesis investigating critical variables in Enzyme-Linked Immunosorbent Assay (ELISA) plate coating procedures. The long-term stability of the immobilized capture molecule (antibody, antigen, or protein) is a pivotal factor influencing assay reproducibility, shelf-life, and commercial viability. This document provides an in-depth technical comparison of real-time and accelerated stability study methodologies, serving as a foundational reference for researchers optimizing and validating coating protocols in diagnostic and therapeutic development.
Fundamentals of Coating Stability
Coating stability refers to the ability of the adsorbed or covalently bound biorecognition element to retain its structural integrity and functional activity over time under defined storage conditions. Degradation mechanisms include:
- Denaturation: Unfolding of protein structures.
- Hydrolysis: Cleavage of peptide bonds or covalent linkers.
- Oxidation: Modification of methionine, cysteine, or tryptophan residues.
- Aggregation: Non-native protein-protein interactions.
- Desorption: Loss of coating from the solid phase.
Real-Time Stability Studies
Real-time studies monitor coated plates under their intended, labeled storage conditions (e.g., 2-8°C, desiccated). This provides the most direct and reliable evidence of shelf-life but is time-prohibitive for development.
Protocol: Real-Time Longitudinal Monitoring
- Coating & Blocking: Perform standard coating procedure (e.g., 100 µL/well of 1-10 µg/mL capture antibody in carbonate-bicarbonate buffer, pH 9.6, overnight at 4°C). Aspirate and block with 200 µL/well of suitable blocker (e.g., 1% BSA, 5% non-fat dry milk in PBS) for 1-2 hours.
- Storage: Aspirate block solution, wash plates once with storage buffer (often a stabilizing formulation like PBS with 1% BSA and 0.09% NaN₃). Seal plates in foil pouches with desiccant. Store at the recommended long-term condition (e.g., 4°C).
- Sampling & Testing: At predetermined time points (e.g., 0, 1, 3, 6, 9, 12, 18, 24 months), remove replicate plates (n≥3) from storage. Bring to room temperature.
- Functional Assay: Perform a complete, validated ELISA. Use a standardized analyte concentration (preferably near the EC80 of the calibration curve) and consistent detection systems.
- Data Analysis: Plot signal intensity (OD, RFU) versus time. Shelf-life is the time at which the lower confidence limit of the signal intersects the pre-defined acceptance criterion (e.g., ≥80% of initial signal).
Accelerated Stability Studies
Accelerated studies employ stress conditions (elevated temperature, humidity) to rapidly induce degradation, enabling prediction of real-time shelf-life via kinetic modeling.
Protocol: Isothermal Accelerated Stability Testing
- Stress Conditions: Prepare and seal coated-blocked plates as above. Store replicate sets (n≥3) at elevated temperatures (e.g., 25°C, 37°C, 45°C). Include a 4°C control set.
- High-Humidity Stress: For humidity studies, store plates at 25°C/60% RH and 40°C/75% RH in environmental chambers.
- High-Frequency Sampling: Test plates at frequent intervals (e.g., 0, 1, 2, 4, 8, 12 weeks) using the functional assay.
- Kinetic Modeling: Apply the Arrhenius equation, which describes the temperature dependence of reaction rates: k = A * e^(-Ea/RT), where k is the degradation rate constant, Ea is the activation energy, R is the gas constant, and T is temperature in Kelvin.
- Prediction: Determine the degradation rate at each elevated temperature. Plot ln(k) vs. 1/T (Arrhenius plot), extrapolate to the recommended storage temperature (e.g., 4°C), and calculate the predicted degradation rate and shelf-life.
Table 1: Comparison of Stability Study Types
| Feature | Real-Time Study | Accelerated Study |
|---|---|---|
| Primary Objective | Establish definitive, validated shelf-life | Predict shelf-life rapidly for development |
| Duration | Months to years (full shelf-life) | Weeks to months |
| Conditions | Recommended storage conditions (e.g., 4°C) | Stress conditions (elevated T, humidity) |
| Regulatory Acceptance | Gold standard; required for final claims | Accepted for development, supportive data |
| Key Output | Measured time to failure | Predicted time to failure via model |
| Uncertainty | Low (direct observation) | Higher (depends on model validity) |
Table 2: Example Stability Data from Accelerated Study
| Storage Condition | Time Point (Weeks) | Mean Signal (OD450) | % Initial Activity | Predicted Degradation Rate (k) |
|---|---|---|---|---|
| 4°C (Control) | 0 | 2.85 ± 0.12 | 100% | 0.001 week⁻¹ |
| 12 | 2.80 ± 0.15 | 98.2% | ||
| 25°C / 60% RH | 0 | 2.85 ± 0.12 | 100% | 0.015 week⁻¹ |
| 4 | 2.68 ± 0.18 | 94.0% | ||
| 8 | 2.45 ± 0.20 | 86.0% | ||
| 12 | 2.20 ± 0.22 | 77.2% | ||
| 37°C | 0 | 2.85 ± 0.12 | 100% | 0.082 week⁻¹ |
| 2 | 2.42 ± 0.19 | 84.9% | ||
| 4 | 1.95 ± 0.23 | 68.4% | ||
| 8 | 1.30 ± 0.25 | 45.6% |
Note: Data is illustrative. Predicted shelf-life at 4°C (time to 80% activity) from this Arrhenius extrapolation: ~95 weeks.
Experimental Protocols in Detail
Protocol: Arrhenius Model Analysis for Shelf-Life Prediction
- Perform accelerated testing at a minimum of three elevated temperatures (e.g., 25°C, 37°C, 45°C).
- Assume activity loss follows first-order kinetics: ln(A/A₀) = -k*t, where A is activity at time t, A₀ is initial activity, k is rate constant.
- Calculate k at each temperature by linear regression of ln(%Activity) vs. time.
- Construct Arrhenius plot: ln(k) on y-axis vs. 1/T (K⁻¹) on x-axis.
- Perform linear regression. The slope = -Ea/R.
- Solve the regression line equation for k at the storage temperature T_s (e.g., 277K for 4°C).
- Calculate predicted shelf-life (t): t = ln(Acrit/A₀) / -kTs, where A_crit is the critical activity limit (e.g., 0.80).
Visualization of Concepts
Stability Study Decision Pathway
Primary Pathways to Coating Failure
Arrhenius Shelf-Life Prediction Workflow
The Scientist's Toolkit: Research Reagent Solutions
Table 3: Essential Materials for Coating Stability Studies
| Item | Function & Importance |
|---|---|
| High-Binding ELISA Plates (e.g., Polystyrene, C-Binding) | Standard solid phase with passive adsorption properties; crucial for consistency. |
| Purified Capture Protein/Antibody | The critical reagent whose stability is being assessed; must be highly characterized and consistent between lots. |
| Carbonate-Bicarbonate Coating Buffer (pH 9.6) | Common high-pH buffer that promotes passive adsorption of proteins via hydrophobic and ionic interactions. |
| Stabilizing Blocking Buffer (e.g., with BSA, Sucrose, Trehalose) | Blocks residual binding sites and can stabilize coated proteins against denaturation and desorption during storage. |
| Lyoprotectant/Desiccant Packs | Maintains low humidity within sealed storage pouches, preventing hydrolysis and microbial growth. |
| Environmental Chambers/Ovens | For precise control of temperature and humidity during accelerated stress testing. |
| Reference Standard/Analyte | A stable, well-quantified preparation used in functional ELISAs to measure coating activity consistently over time. |
| HRP or ALP Conjugated Detection Antibody | Key component of the detection system; must itself be stable to avoid confounding stability results. |
| Stable Chemiluminescent or Chromogenic Substrate | Provides the readout signal; substrate stability is essential for assay reproducibility. |
| Plate Sealer (Adhesive Foil) | Prevents evaporation, contamination, and humidity exchange during plate storage. |
Within the broader thesis on ELISA plate coating procedure research, a critical challenge is the development of robust, sensitive, and reproducible assays for novel biomarkers in early-stage drug development. This case study examines the systematic optimization of plate-coating parameters for "Biomarker-X," a novel soluble protein target implicated in autoimmune disease pathogenesis. The assay's performance directly impacts the reliability of pharmacokinetic (PK) and pharmacodynamic (PD) data, informing critical go/no-go decisions in preclinical development.
Biomarker-X Characteristics & Assay Development Rationale
Biomarker-X is a glycosylated, 45 kDa cytokine receptor shed from the cell membrane. Its low circulating concentrations (expected range: 10–200 pg/mL in serum) and susceptibility to conformational epitope masking present unique challenges for capture antibody binding during the solid-phase coating step. Suboptimal coating leads to high background, poor standard curve dynamics, and inter-plate variability, compromising data integrity.
Coating Optimization Experimental Design
A Design of Experiments (DoE) approach was used to evaluate three critical coating parameters simultaneously: capture antibody concentration, coating buffer pH, and incubation temperature. The primary readouts were assay sensitivity (Lower Limit of Quantification - LLOQ), signal-to-noise ratio (S/N), and intra-assay precision (%CV).
Table 1: Coating Optimization DoE Parameters and Levels
| Parameter | Low Level | High Level | Unit |
|---|---|---|---|
| [Capture Antibody] | 1 | 5 | µg/mL |
| Coating Buffer pH | 7.4 (Phosphate) | 9.6 (Carbonate) | pH |
| Incubation Temperature | 4 | 37 | °C |
Detailed Experimental Protocols
Protocol: Coating Procedure Variants
- Plate Selection: High-binding, clear polystyrene 96-well plates were used.
- Antibody Dilution: The anti-Biomarker-X monoclonal antibody (Clone 2B1) was diluted in either 0.05 M carbonate-bicarbonate buffer (pH 9.6) or 0.1 M phosphate-buffered saline (PBS, pH 7.4) to final concentrations of 1 and 5 µg/mL.
- Coating: 100 µL/well of the coating solution was dispensed. Plates were sealed and incubated for 16 hours at either 4°C or 37°C in a static incubator.
- Blocking: Following incubation, plates were washed 3x with PBS containing 0.05% Tween-20 (PBST). All wells were blocked with 300 µL of blocking buffer (PBS with 1% BSA and 5% sucrose) for 2 hours at room temperature (RT).
- Plate Storage: After a final wash, plates were dried under vacuum for 2 hours, sealed in desiccated bags with desiccant, and stored at 4°C until use (within 2 weeks).
Protocol: Post-Optimization Assay Validation
- Assay Procedure: Coated/blocked plates were reconstituted with PBST. 100 µL of standard (recombinant Biomarker-X in 100% control serum) or sample was added per well and incubated for 2 hours at RT with shaking.
- Detection: After washing, 100 µL of biotinylated detection antibody (0.5 µg/mL in assay diluent) was added for 1 hour at RT.
- Signal Amplification: Following a wash, 100 µL of streptavidin-HRP (1:5000 dilution) was added for 30 minutes at RT.
- Development: After a final wash, 100 µL of TMB substrate was added. The reaction was stopped after 10 minutes with 50 µL of 2M H₂SO₄.
- Reading: Absorbance was read at 450 nm with a 620 nm reference filter.
Results & Data Presentation
Table 2: DoE Results for Coating Optimization (n=3 replicates per condition)
| Condition | [Ab] (µg/mL) | pH | Temp (°C) | LLOQ (pg/mL) | Max Signal (OD) | S/N Ratio | Intra-Assay %CV |
|---|---|---|---|---|---|---|---|
| 1 | 1 | 7.4 | 4 | 25.6 | 1.85 | 12.1 | 15.2 |
| 2 | 5 | 7.4 | 4 | 18.3 | 2.45 | 18.5 | 8.7 |
| 3 | 1 | 9.6 | 4 | 15.8 | 2.68 | 22.3 | 7.1 |
| 4 | 5 | 9.6 | 4 | 8.4 | 3.12 | 35.6 | 4.5 |
| 5 | 1 | 7.4 | 37 | 32.5 | 1.52 | 9.8 | 18.9 |
| 6 | 5 | 7.4 | 37 | 22.4 | 2.01 | 15.4 | 12.3 |
| 7 | 1 | 9.6 | 37 | 20.1 | 2.20 | 17.8 | 10.5 |
| 8 | 5 | 9.6 | 37 | 12.7 | 2.85 | 28.9 | 6.8 |
Conclusion: Condition 4 (5 µg/mL, pH 9.6, 4°C) yielded the optimal combination of sensitivity, dynamic range, and precision. The alkaline pH likely improved antibody orientation via hydrophobic interactions, while the lower temperature preserved antibody integrity. The higher concentration ensured sufficient capture capacity.
Visualization: Biomarker-X Assay Workflow & Optimization Logic
Title: Biomarker-X ELISA Coating Optimization Decision Pathway
The Scientist's Toolkit: Research Reagent Solutions
Table 3: Essential Materials for Coating Optimization Experiments
| Item | Function & Rationale | Key Consideration |
|---|---|---|
| High-Binding Polystyrene Plate | Maximizes passive adsorption of capture antibodies via hydrophobic and ionic interactions. | Consistency in well surface chemistry between lots is critical. |
| Anti-Biomarker-X mAb (Clone 2B1) | Primary capture antibody; must recognize a non-overlapping epitope from detection antibody. | Use carrier-protein-free (BSA-free) stock to avoid interference. |
| Carbonate-Bicarbonate Buffer (pH 9.6) | Alkaline buffer promotes hydrophobic interactions, often improving antibody binding orientation. | Fresh preparation (< 2 weeks) required to maintain pH. |
| PBS (pH 7.4) | Physiological pH buffer; used as a comparison to assess pH dependency of coating. | Contains no divalent cations (e.g., Ca2+, Mg2+) to prevent precipitation. |
| BSA (Fraction V), Sucrose | Blocking agents. BSA occupies leftover binding sites. Sucrose stabilizes coated antibody during plate drying/storage. | Use molecular biology grade to minimize background. |
| Non-Ionic Detergent (Tween-20) | Reduces non-specific binding in wash buffers by disrupting hydrophobic interactions. | Optimal concentration is typically 0.05-0.1% (v/v). |
| Precision Microplate Sealer | Prevents evaporation and cross-contamination during long incubations (e.g., 16h at 37°C). | Use adhesive seals compatible with temperature extremes. |
| Desiccant Packs & Vacuum Desiccator | For stable, long-term storage of coated plates. Removes moisture that can degrade antibody performance. | Indicate humidity with indicator cards. |
Best Practices for Documentation and Ensuring Inter-Assay Reproducibility
Within the broader context of ELISA plate coating procedure research, achieving robust and reproducible results is a cornerstone of scientific validity and drug development success. Inter-assay reproducibility—the ability for an experiment to be repeated in a different laboratory or by a different operator while obtaining the same result—is critically dependent on meticulous documentation and standardized practices. This technical guide outlines the essential best practices for documenting ELISA coating protocols and ensuring data can be reliably reproduced across assays and laboratories.
Foundational Principles of Documentation
Comprehensive documentation must capture not just the "what," but the "how," "when," and "with what." For ELISA coating procedures, this is vital due to the sensitivity of the assay to subtle variations in reagent source, buffer composition, incubation conditions, and plate handling.
The Minimum Information Standard
Adopt a "Minimum Information" framework for all coating protocol documentation. Every record must include:
- Reagent Specification: Manufacturer, catalog number, lot number, concentration, and storage conditions.
- Buffer Formulation: Complete recipe, including pH, molarity, and preparation method (e.g., order of addition, filtration).
- Equipment Details: Make, model, and calibration status of critical equipment (pipettes, plate washers, readers, incubators).
- Environmental Conditions: Temperature and humidity during coating, blocking, and storage steps.
- Temporal Data: Exact incubation times (to the minute) and dates of reagent preparation and use.
Detailed Methodologies for Key Experiments
Protocol: Coating Optimization for a Novel Capture Antibody
Aim: To determine the optimal concentration and buffer for coating a 96-well plate with a novel monoclonal antibody for a sandwich ELISA.
Methodology:
- Buffer Preparation: Prepare three common coating buffers: 0.1 M Carbonate-Bicarbonate (pH 9.6), 0.1 M Phosphate Buffered Saline (PBS, pH 7.4), and 0.1 M Tris-HCl (pH 8.5). Filter all through a 0.22 µm membrane.
- Antibody Dilution: Prepare a stock solution of the capture antibody in PBS. Create a two-dimensional dilution matrix in a master plate: four concentrations (e.g., 0.5, 1, 2, 5 µg/mL) across the three buffers.
- Plate Coating: Transfer 100 µL of each condition to a 96-well microplate (N=4 replicates per condition). Include wells with buffer-only controls. Seal plate and incubate overnight at 4°C.
- Blocking & Assay: After washing 3x with PBS + 0.05% Tween-20 (PBST), block with 5% non-fat dry milk in PBST for 2 hours. Proceed with a standardized detection protocol using a known positive control sample and appropriate detection antibodies/streptavidin-HRP.
- Data Analysis: Measure absorbance. The optimal condition is the lowest antibody concentration in the buffer that yields maximum signal-to-noise ratio (Signal from positive control / Signal from buffer-only control).
Protocol: Inter-Assay Reproducibility Test
Aim: To quantify the inter-assay Coefficient of Variation (CV) for a fully optimized ELISA.
Methodology:
- Sample Preparation: Prepare a single, large-volume aliquot of a quality control (QC) sample at low, mid, and high concentrations of the analyte. Sub-aliquot and freeze at -80°C.
- Experimental Design: Over the course of five separate days, with different operators, perform the complete ELISA protocol from coating to reading. Use freshly reconstituted coating buffer and blocking reagent each day from standardized stocks.
- Execution: In each run, include all three QC samples in triplicate, alongside a standard curve. All other reagents (detection antibody, enzyme conjugate, substrate) must be from the same master lot.
- Statistical Analysis: Calculate the mean concentration and standard deviation (SD) for each QC sample across the five independent assays. Compute the inter-assay CV% as (SD / Mean) * 100. A CV of <15-20% is generally acceptable for bioassays.
Data Presentation
| QC Sample (Nominal Conc.) | Mean Observed Conc. (pg/mL) | Standard Deviation (SD) | Inter-Assay CV (%) | n (Assays) |
|---|---|---|---|---|
| Low (15 pg/mL) | 16.2 | 2.1 | 12.9 | 5 |
| Mid (100 pg/mL) | 104.5 | 8.3 | 7.9 | 5 |
| High (250 pg/mL) | 242.7 | 18.9 | 7.8 | 5 |
Table 2: Key Research Reagent Solutions for ELISA Plate Coating
| Item | Function / Role in Coating | Critical Specification Notes |
|---|---|---|
| Microplate | Solid phase for protein adsorption. | Material (e.g., polystyrene, high-binding vs. medium-binding), well shape, lot consistency. |
| Capture Molecule | The antibody or antigen immobilized to bind the target. | Specificity, affinity, purity, clonality, concentration, storage buffer, carrier protein presence. |
| Coating Buffer | Provides optimal pH and ionic strength for passive adsorption. | Precise pH (typically 9.6 for antibodies), chemical purity, carbonation prevention, filtration (0.22 µm). |
| Blocking Buffer | Saturates remaining protein-binding sites to reduce non-specific binding. | Agent type (e.g., BSA, casein, synthetic), concentration, presence of stabilizers (e.g., sugars), and surfactants. |
| Wash Buffer | Removes unbound material between steps. | Ionic strength, surfactant type/concentration (e.g., Tween-20), pH, sterility. |
| Plate Sealer | Prevents evaporation and contamination during incubations. | Adhesive, chemically inert, temperature stable. |
| Calibrated Pipettes | Ensures accurate and precise transfer of coating and other solutions. | Regular calibration and maintenance records (ISO 8655 standards). |
| Temperature-Controlled Incubator | Maintains consistent temperature for coating incubation (often 4°C for overnight). | Calibrated thermometer, uniform temperature distribution, minimal vibration. |
Visualizing Workflows and Relationships
Diagram 1: Documentation Workflow for a Single Assay Run
Diagram 2: Core Steps in a Sandwich ELISA Pathway
Diagram 3: Factors Affecting Coating Reproducibility
Conclusion
Mastering the ELISA plate coating procedure is not a mere technical step but a foundational determinant of assay success. A robust coating, grounded in an understanding of protein-surface interactions and meticulously optimized for the specific analyte, ensures high sensitivity, specificity, and reproducibility. From foundational principles to advanced troubleshooting, each aspect of the process—buffer selection, plate type, incubation parameters, and blocking—contributes to reliable data generation. For drug development and clinical research, where decisions hinge on precise quantification, a validated and optimized coating protocol mitigates risk and accelerates discovery. Future directions point toward more standardized, automatable protocols and novel surface chemistries that expand the range of molecules amenable to ELISA, further solidifying its role as a cornerstone of biomedical analysis.