The Ultimate Step-by-Step ELISA Protocol: From Basic Principles to Advanced Troubleshooting
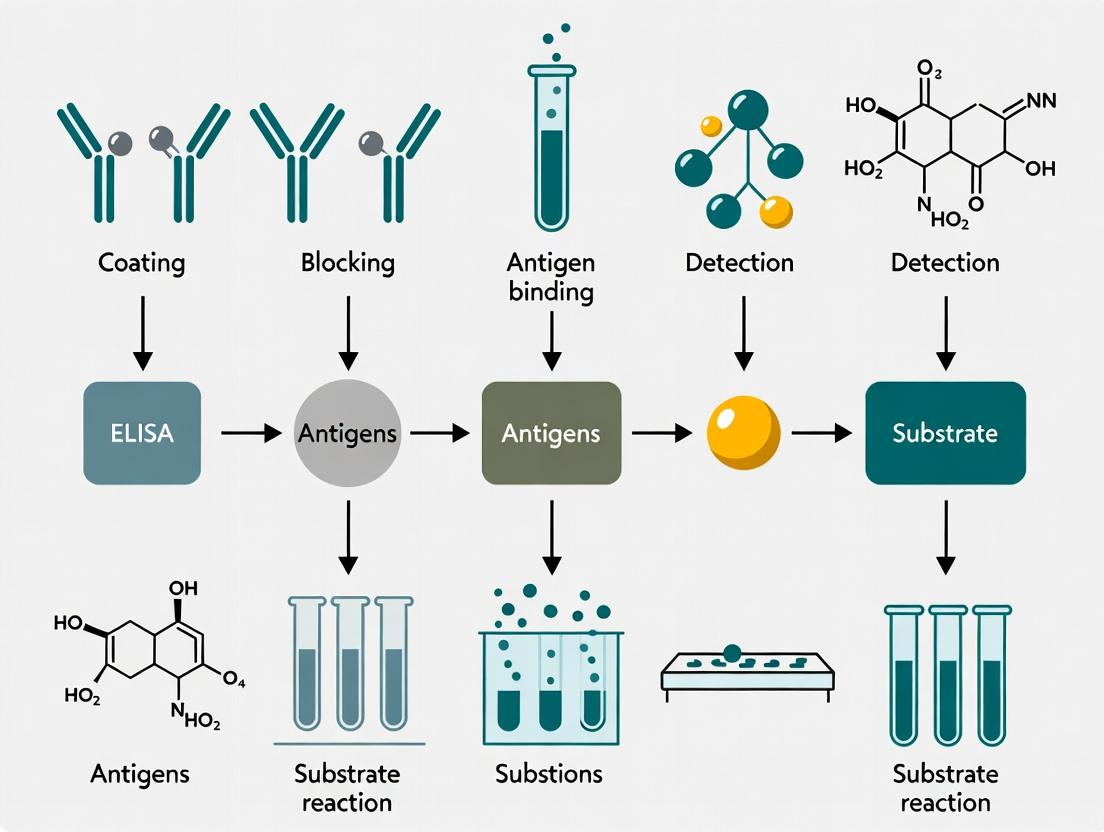
This comprehensive guide provides researchers, scientists, and drug development professionals with a complete framework for Enzyme-Linked Immunosorbent Assay (ELISA).
The Ultimate Step-by-Step ELISA Protocol: From Basic Principles to Advanced Troubleshooting
Abstract
This comprehensive guide provides researchers, scientists, and drug development professionals with a complete framework for Enzyme-Linked Immunosorbent Assay (ELISA). It begins by establishing the foundational principles of immunoassays and antibody-antigen interactions. It then details a meticulous, step-by-step protocol for various ELISA formats (direct, indirect, sandwich, competitive), including reagent preparation, plate coating, incubation, washing, detection, and data analysis. The guide dedicates significant focus to practical troubleshooting of common issues like high background, low sensitivity, and poor reproducibility, offering optimization strategies. Finally, it covers critical validation parameters (specificity, sensitivity, precision, accuracy) and compares ELISA to modern alternative techniques such as Luminex, Simoa, and MSD assays. This resource is designed to ensure robust, reliable, and reproducible results in both research and diagnostic applications.
ELISA Fundamentals: Understanding the Core Principles and Components
What is ELISA? Defining the Enzyme-Linked Immunosorbent Assay
Abstract: This in-depth technical guide defines the Enzyme-Linked Immunosorbent Assay (ELISA), a cornerstone quantitative analytical technique in immunochemistry. Framed within a broader thesis on ELISA methodology, this whitepaper provides researchers, scientists, and drug development professionals with a detailed examination of core principles, formats, protocols, and quantitative data analysis, supported by current research and reagent specifications.
Core Principle and Definition
ELISA is a highly sensitive and specific plate-based assay designed to detect and quantify soluble substances such as peptides, proteins, antibodies, and hormones. The fundamental principle involves the immobilization of an antigen or antibody on a solid polystyrene microplate surface, followed by the stepwise addition of reagents that generate a measurable signal, typically a colorimetric change, proportional to the analyte concentration. The signal is generated via an enzyme conjugated to a detection antibody, which catalyzes a reaction with a chromogenic substrate.
Primary ELISA Formats
The assay configuration is selected based on the target analyte and required specificity.
Direct ELISA
The antigen is immobilized and detected directly by an enzyme-conjugated primary antibody. This format is simple and rapid but offers less signal amplification and potential for higher background.
Indirect ELISA
The immobilized antigen is detected in two steps: (1) an unlabeled primary antibody, (2) an enzyme-conjugated secondary antibody that binds the primary. This provides signal amplification through multiple secondary antibodies binding to a single primary.
Sandwich ELISA
Requires two antibodies that bind to different epitopes on the target antigen. The capture antibody is first immobilized. The sample containing antigen is added, followed by a detection antibody (direct or indirect format). This format is highly specific and sensitive, ideal for complex samples.
Competitive ELISA
Used for detecting small antigens. The sample antigen competes with a labeled reference antigen for a limited number of antibody binding sites. The signal is inversely proportional to the analyte concentration.
Detailed Experimental Protocol: Indirect ELISA for Serum Antibody Detection
This protocol exemplifies a common application in immunology and vaccine development.
Materials: Coating Buffer (Carbonate-Bicarbonate, pH 9.6), PBS (Phosphate Buffered Saline, pH 7.4), Washing Buffer (PBS with 0.05% Tween 20, PBST), Blocking Buffer (1-5% BSA or non-fat dry milk in PBST), Primary Antibody (serum samples), Enzyme-conjugated Secondary Antibody (e.g., HRP-anti-species), Substrate Solution (e.g., TMB for HRP), Stop Solution (1M H₂SO₄ or HCl), Microplate Reader.
Procedure:
- Coating: Dilute the purified antigen in coating buffer. Add 100 µL per well to a 96-well microplate. Seal and incubate overnight at 4°C or 1-2 hours at 37°C.
- Washing: Aspirate liquid and wash wells 3 times with 300 µL PBST per well. Blot plate on absorbent paper.
- Blocking: Add 200-300 µL of blocking buffer per well. Incubate for 1-2 hours at room temperature (or 37°C). Wash as in step 2.
- Primary Antibody Incubation: Serially dilute the test serum samples in blocking buffer. Add 100 µL of each dilution to designated wells. Include positive control, negative control, and blank (buffer only). Incubate 1-2 hours at room temperature. Wash.
- Secondary Antibody Incubation: Dilute enzyme-conjugated secondary antibody in blocking buffer. Add 100 µL per well. Incubate for 1 hour at room temperature in the dark. Wash thoroughly (5-6 times).
- Detection: Add 100 µL of freshly prepared substrate solution per well. Incubate in the dark for 10-30 minutes until color develops.
- Stop Reaction: Add 50-100 µL of stop solution per well. The color change will stabilize (e.g., TMB turns from blue to yellow).
- Measurement: Immediately read the optical density (OD) of each well at the appropriate wavelength (e.g., 450 nm for TMB) using a microplate reader.
Data Analysis: Plot the mean OD values against the serum dilution factor or calculate concentration from a standard curve. The endpoint titer is often defined as the highest dilution giving an OD above a predetermined cut-off (e.g., mean of negatives + 2 or 3 standard deviations).
Quantitative Data Presentation
Table 1: Typical Performance Characteristics of ELISA Formats
| Format | Sensitivity (Typical) | Specificity | Time Required | Complexity | Common Application |
|---|---|---|---|---|---|
| Direct | Moderate (ng/mL) | Moderate | Low (~2-3 hrs) | Low | Antigen screening, purified protein detection |
| Indirect | High (pg/mL - ng/mL) | High | Medium (~4-5 hrs) | Medium | Antibody detection (serology, immunogenicity) |
| Sandwich | Very High (pg/mL) | Very High | High (~5-6 hrs) | High | Cytokine quantification, biomarker analysis |
| Competitive | High (pg/mL - ng/mL) | High for small analytes | Medium (~4-5 hrs) | Medium | Hormone analysis, drug monitoring |
Table 2: Common Enzyme-Substrate Pairs in ELISA
| Enzyme | Substrate (Chromogenic) | Signal (Color) | Stop Solution | Detection Wavelength |
|---|---|---|---|---|
| Horseradish Peroxidase (HRP) | TMB (3,3',5,5'-Tetramethylbenzidine) | Blue → Yellow | Acid (e.g., H₂SO₄) | 450 nm |
| Horseradish Peroxidase (HRP) | ABTS (2,2'-Azinobis [3-ethylbenzothiazoline-6-sulfonic acid]) | Green | Acid or SDS | 405 nm, 410 nm |
| Alkaline Phosphatase (AP) | pNPP (p-Nitrophenyl Phosphate) | Yellow | NaOH (or none) | 405 nm, 415 nm |
Signaling Pathway and Workflow Visualizations
The Scientist's Toolkit: Key Research Reagent Solutions
Table 3: Essential ELISA Materials and Their Functions
| Reagent/Material | Primary Function | Key Considerations |
|---|---|---|
| Polystyrene Microplate | Solid phase for protein immobilization. | High-binding plates for antibodies/antigens; medium/low binding to reduce nonspecific adsorption. |
| Coating Buffer (Carbonate-Bicarbonate, pH 9.6) | Optimal pH for passive adsorption of proteins to plastic. | Ensures efficient and stable immobilization of capture biomolecule. |
| Blocking Agent (BSA, Casein, Non-fat Dry Milk) | Covers unsaturated binding sites on the plate to reduce nonspecific background signal. | Choice depends on application; BSA is standard, milk may contain interfering antibodies. |
| Wash Buffer (PBS with Tween 20) | Removes unbound reagents between steps; Tween 20 minimizes hydrophobic interactions. | Concentration of Tween (typically 0.05-0.1%) is critical for low background. |
| Detection Antibody Conjugates (HRP, AP) | Provides enzymatic activity for signal generation. | High specificity and low cross-reactivity are essential; stability of the conjugate is key. |
| Chromogenic Substrate (TMB, pNPP) | Enzyme substrate that yields a measurable color change upon catalysis. | Sensitivity, stability, and required incubation time vary. TMB is most common for HRP. |
| Microplate Spectrophotometer (Reader) | Precisely measures the Optical Density (OD) in each well. | Must be capable of reading at correct wavelength(s) and interfacing with data analysis software. |
The History and Evolution of ELISA in Biomedical Research
The Enzyme-Linked Immunosorbent Assay (ELISA) stands as a cornerstone technique in biomedical research and clinical diagnostics. Its development and continuous evolution have been instrumental in quantifying biomarkers, detecting pathogens, and advancing drug development. This whitepaper, framed within the context of a step-by-step guide to ELISA research, details the technical history, key methodological advances, and current protocols that define this indispensable tool.
Historical Timeline and Quantitative Milestones
The inception of ELISA is attributed to the independent work of two research groups in 1971: Engvall and Perlmann, and Van Weemen and Schuurs. Their work built upon the radioimmunoassay (RIA) but replaced the radioactive label with an enzyme, offering a safer and more stable detection system. The subsequent decades saw rapid proliferation and refinement of the methodology.
Table 1: Key Historical Milestones and Adoption Metrics
| Year | Milestone | Quantitative Impact/Adoption |
|---|---|---|
| 1971 | First description of ELISA (Engvall & Perlmann). | N/A (Foundational publication) |
| 1977 | First commercial ELISA kit marketed (for human chorionic gonadotropin). | Initiated the >$2B global ELISA kit market. |
| 1985 | Development of the sandwich ELISA for antigens. | Increased sensitivity to pg/mL range. |
| 1990s | Automation via microplate handlers and readers. | Increased throughput from ~40 to 1000+ samples/day. |
| 2000s | Advent of multiplexed ELISA (Luminex/xMAP technology). | Enabled simultaneous quantification of 1-500 analytes per well. |
| 2010s-Present | Digital ELISA (e.g., Simoa). | Achieved sensitivity 1000x greater than conventional ELISA (attomolar, aM, range). |
Core Methodologies and Protocols
The principle of ELISA involves immobilizing an antigen or antibody on a solid phase, followed by a series of binding and wash steps, culminating in an enzyme-mediated colorimetric, chemiluminescent, or fluorescent signal proportional to the target analyte.
Direct ELISA Protocol
Purpose: Rapid detection and quantification of a high-abundance antigen. Detailed Protocol:
- Coating: Dilute purified antigen in carbonate-bicarbonate coating buffer (pH 9.6). Add 100 µL/well to a 96-well microplate. Incubate overnight at 4°C.
- Washing: Aspirate and wash plate 3x with 300 µL/well of PBS containing 0.05% Tween-20 (PBST).
- Blocking: Add 200 µL/well of blocking buffer (e.g., 5% non-fat dry milk or 1% BSA in PBS). Incubate for 1-2 hours at room temperature (RT). Wash as in step 2.
- Detection: Add 100 µL/well of enzyme-conjugated primary antibody (diluted in blocking buffer). Incubate for 1-2 hours at RT. Wash as in step 2.
- Substrate Addition: Add 100 µL/well of appropriate enzyme substrate (e.g., TMB for HRP). Incubate for 10-30 minutes at RT in the dark.
- Stop & Read: Add 50 µL/well of stop solution (e.g., 1M H₂SO₄). Measure absorbance immediately at 450 nm using a microplate reader.
Indirect ELISA Protocol
Purpose: Detection of specific antibodies (e.g., in serum for immunogenicity studies). Detailed Protocol:
- Coating: Coat plate with 100 µL/well of antigen (1-10 µg/mL in coating buffer). Incubate and wash as in Direct ELISA steps 1-2.
- Blocking: Block as in Direct ELISA step 3.
- Primary Antibody Incubation: Add 100 µL/well of serial dilutions of test serum/antibody in blocking buffer. Include positive/negative controls. Incubate 1-2 hours at RT. Wash.
- Secondary Antibody Incubation: Add 100 µL/well of enzyme-conjugated species-specific secondary antibody (e.g., anti-human IgG-HRP). Incubate 1 hour at RT. Wash.
- Substrate, Stop, and Read: Proceed as in Direct ELISA steps 5-6.
Sandwich ELISA Protocol
Purpose: High-sensitivity quantification of complex antigens, especially proteins, in biological samples. Detailed Protocol:
- Capture Antibody Coating: Coat plate with 100 µL/well of a capture antibody (2-10 µg/mL in coating buffer). Incubate overnight at 4°C. Wash.
- Blocking: Block as in Direct ELISA step 3.
- Sample Incubation: Add 100 µL/well of standard antigen dilutions or test samples (diluted in blocking buffer). Incubate 2 hours at RT or overnight at 4°C. Wash.
- Detection Antibody Incubation: Add 100 µL/well of a biotin-conjugated detection antibody (specific to a different epitope on the antigen). Incubate 1-2 hours at RT. Wash.
- Streptavidin-Enzyme Conjugate Incubation: Add 100 µL/well of Streptavidin-HRP (diluted per manufacturer's instructions). Incubate 30 minutes at RT. Wash.
- Substrate, Stop, and Read: Proceed as in Direct ELISA steps 5-6.
Visualization of ELISA Workflow and Evolution
Title: Historical Evolution of ELISA Technology
Title: Generic Core Workflow of an ELISA
The Scientist's Toolkit: Key Research Reagent Solutions
Table 2: Essential Materials for ELISA Research
| Reagent/Material | Function & Critical Role |
|---|---|
| Polystyrene Microplates | Solid phase for protein adsorption. High-binding plates are treated for optimal antibody/antigen immobilization. |
| Coating Buffer (Carbonate-Bicarbonate, pH 9.6) | Alkaline buffer that promotes passive adsorption of proteins to the plastic surface via hydrophobic interactions. |
| Wash Buffer (PBS with 0.05% Tween-20, PBST) | Removes unbound reagents. The detergent Tween-20 minimizes non-specific binding. |
| Blocking Agents (BSA, Casein, Non-Fat Dry Milk) | Saturates remaining protein-binding sites on the plate and antibody Fc receptors to prevent false positive signals. |
| Primary & Capture Antibodies | Provide specificity. Must be validated for ELISA (low cross-reactivity). Paired antibodies for sandwich ELISA must recognize non-overlapping epitopes. |
| Enzyme Conjugates (HRP, AP) | Enzymes linked to detection antibodies or streptavidin. Catalyze the conversion of substrate to detectable product. Horseradish Peroxidase (HRP) is most common. |
| Chromogenic/Luminescent Substrates (TMB, OPD, AMPLIFY) | Enzyme substrates yielding a colored (TMB) or light-emitting product. Signal intensity is proportional to analyte amount. |
| Microplate Spectrophotometer/Luminometer | Instrument for quantifying absorbance, fluorescence, or luminescence from each well, enabling data generation. |
| Reference Standards & Controls | Calibrated antigen standards for generating a quantitative standard curve. Positive/Negative controls are essential for assay validation. |
This whitepaper details the core biochemical principle underpinning the Enzyme-Linked Immunosorbent Assay (ELISA), situated within a comprehensive thesis on step-by-step ELISA research. We examine the specificity of antibody-antigen binding, the amplification provided by enzyme conjugates, and the quantitative detection of target analytes. This guide provides researchers, scientists, and drug development professionals with in-depth technical knowledge, current protocols, and essential tools to optimize assay development and data interpretation.
The antibody-antigen interaction is a precise, lock-and-key molecular recognition event driven by non-covalent forces (hydrogen bonds, ionic interactions, Van der Waals forces, hydrophobic effects). This high specificity enables the selective capture and detection of a target analyte (antigen) from a complex biological matrix. In ELISA, this interaction is coupled with an enzyme reporter system (e.g., Horseradish Peroxidase - HRP, Alkaline Phosphatase - ALP). The enzyme catalyzes the conversion of a colorless substrate into a colored, fluorescent, or chemiluminescent product, providing significant signal amplification and enabling precise quantification.
Quantitative Parameters of the Interaction
The strength and kinetics of the antibody-antigen interaction are defined by several key parameters, crucial for assay optimization.
Table 1: Key Quantitative Parameters of Antibody-Antigen Interaction
| Parameter | Definition | Typical Range (for monoclonal antibodies) | Impact on ELISA Design |
|---|---|---|---|
| Affinity (K_D) | Equilibrium dissociation constant. Concentration of antigen at which half the antibody binding sites are occupied. | 10^-7 to 10^-11 M | Lower K_D (higher affinity) increases sensitivity and reduces assay time. |
| Association Rate (k_on) | Rate constant for antibody-antigen complex formation. | 10^3 to 10^7 M^-1s^-1 | Faster k_on improves capture efficiency in kinetic/video ELISA formats. |
| Dissociation Rate (k_off) | Rate constant for breakdown of the antibody-antigen complex. | 10^-1 to 10^-6 s^-1 | Slower k_off (higher stability) is critical for rigorous wash steps. |
| Avidity | Functional binding strength of multivalent interactions (e.g., polyclonal antibodies). | N/A (collective effect) | Enhances effective affinity and robustness, especially for sandwich ELISAs. |
Detailed Experimental Protocol: Sandwich ELISA
This protocol exemplifies the application of the core principle for detecting a protein antigen at high specificity and sensitivity.
A. Materials & Coating
- Coating: Dilute capture antibody in carbonate-bicarbonate buffer (50 mM, pH 9.6) to 1-10 µg/mL. Add 100 µL/well to a 96-well polystyrene microplate.
- Incubation: Seal plate and incubate overnight at 4°C or 1-2 hours at 37°C.
- Washing: Aspirate liquid and wash plate 3x with 300 µL/well of PBS containing 0.05% Tween-20 (PBST). Blot dry on absorbent paper.
B. Blocking
- Add 200-300 µL/well of blocking buffer (e.g., 1-5% BSA or non-fat dry milk in PBST).
- Incubate for 1-2 hours at room temperature (RT).
- Wash as in Step A.3.
C. Antigen Incubation
- Prepare serial dilutions of the antigen standard in sample diluent (blocking buffer).
- Add 100 µL of standards, test samples, and controls per well.
- Incubate for 2 hours at RT or overnight at 4°C.
- Wash as in Step A.3.
D. Detection Antibody Incubation
- Dilute biotin- or enzyme-conjugated detection antibody in blocking buffer to manufacturer's specification.
- Add 100 µL/well.
- Incubate for 1-2 hours at RT.
- Wash as in Step A.3. (For indirect detection, use a secondary antibody-conjugate in this step).
E. Enzyme Conjugate Incubation (if using biotin-streptavidin system)
- Dilute Streptavidin-HRP (or ALP) in blocking buffer.
- Add 100 µL/well.
- Incubate for 30-60 minutes at RT, protected from light.
- Wash as in Step A.3.
F. Substrate Development & Signal Detection
- For HRP: Prepare TMB substrate. Add 100 µL/well. Incubate for 5-30 minutes in the dark until blue color develops.
- For ALP: Prepare pNPP substrate. Add 100 µL/well. Incubate for 15-60 minutes in the dark.
- Stop Reaction (for TMB): Add 50-100 µL of 1M H2SO4 or 2M H2SO4. Solution turns yellow.
- Read Absorbance: Measure immediately. HRP/TMB: 450 nm (reference 570/620 nm). ALP/pNPP: 405-410 nm.
G. Data Analysis
- Generate a standard curve by plotting the mean absorbance (y-axis) against antigen concentration (x-axis) using a 4- or 5-parameter logistic (4PL/5PL) curve fit.
- Interpolate unknown sample concentrations from the standard curve.
Signaling & Workflow Visualization
Diagram 1: Core ELISA Step-by-Step Workflow
Diagram 2: Enzyme-Substrate Signal Amplification
The Scientist's Toolkit: Essential Research Reagent Solutions
Table 2: Key Reagents for ELISA Development
| Reagent / Material | Function & Rationale | Critical Considerations |
|---|---|---|
| High-Affinity Matched Antibody Pair | Monoclonal or affinity-purified polyclonal antibodies targeting non-overlapping epitopes on the antigen. | Defines assay specificity, sensitivity, and dynamic range. Must be validated for lack of cross-reactivity. |
| Recombinant Antigen Standard | Purified antigen of known concentration for generating the standard curve. | Must be identical to native analyte. Lyophilized stocks require accurate reconstitution and aliquoting. |
| Blocking Agent (BSA, Casein) | Saturates non-specific protein-binding sites on the plate and in sample matrices to reduce background noise. | Choice affects background and can interfere with some antibody-antigen pairs (e.g., milk with biotin/phospho-specific antibodies). |
| Detection Enzyme Conjugate (HRP/ALP) | Covalently linked to detection antibody or streptavidin. Provides catalytic signal amplification. | HRP is more common; sensitive to sodium azide. ALP offers high turnover but is susceptible to phosphate inhibition. |
| Chromogenic Substrate (TMB/pNPP) | Enzyme substrate that yields a measurable color change upon catalysis. | TMB (for HRP) is sensitive, safe, and has a defined stop point. pNPP (for ALP) yields a stable yellow color. |
| Wash Buffer with Surfactant (e.g., PBST) | Removes unbound reagents while maintaining assay conditions. Tween-20 reduces non-specific binding. | Concentration of Tween-20 (typically 0.05-0.1%) is critical; too high can disrupt specific binding. |
| Low-Binding Microplates | Polystyrene plates specially treated for optimal protein adsorption (for capture) or to minimize it (for competitive assays). | Plate uniformity is essential for reproducibility. Choice of plate color (clear, white for luminescence) depends on detection mode. |
| Precision Liquid Handling Tools | Multi-channel pipettes, automated washers, and dispensers. | Ensure reproducibility of reagent addition and washing efficiency, which are paramount for robust, high-precision data. |
Within the comprehensive thesis of an ELISA step-by-step guide research, the performance and outcome of the assay are fundamentally dictated by the quality and precise application of its core components. This whitepaper provides an in-depth technical analysis of these essential elements—plates, antibodies, antigens, conjugates, substrates, and buffers—framing them as the foundational pillars of robust immunoassay development for researchers, scientists, and drug development professionals.
Core Components: Technical Specifications and Functions
Microplates
The solid phase is the physical foundation of the ELISA.
Table 1: Microplate Selection Guide
| Plate Type | Material | Binding Mechanism | Optimal For | Typical Binding Capacity (ng/cm²) |
|---|---|---|---|---|
| Standard ELISA | Polystyrene (PS) | Passive, hydrophobic | Proteins, large antigens | 200-500 |
| High-Binding | PS, modified surface | Enhanced ionic/hydrophobic | Low-abundance targets, small peptides | 400-600 |
| Streptavidin-Coated | PS, pre-coated | Biotin-streptavidin affinity | Biotinylated capture molecules | N/A (pre-coated) |
| Covalently Linkable | PS, activated (e.g., NHS) | Covalent bonding | Specific orientation, unstable molecules | Varies by chemistry |
Protocol 2.1: Plate Coating Optimization.
- Objective: To determine the optimal antigen/antibody concentration for plate coating.
- Materials: Antigen or capture antibody, coating buffer (e.g., 0.1 M Carbonate-Bicarbonate, pH 9.6), blocking buffer, microplate.
- Method:
- Prepare a 2-fold serial dilution of the capture molecule in coating buffer across a plate row (e.g., 10 µg/mL to 0.08 µg/mL).
- Add 100 µL per well. Incubate sealed plate overnight at 4°C or 1-2 hours at 37°C.
- Discard solution. Wash 3x with wash buffer (e.g., PBS + 0.05% Tween-20).
- Block with 200-300 µL blocking buffer (e.g., 1-5% BSA or casein in PBS) for 1-2 hours at RT.
- Proceed with standard ELISA steps. The well with the highest signal-to-noise ratio identifies the optimal coating concentration.
Antibodies and Antigens
The specificity of ELISA is governed by the antibody-antigen interaction.
Table 2: Antibody Pair Characteristics for Sandwich ELISA
| Parameter | Capture Antibody | Detection Antibody | Considerations |
|---|---|---|---|
| Specificity | Monoclonal (preferred) | Monoclonal or Polyclonal | Must recognize distinct, non-overlapping epitopes on the antigen. |
| Affinity | High (>10⁹ M⁻¹) | High (>10⁹ M⁻¹) | Minimizes dissociation during washes. |
| Conjugation | Unconjugated | Conjugated to enzyme (HRP/ALP) or biotin | Direct vs. indirect detection impacts signal amplification. |
| Typical Working Concentration | 1-10 µg/mL in coating buffer | 0.5-2 µg/mL in assay diluent | Must be empirically titrated. |
Conjugates
Conjugates link the immunocomplex to a detectable signal.
Table 3: Common Enzyme Conjugates in ELISA
| Enzyme | Common Conjugate | Advantages | Disadvantages | Typical Working Dilution |
|---|---|---|---|---|
| Horseradish Peroxidase (HRP) | Anti-species IgG-HRP, Streptavidin-HRP | High turnover rate, small size, multiple chromogenic/chemiluminescent substrates. | Inhibited by sodium azide, thiols; less stable than ALP. | 1:2000 to 1:10000 |
| Alkaline Phosphatase (ALP) | Anti-species IgG-ALP, Streptavidin-ALP | Very stable, not inhibited by azide, good for high background phosphate samples. | Larger size, slower turnover rate than HRP. | 1:1000 to 1:5000 |
Substrates
Substrates are converted by the enzyme-conjugate to produce a measurable signal.
Table 4: Common ELISA Substrate Characteristics
| Enzyme | Substrate Type | Example | Signal | Detection Wavelength | Sensitivity |
|---|---|---|---|---|---|
| HRP | Colorimetric (TMB) | 3,3',5,5'-Tetramethylbenzidine | Blue -> Yellow (Stop) | 450 nm (read), 620 nm (ref) | High (pg/mL) |
| HRP | Colorimetric (ABTS) | 2,2'-Azinobis [3-ethylbenzothiazoline-6-sulfonic acid] | Green | 405 nm, 410 nm | Moderate |
| HRP | Chemiluminescent | Luminol + H₂O₂ + Enhancer | Light | Luminometer | Very High (fg/mL) |
| ALP | Colorimetric (pNPP) | p-Nitrophenyl Phosphate | Yellow | 405 nm | Moderate |
| ALP | Chemiluminescent | CDP-Star, CSPD | Light | Luminometer | Very High |
Protocol 2.4: Substrate Kinetic Read.
- Objective: To determine the optimal development time for a colorimetric substrate.
- Materials: Prepared ELISA plate post-conjugate incubation, TMB substrate solution, stop solution (1M H₂SO₄ or HCl), plate reader.
- Method:
- After final wash, add substrate (100 µL/well) simultaneously using a multichannel pipette. Start a timer.
- Place plate in pre-warmed reader (e.g., 25°C or 37°C).
- Measure absorbance (e.g., 650 nm for TMB kinetic read, or 450 nm after stopping) every 30-60 seconds for 15-20 minutes.
- Plot signal vs. time for positive and negative controls. The optimal development time is within the linear increase phase for the positive control, before the negative control shows significant increase.
Buffers
Buffers maintain pH, ionic strength, and stability throughout the assay.
Table 5: Critical ELISA Buffers and Formulations
| Buffer | Primary Function | Key Components (Example) | Typical pH | Incubation Time/Volume |
|---|---|---|---|---|
| Coating Buffer | Immobilize capture molecule | 0.1 M Carbonate-Bicarbonate, or 0.1 M PBS | 9.6 (carbonate) or 7.4 (PBS) | Overnight, 4°C, 100 µL/well |
| Wash Buffer | Remove unbound material | PBS + 0.05% (v/v) Tween 20 (PBST) | 7.4 | 3-5 washes, 300 µL/well |
| Blocking Buffer | Cover unoccupied sites | 1-5% BSA or Casein in PBS or PBST | 7.4 | 1-2 hrs, RT, 200-300 µL/well |
| Assay/Diluent Buffer | Dilute samples & reagents | Blocking buffer + 0.05% Tween 20 | 7.4 | 1 hr, RT or 37°C, 100 µL/well |
| Stop Solution | Terminate enzyme reaction | 1M H₂SO₄ (for HRP/TMB), 0.5M EDTA (for ALP/pNPP) | <2.0 | 50-100 µL/well |
Visualizing ELISA Workflow and Signal Generation
Diagram Title: Stepwise Schematic of a Sandwich ELISA Workflow
Diagram Title: HRP-TMB Signal Generation Pathway
The Scientist's Toolkit: Key Research Reagent Solutions
Table 6: Essential ELISA Reagents and Materials
| Item / Solution | Primary Function | Key Considerations & Examples |
|---|---|---|
| High-Binding Microplates | Solid-phase support for immobilization. | Choose clear, flat-bottom for colorimetric; white/black for chemiluminescent. Material: Polystyrene. |
| Matched Antibody Pair | Specific capture and detection of analyte. | Validate pair for lack of cross-reactivity. Use monoclonal for capture. |
| Recombinant/Purified Antigen | Standard curve generation, assay optimization. | Critical for quantifying unknown samples. Must be identical to native form if possible. |
| Enzyme-Conjugated Detection Reagent | Links immunocomplex to detectable signal. | Streptavidin-HRP for biotinylated Abs. Anti-species-HRP/ALP for indirect detection. |
| Chromogenic/Chemiluminescent Substrate | Generates measurable signal upon enzymatic catalysis. | TMB (HRP) and pNPP (ALP) are common colorimetric. Luminol-based for high-sensitivity HRP assays. |
| Assay-Specific Buffers | Maintain optimal pH, ionic strength, and block nonspecific binding. | Must be prepared with high-purity water and filtered (0.22 µm). Avoid azide with HRP conjugates. |
| Plate Sealer & Washer | Prevent evaporation during incubation; ensure consistent washing. | Adhesive seals; automated or manual washer with calibrated dispensing. |
| Microplate Reader | Quantify absorbance, fluorescence, or luminescence. | Filter-based or monochromator-based spectrophotometer. Must match substrate output (e.g., 450 nm for TMB). |
Within the broader thesis on a step-by-step guide to ELISA research, understanding the fundamental assay formats is critical. The Enzyme-Linked Immunosorbent Assay (ELISA) remains a cornerstone technique in life science research, diagnostics, and drug development for detecting and quantifying proteins, peptides, antibodies, and hormones. The choice of format—Direct, Indirect, Sandwich, or Competitive—dictates the experimental workflow, sensitivity, specificity, and application. This technical guide provides an in-depth comparison of these four core methodologies, detailing their principles, protocols, and optimal use cases.
Each ELISA format is characterized by the sequence of binding events between the target analyte, capture molecules, and detection molecules. The key differentiating factor is whether the primary detection antibody is labeled (direct) or unlabeled (indirect, sandwich, competitive), and whether the analyte itself is captured or competes with a reference.
Table 1: Core Characteristics of Major ELISA Formats
| Format | Key Principle | Typical Steps | Primary Advantage | Primary Disadvantage |
|---|---|---|---|---|
| Direct | Labeled primary antibody binds directly to immobilized antigen. | 1. Antigen coat.2. Block.3. Incubate with enzyme-conjugated primary antibody.4. Detect. | Speed; minimal steps; reduces cross-reactivity from secondary antibody. | Low signal amplification; requires labeling of every primary antibody. |
| Indirect | Unlabeled primary antibody binds antigen; enzyme-conjugated secondary antibody binds primary. | 1. Antigen coat.2. Block.3. Incubate with primary antibody.4. Incubate with enzyme-conjugated secondary antibody.5. Detect. | High signal amplification; flexibility (one labeled secondary can be used for many primaries). | Potential for cross-reactivity; extra incubation step. |
| Sandwich | Capture antibody immobilizes antigen; detection antibody (often with enzyme) binds a different epitope. | 1. Capture antibody coat.2. Block.3. Incubate with sample/antigen.4. Incubate with detection antibody (Direct) or primary + secondary (Indirect).5. Detect. | High specificity (two antibodies); suitable for complex samples; excellent sensitivity. | Requires two antibodies against different epitopes; optimization can be complex. |
| Competitive | Sample analyte and labeled reference analyte compete for a limited number of antibody binding sites. | 1. Antibody (or antigen) coat.2. Block.3. Co-incubate sample and labeled reference.4. Detect (Inverse signal: more sample = less signal). | Ideal for small antigens or haptens; less susceptible to sample matrix effects. | Inverse signal curve can be counter-intuitive; dynamic range may be limited. |
Table 2: Quantitative Performance Comparison
| Parameter | Direct ELISA | Indirect ELISA | Sandwich ELISA | Competitive ELISA |
|---|---|---|---|---|
| Assay Time | ~2-3 hours | ~3-4 hours | ~4-5 hours | ~2-3 hours |
| Sensitivity | Low (ng-µg/mL) | Moderate (pg-ng/mL) | High (fg-pg/mL) | Moderate (pg-ng/mL) |
| Specificity | Moderate | High | Very High | High |
| Sample Type Flexibility | Low | Moderate | High (can tolerate impurities) | High (for small analytes) |
| Cost & Reagent Demand | Low (fewer reagents) | Moderate | High (two antibodies) | Moderate |
Detailed Methodologies and Protocols
Direct ELISA Protocol
Application: Best for quick, initial assessment of high-concentration antigen or antibody- antigen interactions. Detailed Protocol:
- Coating: Dilute purified antigen in carbonate-bicarbonate coating buffer (pH 9.6) to 1-10 µg/mL. Add 100 µL per well to a 96-well microplate. Incubate overnight at 4°C or 1-2 hours at 37°C.
- Washing: Aspirate liquid and wash plate 3x with 300 µL PBS-T (PBS + 0.05% Tween-20) per well using a plate washer or manual pipetting.
- Blocking: Add 200-300 µL of blocking buffer (e.g., 5% non-fat dry milk or 3% BSA in PBS-T) per well. Incubate for 1-2 hours at room temperature (RT). Wash 3x.
- Primary Antibody Incubation: Add 100 µL of enzyme-conjugated primary antibody (diluted in blocking buffer as per manufacturer's recommendation) to each well. Incubate for 1-2 hours at RT. Wash 3-5x thoroughly.
- Detection: Add 100 µL of appropriate substrate solution (e.g., TMB for HRP, pNPP for AP). Incubate for 5-30 minutes at RT, protected from light.
- Stop & Read: Add 50-100 µL of stop solution (e.g., 1M H2SO4 for TMB). Immediately measure absorbance at the appropriate wavelength (e.g., 450nm for TMB) using a plate reader.
Indirect ELISA Protocol
Application: Ideal for screening serum samples for specific antibodies (e.g., immunogenicity testing, serology). Detailed Protocol:
- Coating & Blocking: As per Direct ELISA steps 1-3.
- Primary Antibody Incubation: Add 100 µL of unlabeled, specific primary antibody (or test serum sample) diluted in blocking buffer. Incubate 1-2 hours at RT. Wash 3x.
- Secondary Antibody Incubation: Add 100 µL of enzyme-conjugated secondary antibody (e.g., anti-species IgG-HRP) diluted in blocking buffer. Incubate 1 hour at RT. Wash 3-5x thoroughly.
- Detection, Stop & Read: As per Direct ELISA steps 5-6.
Sandwich ELISA Protocol
Application: The gold standard for quantitating specific antigens in complex biological samples (cell lysates, serum, culture supernatant). Detailed Protocol:
- Capture Antibody Coating: Dilute the capture antibody in coating buffer (1-10 µg/mL). Add 100 µL per well and incubate as in step 3.1.1. Wash.
- Blocking: Block with 5% BSA in PBS-T for 1-2 hours at RT. Wash.
- Sample/Antigen Incubation: Add 100 µL of sample or antigen standard (diluted in blocking buffer or sample diluent) to wells. Incubate 2 hours at RT or overnight at 4°C for maximum sensitivity. Wash 3x.
- Detection Antibody Incubation: Add 100 µL of biotin-conjugated or enzyme-conjugated detection antibody (specific to a different epitope on the antigen) diluted in blocking buffer. Incubate 1-2 hours at RT. Wash 3x. (For indirect detection, use an unlabeled detection antibody followed by an enzyme-conjugated tertiary antibody).
- Signal Amplification (If using biotin): Add 100 µL of streptavidin-HRP conjugate. Incubate 30 minutes at RT. Wash 3-5x.
- Detection, Stop & Read: As per Direct ELISA steps 5-6.
Competitive ELISA Protocol
Application: Essential for measuring small molecules (hormones, drugs) or antigens with only one epitope. Detailed Protocol (Antigen-Coated Format):
- Coating & Blocking: Coat plate with purified antigen (known concentration). Block as described previously.
- Competitive Incubation: Prepare a mixture containing a constant amount of enzyme-conjugated primary antibody and varying concentrations of the unlabeled sample antigen (standard or unknown). Add 100 µL of this mixture to each well. Incubate 1-2 hours at RT. The conjugated antibody binds to either the immobilized antigen (plate) or the free antigen (sample). Higher sample antigen concentration reduces plate binding.
- Washing: Wash plate thoroughly 3-5x to remove all unbound antibody.
- Detection, Stop & Read: As per Direct ELISA steps 5-6. The signal is inversely proportional to the analyte concentration in the sample.
Visualizing ELISA Workflows
Four Major ELISA Format Workflows
The Scientist's Toolkit: Essential Research Reagent Solutions
Table 3: Key Reagents and Materials for ELISA
| Reagent / Material | Function & Description | Common Examples / Notes |
|---|---|---|
| Microplate | Solid-phase support for immobilizing biomolecules. | 96-well polystyrene plates (high binding capacity). |
| Coating Buffer | Provides optimal pH and ionic strength for passive adsorption of proteins to the plate. | Carbonate-Bicarbonate buffer (pH 9.6). |
| Wash Buffer | Removes unbound materials; detergent reduces non-specific binding. | PBS or Tris-based buffer with 0.05-0.1% Tween-20 (PBS-T). |
| Blocking Buffer | Saturates remaining protein-binding sites on the plate to prevent false positives. | 1-5% BSA, 5% non-fat dry milk, or proprietary protein solutions in wash buffer. |
| Primary Antibody | Binds specifically to the target antigen (unlabeled for indirect/sandwich; labeled for direct/competitive). | Monoclonal (high specificity) or polyclonal (high affinity). Must be validated for ELISA. |
| Secondary Antibody (Conjugated) | Binds to the primary antibody species/isotype; conjugated enzyme provides detection signal. | Anti-species IgG-HRP or -AP. Critical for indirect and sandwich formats. |
| Detection Antibody | In sandwich ELISA, binds a second epitope on the captured antigen. | Often biotinylated for amplification with streptavidin-enzyme. |
| Enzyme Conjugate | Catalyzes conversion of substrate to detectable product. Common enzymes are HRP and AP. | HRP (Horseradish Peroxidase) or AP (Alkaline Phosphatase). |
| Substrate | Chromogenic or chemiluminescent compound converted by the enzyme. | TMB (3,3',5,5'-Tetramethylbenzidine) for HRP; pNPP (p-Nitrophenyl Phosphate) for AP. |
| Stop Solution | Halts the enzyme-substrate reaction, stabilizing the final signal. | 1M Sulfuric Acid (for TMB), 3M NaOH (for pNPP). |
| Plate Reader | Instrument to measure the intensity of the colorimetric, fluorescent, or luminescent signal. | Spectrophotometer (for absorbance, e.g., 450nm for TMB). |
Selecting the appropriate ELISA format is a foundational decision in assay design. Direct ELISA offers simplicity, Indirect provides amplification and flexibility, Sandwich delivers superior specificity and sensitivity for proteins, and Competitive is indispensable for small molecules. Within the comprehensive ELISA research guide, this breakdown enables researchers and drug developers to systematically choose, optimize, and execute the correct format for their specific quantitation goals, ensuring robust and reliable data generation.
This guide, part of a comprehensive thesis on ELISA research, provides a structured framework for selecting the optimal immunoassay format based on the biochemical characteristics of your target analyte. The choice between direct, indirect, sandwich, and competitive ELISA formats profoundly impacts assay sensitivity, specificity, and dynamic range.
Key ELISA Formats and Selection Criteria
The selection hinges on the analyte's molecular weight, epitope availability, and the necessity for signal amplification.
Diagram 1: ELISA Format Decision Workflow (100 chars)
Comparative Performance Metrics of ELISA Formats
The table below summarizes the quantitative performance characteristics of each core format, based on recent literature and technical data sheets (2023-2024).
| Format | Typical Sensitivity Range | Dynamic Range (Log) | Time to Result | Key Advantage | Primary Limitation |
|---|---|---|---|---|---|
| Direct | 0.5 - 5 ng/mL | 2 - 3 | ~2 hours | Speed, minimal steps | Low signal, no amplification |
| Indirect | 0.1 - 1 ng/mL | 3 - 4 | ~3 hours | High signal, flexible 2° Abs | Non-specific binding risk |
| Sandwich | 0.01 - 0.1 pg/mL | 3 - 5 | ~4 hours | Exceptional specificity/sensitivity | Requires two epitopes |
| Competitive | 0.1 - 10 ng/mL | 2 - 3 | ~2.5 hours | Ideal for small molecules | Inverse signal relationship |
Experimental Protocols for Key Formats
Protocol 1: Standard Sandwich ELISA for Cytokine Quantification
This protocol is optimal for large analytes (e.g., IL-6, TNF-α) with multiple epitopes.
- Coating: Dilute capture antibody in 0.1 M carbonate-bicarbonate buffer (pH 9.6) to 2-4 µg/mL. Add 100 µL/well to a high-binding 96-well plate. Seal and incubate overnight at 4°C.
- Blocking: Aspirate coating solution. Wash plate 3x with 300 µL/well PBS + 0.05% Tween-20 (PBST). Add 300 µL/well blocking buffer (1% BSA or 5% non-fat dry milk in PBS). Incubate for 1-2 hours at room temperature (RT). Wash 3x with PBST.
- Sample & Standard Incubation: Prepare analyte standard in assay buffer (PBS, 0.5% BSA, 0.05% Tween-20, pH 7.4). Add 100 µL of standard or sample per well. Incubate for 2 hours at RT or overnight at 4°C. Wash 5x with PBST.
- Detection Antibody Incubation: Dilute biotinylated detection antibody in assay buffer. Add 100 µL/well. Incubate for 1-2 hours at RT. Wash 5x with PBST.
- Streptavidin-Enzyme Conjugate: Dilute Streptavidin-HRP in assay buffer. Add 100 µL/well. Incubate for 30-60 minutes at RT, protected from light. Wash 5-7x with PBST.
- Substrate Development: Add 100 µL/well of TMB substrate. Incubate for 5-30 minutes at RT until color develops.
- Stop & Read: Add 50 µL/well of 2N H₂SO₄ to stop the reaction. Read absorbance immediately at 450 nm (reference 570 nm or 620 nm).
Protocol 2: Competitive ELISA for Small Molecule Detection (e.g., Steroids, Mycotoxins)
This protocol is suited for haptens or analytes with a single epitope.
- Coating: Dilute antigen conjugate (e.g., drug-protein conjugate) in coating buffer to 1-2 µg/mL. Coat plate as in Protocol 1, Step 1.
- Blocking: Perform blocking as in Protocol 1, Step 2.
- Competitive Reaction: Pre-mix a constant concentration of primary antibody with serially diluted standard or sample. Use assay buffer for dilutions. Incubate for 30-60 minutes at RT to allow analyte-antibody binding equilibrium. Transfer 100 µL of the mixture to each coated well. Incubate for 30-60 minutes at RT. Wash 5x with PBST.
- Secondary Antibody Incubation: Add 100 µL/well of enzyme-conjugated secondary antibody (species-specific). Incubate for 1 hour at RT. Wash 5x with PBST.
- Development & Read: Perform development and reading as in Protocol 1, Steps 6-7. Note: The signal is inversely proportional to the analyte concentration.
Signaling Pathways in ELISA Detection
The final detection step leverages enzymatic amplification. The diagram below illustrates the common HRP-TMB reaction pathway.
Diagram 2: HRP-TMB Chromogenic Detection Pathway (99 chars)
The Scientist's Toolkit: Essential Research Reagent Solutions
| Reagent/Material | Primary Function | Key Considerations |
|---|---|---|
| High-Binding Polystyrene Plates | Solid phase for antibody/antigen immobilization. | Optimal for proteins >10 kDa; use medium binding for hydrophobic targets. |
| Capture & Detection Antibody Pair | Provide assay specificity. Must recognize non-overlapping epitopes. | Validate pair for lack of cross-reactivity; recommend monoclonal antibodies. |
| Biotin-Streptavidin System | Signal amplification system. Biotin on detection Ab binds multiple enzyme-linked streptavidin molecules. | Amplifies signal 5-10x over direct conjugation; may increase background. |
| HRP or AP Enzyme Conjugates | Catalyzes colorimetric, chemiluminescent, or fluorescent signal generation. | HRP: higher specific activity; AP: more stable, linear kinetics. |
| TMB (3,3',5,5'-Tetramethylbenzidine) | Chromogenic substrate for HRP. Yields blue product oxidizable to yellow. | Sensitive, low-background; preferred for HRP-based colorimetric ELISA. |
| Blocking Agent (BSA, Casein, Serum) | Covers non-specific protein-binding sites on plate to reduce background. | Match to sample matrix; BSA is universal; casein reduces hydrophobic interactions. |
| Wash Buffer (PBST/TBST) | Removes unbound reagents; Tween-20 minimizes non-specific binding. | Critical for low background; 0.05% Tween-20 standard; ensure full aspiration. |
| Microplate Reader | Measures absorbance of the developed color in each well. | Must have appropriate filters (e.g., 450 nm for TMB). |
This guide is an integral chapter of a comprehensive step-by-step ELISA research methodology. The performance, specificity, and reproducibility of any Enzyme-Linked Immunosorbent Assay (ELISA) are fundamentally governed by the quality and appropriate application of its critical reagents. Within the assay architecture, these reagents form the core molecular toolkit that translates an unknown analyte concentration into a quantifiable signal. This whitepaper provides an in-depth technical analysis of four pillars: capture antibodies, detection antibodies, standards, and controls. Their precise selection, characterization, and use are non-negotiable for generating robust, reliable, and regulatory-compliant data in research and drug development.
Core Reagent Definitions and Functional Roles
Capture and Detection Antibodies: The Specificity Duo
The antibody pair is the heart of a sandwich ELISA, determining its specificity and sensitivity.
- Capture Antibody: Immobilized on the solid phase (microplate well), this antibody is responsible for the initial specific binding and isolation of the target analyte from the sample matrix. It dictates the assay's foundational specificity.
- Detection Antibody: Binds to a distinct epitope on the captured analyte, forming the "sandwich." It is conjugated to a reporter enzyme (e.g., HRP, ALP) or a tag (e.g., biotin) for signal generation. It influences assay sensitivity and dynamic range.
Key Selection Criteria:
| Parameter | Capture Antibody | Detection Antibody | Optimal Configuration |
|---|---|---|---|
| Affinity | High (>1 nM) | Very High (sub-nM) | High affinity for both minimizes dissociation. |
| Specificity | Must recognize native, non-denatured protein. | Must recognize a different, accessible epitope. | Epitopes should be non-overlapping and spatially separate. |
| Clonality | Monoclonal preferred for consistency. | Monoclonal (consistent) or high-affinity polyclonal (signal amplification). | Monoclonal/Monoclonal pair offers highest specificity. |
| Format | Typically unlabeled, purified IgG or affinity-purified. | Conjugated to enzyme (direct) or biotin (indirect via streptavidin-enzyme). | Biotin-streptavidin amplification can increase sensitivity. |
| Binding Kinetic (K_D) | < 5 nM | < 1 nM | Lower K_D values correlate with better low-end sensitivity. |
Standards: The Quantification Ruler
The standard curve is the reference for interpolating sample concentrations. It must be meticulously prepared to ensure accuracy.
- Composition: A known, highly purified preparation of the analyte in a matrix that closely mimics the sample (e.g., assay buffer, diluted serum, cell culture medium).
- Traceability: For regulated work, standards should be traceable to an international reference material (e.g., WHO Standard).
- Preparation Protocol: A serial dilution from a top concentration (exceeding the expected maximum sample concentration) is performed. A minimum of 5-7 non-zero points is standard.
Detailed Standard Curve Preparation Protocol:
- Reconstitution: Reconstitute the lyophilized standard according to the Certificate of Analysis using the specified diluent.
- Primary Stock: Vortex thoroughly for 30 seconds and allow to equilibrate for 15 minutes.
- Serial Dilution: Perform a log-scale serial dilution in the designated assay diluent buffer. Use low protein-binding tubes.
- Dilution Scheme Example: Prepare a 1:4 serial dilution series: 1000 pg/mL → 250 pg/mL → 62.5 pg/mL → 15.6 pg/mL → 3.9 pg/mL → 0.98 pg/mL → 0 pg/mL (Blank).
- Plate Loading: Load duplicates or triplicates of each standard concentration alongside samples.
Controls: The Assay Guardians
Controls validate each assay run, monitoring performance, accuracy, and precision.
| Control Type | Purpose | Composition & Acceptance Criteria |
|---|---|---|
| Blank | Measures background signal from reagents (substrate, plate). | Assay diluent only. Signal should be < 10% of the low standard. |
| Zero Standard (S0) | Specific background for the standard curve matrix. | The "0" concentration point of the standard dilution series. |
| Quality Controls (QCs) | Monitor inter-assay precision and accuracy. | Three levels (Low, Mid, High) in relevant matrix. Pre-assigned target mean ± 20% CV. |
| Positive Control | Confirms the assay is functional. | A known positive sample or a spiked sample with recoverable analyte. |
| Negative Control | Confirms assay specificity (lack of cross-reactivity). | A matrix known to be devoid of the target analyte. |
| Plate Controls (H/L) | Monitor edge effects, incubation uniformity. | High and Low signal controls placed at plate corners. |
Critical Characterization Protocols
Antibody Pair Epitope Binning (Cross-Blocking ELISA)
Objective: To empirically confirm that capture and detection antibodies bind to non-overlapping epitopes.
Protocol:
- Coat plate with capture antibody (2-5 µg/mL) overnight at 4°C.
- Block plate (1-2 hours, RT).
- Pre-incubate a fixed, saturating concentration of the detection antibody (conjugated or unconjugated) with a titrated concentration of the unlabeled capture antibody (or vice versa) for 1 hour in a separate tube. Include a "No Competitor" control.
- Add the mixture to the coated plate. If the detection antibody is unconjugated, proceed with a secondary conjugate.
- Develop and read signal. A significant reduction in signal (>50% inhibition) indicates epitope overlap/steric hindrance. No inhibition confirms independent binding.
Standard and QC Preparation & Recovery Assessment
Objective: To ensure accuracy of spiked analyte recovery in the sample matrix.
Protocol:
- Prepare a known spike concentration of the purified standard into the intended sample matrix (e.g., 100% serum, CSF).
- Perform a series of dilutions of this spiked sample using the recommended assay diluent.
- Run the diluted samples on the ELISA alongside the standard curve prepared in buffer.
- Calculate the measured concentration at each dilution, accounting for the dilution factor.
- Determine % Recovery: (Measured Concentration / Expected Spiked Concentration) * 100.
- Acceptance: Recovery should be 80-120% across the dilution series, demonstrating lack of matrix interference (parallelism).
The Scientist's Toolkit: Research Reagent Solutions
| Item | Function & Criticality |
|---|---|
| Matched Antibody Pair | Pre-optimized, validated capture and detection antibodies guaranteeing specificity and performance. Essential for assay development. |
| Recombinant Antigen Standard | Highly pure, endotoxin-low protein for generating a precise standard curve. Lot-specific concentration is mandatory. |
| Matrix-Matched Diluent | Specialized buffer to dilute samples, minimizing matrix effects (e.g., serum, plasma) and maintaining analyte stability. |
| HRP or ALP Conjugation Kits | For labeling detection antibodies with consistent enzyme-to-antibody ratios, ensuring uniform signal generation. |
| Stable Chemiluminescent Substrate | Provides sensitive, low-background signal with wide dynamic range. Ready-to-use formulations ensure reproducibility. |
| Pre-Coated ELISA Plates | Plates coated with validated capture antibody, saving time and reducing inter-lab variability. Critical for high-throughput work. |
| Reference Serum/Control Panels | Well-characterized human or animal sera for establishing normal/abnormal ranges and serving as long-term QCs. |
Visualizing Critical Reagent Interactions and Workflow
Diagram 1: Sandwich ELISA Reagent Interaction Flow
Diagram 2: Standard Curve & Control Relationship
Within the comprehensive framework of a step-by-step ELISA research guide, the performance and reliability of the assay are fundamentally dependent on three core pieces of instrumentation: the microplate washer, incubator, and reader. This technical guide delves into the operational principles, selection criteria, and optimal protocols for these essential devices, which collectively automate and standardize the critical steps of plate washing, antigen-antibody incubation, and signal detection.
Microplate Washers
Microplate washers are critical for removing unbound reagents between ELISA steps, directly impacting the signal-to-noise ratio. Inefficient washing can lead to high background and false positives, while overly aggressive washing can elute bound material, causing false negatives.
Technical Operation: Modern washers utilize either a pressurized manifold (for high-throughput 96- and 384-well formats) or individual aspirating/dispensing tips. The key parameters are:
- Aspiration: Complete removal of liquid, often with a defined tip height offset and optional post-aspiration drip time.
- Dispense: Delivery of wash buffer, typically with a defined force to create agitation. Soak cycles can be programmed to improve dissociation of weakly bound materials.
- Cross-contamination Prevention: Achieved via tip washing or using disposable tips.
Protocol: Optimized Washing for a Sandwich ELISA
- Post-Coating/Blocking: Aspirate blocking buffer. Perform 3 wash cycles with 300 µL/well of PBS containing 0.05% Tween-20 (PBST).
- Post-Sample/Antibody Incubation: Aspirate well contents. Perform 5 wash cycles with 350 µL/well of PBST. Include a 5-second soak time on the third cycle.
- Final Washes: After the final incubation with detection antibody or streptavidin-enzyme conjugate, perform a stringent wash of 5-7 cycles with 350 µL/well PBST, followed by 2 cycles with PBS (no detergent) to remove residual detergent that could interfere with the subsequent enzymatic reaction.
Microplate Incubators
Consistent temperature and, where required, humidity and agitation are vital for reproducible antibody-antigen binding and enzymatic reactions.
Technical Operation: Incubators range from simple heated shelves to sophisticated units with:
- Precise Temperature Control: Uniformity across the plate (e.g., ±0.5°C at 37°C).
- Humidity Control: Prevents evaporation from edge wells, which concentrates reagents and creates a "edge effect." >80% humidity is standard.
- Orbital Agitation: Enhances kinetic mixing, reducing assay time and improving homogeneity.
Protocol: Standard Incubation Steps for ELISA
- Coating: Incubate plate with capture antibody or antigen in carbonate-bicarbonate buffer (pH 9.6) for a defined period. Typical protocol: 100 µL/well, 16 hours (overnight) at 4°C in a static incubator.
- Blocking & Sample/Antibody Incubation: Typical protocol: 200 µL/well of blocking buffer (e.g., 5% BSA in PBST) or sample/detection antibody, 1-2 hours at 25°C (room temperature) or 37°C with orbital agitation at 300-500 rpm.
- Substrate Incubation: Typical protocol: 100 µL/well of TMB or other chromogenic/chemiluminescent substrate, 10-30 minutes at 25°C in the dark without agitation.
Microplate Readers
Plate readers quantify the signal generated in the final ELISA step. The choice of detection technology (absorbance, fluorescence, luminescence) depends on the substrate used.
Technical Operation:
- Absorbance (Colorimetric): The most common for ELISA. Uses a light source (often a tungsten-halogen lamp) and a monochromator or filter to select the wavelength. Detects the amount of light absorbed by the chromogen (e.g., TMB read at 450nm, with a 540-650nm reference wavelength to correct for optical imperfections).
- Fluorescence: Uses an excitation light source (e.g., xenon flash lamp, LED) and specific filters/optics to excite a fluorophore and measure its emitted light at a longer wavelength. Offers higher sensitivity than absorbance.
- Luminescence: Measures light emitted from a chemical reaction (e.g., horseradish peroxidase with a luminol-based substrate). Requires no excitation light source, offering extremely low background and very high sensitivity.
Protocol: Signal Detection for HRP/TMB ELISA
- After substrate incubation, optionally add a stop solution (e.g., 1M H₂SO₄ for TMB).
- Gently blot the plate bottom to remove droplets and fingerprints.
- Insert the plate into the pre-warmed reader (set to 25°C for temperature consistency).
- Read absorbance at 450 nm (primary) and 570 nm or 620 nm (reference wavelength) within 30 minutes of stopping the reaction.
Data Presentation: Key Performance Metrics for Equipment Selection
Table 1: Quantitative Comparison of Microplate Reader Detection Modes
| Detection Mode | Typical Sensitivity | Dynamic Range | Common ELISA Substrates | Key Advantage |
|---|---|---|---|---|
| Absorbance | ~0.01 OD units | 2-3 OD units | TMB, OPD, ABTS | Robust, simple, inexpensive |
| Fluorescence | 1-10 pM (equiv.) | 4-5 orders of magnitude | QuantaBlu, ATTO dyes | Higher sensitivity than absorbance |
| Luminescence | 10-100 fM (equiv.) | 6-8 orders of magnitude | Luminol-based (e.g., SuperSignal) | Highest sensitivity, widest dynamic range |
Table 2: Core Protocol Parameters for a Standard Sandwich ELISA
| Step | Primary Equipment | Key Parameters | Typical Duration | Critical Control |
|---|---|---|---|---|
| Coating | Static Incubator | 4°C, Ambient Humidity | 16 hours (overnight) | Buffer pH & ionic strength |
| Washing | Plate Washer | 5 cycles, 350 µL PBST, 5s soak | 5 minutes | Complete aspiration, no carryover |
| Sample Incubation | Orbital Shaker Incubator | 37°C, >80% Humidity, 500 rpm | 2 hours | Sample matrix & dilution |
| Detection Incubation | Orbital Shaker Incubator | 25°C, Ambient, 300 rpm | 1 hour | Antibody specificity & titer |
| Signal Development | Static Incubator | 25°C, Dark, No Agitation | 15 minutes | Precise timing |
| Detection | Plate Reader | Absorbance: 450nm/620nm | <1 minute | Plate alignment, temperature |
Visualization: ELISA Workflow and Signal Detection Pathways
ELISA Core Workflow with Equipment Integration
ELISA Sandwich Assay Signal Generation Pathway
The Scientist's Toolkit: Essential Research Reagent Solutions
Table 3: Key Reagents and Materials for Reliable ELISA
| Reagent/Material | Primary Function | Key Considerations for Performance |
|---|---|---|
| High-Binding Microplates (e.g., Polystyrene) | Solid phase for immobilizing capture antibody/antigen. | Protein binding capacity, well-to-well uniformity, low autofluorescence. |
| Capture & Detection Antibody Pair | Specifically bind the target analyte at different epitopes. | Specificity, affinity, matched pair validation to prevent interference. |
| Blocking Buffer (e.g., 5% BSA, Casein) | Covers unused binding sites to minimize nonspecific adsorption. | Must be unrelated to assay components; optimization required for sample matrix. |
| Wash Buffer (PBS with 0.05% Tween-20) | Removes unbound material while maintaining assay integrity. | Detergent concentration is critical; too high can elute bound material. |
| Enzyme Conjugate (e.g., HRP-Streptavidin) | Links detection event to signal generation. | Specific activity, lot-to-lot consistency, optimal working dilution. |
| Chromogenic Substrate (e.g., TMB) | Enzymatically converted to a measurable colored product. | Sensitivity, signal stability, required stop solution. |
| Reference Standards/Calibrators | Quantifies analyte concentration via a standard curve. | Matrix-matched to samples, precise serial dilutions are critical. |
The Complete ELISA Protocol: A Detailed Step-by-Step Laboratory Guide
Within the comprehensive framework of an ELISA step-by-step guide research thesis, the pre-assay planning phase is the critical determinant of experimental success. This phase, encompassing experimental design and reagent optimization, establishes the foundation for data validity, reproducibility, and meaningful biological interpretation. For researchers, scientists, and drug development professionals, meticulous planning mitigates costly reagent waste and unreliable results, directly impacting downstream decision-making in diagnostic and therapeutic development.
Foundational Experimental Design
A robust design addresses the assay's purpose, required sensitivity, dynamic range, and statistical power.
2.1 Defining the Assay Objective: The experimental design is dictated by the primary goal:
- Quantitative: Precise concentration measurement of analyte in unknown samples using a standard curve.
- Qualitative: Determination of presence/absence of analyte above a cut-off threshold.
- Semi-Quantitative: Relative comparison of analyte levels between samples.
2.2 Key Design Considerations:
- Sample Type & Matrix: Serum, plasma, cell lysate, or tissue culture supernatant each introduce unique interfering components (e.g., heterophilic antibodies, complement, albumin).
- Controls: A non-negotiable element for data integrity.
- Blank: Reagent-only control for background signal.
- Negative Control: Sample known to lack the analyte.
- Positive Control: Sample with a known concentration of analyte.
- Standard Curve: Serial dilutions of purified analyte of known concentration.
- Replication: Technical replicates (same sample on same plate) assess pipetting and procedural variance. Biological replicates (different samples from same treatment group) account for biological variability. A minimum of triplicate wells per sample or standard is recommended.
- Plate Layout: Randomized or blocked layout to control for edge effects, temperature, or incubation time gradients across the microplate.
Systematic Reagent Optimization
Optimization is an iterative process to establish the optimal working concentration for each reagent, maximizing the signal-to-noise ratio.
3.1 Checkerboard Titration: The definitive method for optimizing matched antibody pairs (capture and detection).
- Objective: To independently determine the optimal concentration for both antibodies.
- Protocol:
- Coat the plate with a series of capture antibody concentrations (e.g., 0.5, 1, 2, 4 µg/mL) down the columns.
- Block the plate as standard.
- Apply a constant, saturating concentration of the target antigen.
- Apply a series of detection antibody concentrations (e.g., 0.25, 0.5, 1, 2 µg/mL) across the rows.
- Complete the assay with enzyme conjugate and substrate.
- Analyze the optical density (OD) data. The optimal pair is the lowest concentration of each antibody that yields the maximum OD for the positive control with minimal background.
3.2 Critical Reagent Optimization Targets:
- Capture Antibody Coating Concentration: Titrated using a constant antigen and detection antibody concentration.
- Detection Antibody Concentration: Titrated using optimal coating concentration and constant antigen.
- Sample & Standard Diluent: Must be optimized to mimic the sample matrix to prevent matrix effects.
- Enzyme-Conjugate Dilution: Titrated to find the dilution that gives the best signal-to-noise ratio on the standard curve's linear portion.
Table 1: Example Checkerboard Titration Results (OD 450 nm)
| Capture Ab (µg/mL) | Detection Ab: 0.25 µg/mL | Detection Ab: 0.5 µg/mL | Detection Ab: 1.0 µg/mL | Detection Ab: 2.0 µg/mL |
|---|---|---|---|---|
| 4.0 | 0.85 | 1.45 | 1.95 | 2.10 |
| 2.0 | 0.70 | 1.30 | 1.80 | 2.00 |
| 1.0 | 0.45 | 0.95 | 1.55 | 1.75 |
| 0.5 | 0.20 | 0.55 | 1.10 | 1.40 |
| 0.0 (Blank) | 0.05 | 0.07 | 0.08 | 0.10 |
Interpretation: The combination of 2.0 µg/mL Capture Ab and 1.0 µg/mL Detection Ab provides a high signal (1.80) with economical antibody use. Higher detection Ab yields only a marginal gain.
The Scientist's Toolkit: Research Reagent Solutions
Table 2: Essential Materials for ELISA Pre-Assay Planning
| Item | Function & Rationale |
|---|---|
| High-Binding ELISA Plates | Polystyrene plates treated for optimal passive adsorption of proteins (e.g., capture antibodies). |
| Matched Antibody Pair | Monoclonal antibodies targeting non-overlapping epitopes on the analyte to ensure specificity. |
| Recombinant Protein Standard | Purified analyte of known concentration and activity for generating the standard curve. |
| Matrix-Matched Diluent | Buffer formulated with additives (e.g., BSA, carrier proteins, blockers) to mimic sample matrix and minimize interference. |
| Blocking Buffer (e.g., 5% BSA/PBS) | Non-reactive protein solution to occupy unsaturated binding sites on the plate post-coating. |
| Detection Enzyme Conjugate | Streptavidin-HRP or specific antibody conjugated to HRP/ALP for signal generation. |
| Chromogenic/TMB Substrate | Chemical converted by the enzyme to a colored product measurable by absorbance. |
| Plate Washer & Buffer | Removes unbound reagents, critical for reducing background. Buffers typically contain mild detergent. |
Detailed Optimization Protocols
5.1 Protocol: Checkerboard Titration for Antibody Pair Optimization
- Coating: Prepare four dilutions of the capture antibody in carbonate/bicarbonate coating buffer (pH 9.6). Add 100 µL per well down the columns of a 96-well plate (e.g., Column 1: 4 µg/mL, Col 2: 2 µg/mL, etc.). Include blank (coating buffer only) columns. Seal and incubate overnight at 4°C.
- Washing: Wash plate 3x with 300 µL PBS-T (0.05% Tween-20) using a plate washer or manual aspiration.
- Blocking: Add 300 µL of blocking buffer (e.g., 5% non-fat dry milk or BSA in PBS) per well. Incubate for 1-2 hours at room temperature (RT). Wash 3x.
- Antigen Addition: Prepare a solution of the target antigen at a mid-range concentration (determined from prior pilot tests) in sample diluent. Add 100 µL to all wells, including blanks. Incubate for 2 hours at RT. Wash 3x.
- Detection Antibody: Prepare four dilutions of the detection antibody in diluent. Add 100 µL per well across the rows (e.g., Row A: 0.25 µg/mL, Row B: 0.5 µg/mL, etc.). Incubate for 1-2 hours at RT. Wash 3x.
- Conjugate Addition: Add 100 µL of optimally diluted enzyme-conjugated secondary antibody (or Streptavidin-HRP if using biotinylated detection Ab) to all wells. Incubate for 1 hour at RT. Wash 3-5x thoroughly.
- Signal Detection: Add 100 µL of substrate solution (e.g., TMB). Incubate in the dark for 5-30 minutes. Stop the reaction with 100 µL of stop solution (e.g., 1M H₂SO₄ for TMB).
- Readout: Immediately measure absorbance at the appropriate wavelength (e.g., 450 nm for TMB). Analyze the grid to select the optimal combination.
5.2 Protocol: Matrix Effect Assessment via Spike-and-Recovery
- Prepare a dilution series of the recombinant standard in the intended sample diluent.
- Prepare an identical dilution series of the standard spiked into a representative sample matrix (e.g., normal serum) that has been diluted as per the assay protocol.
- Run both sets of samples in the ELISA.
- Calculate the % Recovery for each spike level:
(Concentration measured in matrix / Concentration measured in diluent) x 100. - Acceptable recovery is typically 80-120%. Poor recovery indicates matrix interference, necessitating further dilution of samples or reformulation of the diluent.
Visualizing Key Workflows
ELISA Pre-Assay Planning Workflow
Checkerboard Titration Concept & Optimal Zone
Within the broader thesis of developing a comprehensive, optimized step-by-step ELISA guide, the initial coating step is critical. This phase establishes the assay's foundation by immobilizing the capture molecule onto the microplate surface. The efficiency and uniformity of this process directly determine the sensitivity, specificity, and reproducibility of the entire immunoassay. This technical guide delves into the systematic optimization of the three pivotal parameters in plate coating: buffer composition, capture reagent concentration, and incubation conditions.
The Coating Process: A Biochemical Foundation
Coating involves the passive adsorption of proteins (typically antibodies or antigens) onto the hydrophobic polystyrene surface of microplate wells. The interaction is primarily driven by hydrophobic forces and, to a lesser extent, by electrostatic interactions. Optimization aims to maximize the surface density of properly oriented, immunologically active molecules while minimizing denaturation.
Parameter Optimization: Data-Driven Strategies
Coating Buffer Optimization
The ionic strength and pH of the coating buffer significantly influence adsorption efficiency and protein stability.
Table 1: Common Coating Buffers and Performance Characteristics
| Buffer (pH) | Typical Composition | Best For | Advantages | Disadvantages |
|---|---|---|---|---|
| Carbonate-Bicarbonate (9.6) | 0.05 M Na₂CO₃, NaHCO₃ | Most antibodies, acidic proteins | High pH enhances polystyrene binding, simple preparation | Can denature alkali-sensitive proteins; pH drifts over time. |
| Phosphate-Buffered Saline (PBS) (7.4) | 0.01 M Phosphate, 0.137 M NaCl, 0.0027 M KCl | Neutral/alkaline antigens, sensitive antibodies | Physiological pH preserves activity, widely available | Lower adsorption efficiency for some proteins vs. carbonate buffer. |
| Tris-Buffered Saline (TBS) (8.5) | 0.05 M Tris, 0.138 M NaCl | Phosphoproteins, assays involving phosphate | Stable pH, avoids phosphate interference | Slightly lower binding than carbonate for some targets. |
| Borate Buffer (8.5) | 0.05 M Sodium Borate | Alkaline phosphatases, long-term coating stability | Excellent buffering capacity at alkaline pH | Less commonly used, may require optimization. |
Recent studies (2023) indicate that adding 0.01% (v/v) Tween 20 to the coating buffer can reduce non-specific binding (NSB) even at this early stage without significantly affecting primary adsorption.
Concentration and Volume Optimization
Determining the optimal amount of capture reagent is essential for cost-effectiveness and preventing steric hindrance.
Table 2: Empirical Determination of Optimal Coating Concentration
| Protein Type | Typical Starting Range | Recommended Test Concentrations (in Coating Buffer) | Incubation (at 4°C) | Method for Determination |
|---|---|---|---|---|
| Monoclonal Antibody | 0.5 - 10 µg/mL | 0.5, 1, 2, 5, 10 µg/mL | Overnight (16-18h) | Checkerboard titration against antigen dilution series. |
| Polyclonal Antibody | 1 - 20 µg/mL | 1, 2, 5, 10, 20 µg/mL | Overnight (16-18h) | Signal-to-noise ratio at saturating antigen concentration. |
| Recombinant Protein/Antigen | 1 - 20 µg/mL | 1, 2.5, 5, 10, 20 µg/mL | Overnight (16-18h) | Titration against constant, optimized detector antibody. |
Protocol: Checkerboard Titration
- Prepare a 2X series dilution of the capture antibody in coating buffer across 8 rows of a plate (e.g., 10 µg/mL to 0.078 µg/mL).
- Prepare a 2X series dilution of the target antigen in assay buffer down 12 columns.
- Perform coating (100 µL/well) overnight at 4°C.
- Complete the standard ELISA protocol (blocking, detection, substrate).
- Identify the lowest capture concentration yielding maximum (or near-maximum) signal with the lowest antigen concentration. This point represents optimal sensitivity and reagent use.
Incubation Time and Temperature
These parameters control the kinetics of the adsorption process.
Table 3: Incubation Condition Trade-offs
| Condition | Typical Duration | Impact on Assay | Recommendation |
|---|---|---|---|
| 4°C, Overnight | 16-18 hours | Maximizes binding, minimizes protein denaturation, best for stability. | Gold standard for most applications. Provides flexibility for lab workflow. |
| 37°C | 1 - 3 hours | Faster, binding kinetics accelerated. | Useful for rapid assays. Risk of increased denaturation and evaporation. Must be sealed. |
| Room Temperature (22-25°C) | 1 - 4 hours | Convenient, moderate binding. | A practical compromise. Consistency requires controlled lab temperature. |
Recent data suggests that for high-affinity monoclonal antibodies, a 2-hour incubation at 37°C can yield equivalent performance to overnight at 4°C, significantly shortening total assay time.
Advanced Considerations and Protocols
Alternative Coating Methods: Covalent Linkage
For small molecules or proteins that poorly passively adsorb.
Protocol: NHS-Ester Crosslinking for Amine-Reactive Coating
- Coat plate with a high-affinity protein (e.g., Streptavidin, NeutrAvidin) at 10 µg/mL in PBS, overnight at 4°C.
- Wash 3x with PBS.
- Prepare a fresh solution of 10 mM Sulfo-NHS and 5 mM EDC in distilled water.
- Add 100 µL/well to activate carboxyl groups on the base protein. Incubate for 15-30 minutes at RT.
- Wash 3x with PBS.
- Immediately add the ligand (with a primary amine) diluted in PBS (pH 7.4). Incubate for 2 hours at RT.
- Wash and block with a Tris- or Ethanolamine-based buffer to quench remaining active esters.
Coating Validation Experiment
Protocol: Direct Protein Assessment Post-Coating
- Coat plate with test conditions (Buffer A/B, Concentration X/Y, Time T1/T2).
- Wash 3x with PBS.
- Add a fluorescent dye (e.g., Sypro Ruby Protein Blot Stain, diluted per manufacturer's instructions) for 15 minutes.
- Wash 3x with PBS.
- Measure fluorescence intensity with a microplate reader. This provides a direct, pre-assay measure of total protein adsorbed, independent of immunological activity.
Diagrams
Title: ELISA Coating Parameter Optimization Workflow
Title: Mechanism of Passive Protein Adsorption in ELISA
The Scientist's Toolkit: Essential Reagents for Coating Optimization
Table 4: Key Research Reagent Solutions for Coating
| Reagent/Solution | Function & Rationale | Typical Composition/Example |
|---|---|---|
| Carbonate-Bicarbonate Buffer (pH 9.6) | Standard high-pH buffer promoting efficient passive adsorption of most proteins. | 1.59 g/L Na₂CO₃, 2.93 g/L NaHCO₃ in dH₂O. |
| PBS Coating Buffer (pH 7.4) | Gentler, physiological buffer for pH-sensitive capture molecules. | 0.01 M phosphate, 0.137 M NaCl, 0.0027 M KCl. |
| High-Affinity Binding Plates | Specialized plates with altered surface chemistry for consistent, high-capacity binding. | Nunc MaxiSorp (polystyrene), Corning Costar (amine-binding). |
| BSA (Bovine Serum Albumin) | The most common blocking agent, used after coating to occupy residual binding sites. | 1-5% (w/v) in PBS or Tris buffer. |
| Casein Blocking Buffer | Alternative block; often yields lower background in enzymatic detection than BSA. | 1% (w/v) casein in PBS, pH 7.4. |
| Tween 20 (Polysorbate 20) | Non-ionic detergent used in wash buffers and sometimes in coating buffers to reduce NSB. | 0.05% (v/v) in PBS (PBS-T). |
| NHS/EDC Crosslinking Kit | Enables covalent immobilization for peptides, haptens, or poorly adsorbing proteins. | Thermo Scientific Pierce NHS-Activated Plates or similar reagent kits. |
| Fluorescent Protein Stain | For direct quantification of total adsorbed protein during method development. | Sypro Ruby Protein Blot Stain or FluoroProfile Protein Quantification Kit. |
Within the context of a comprehensive step-by-step ELISA guide, blocking represents the critical second step that follows plate coating. This stage is dedicated to the occupation of residual protein-binding sites on the solid-phase surface. Effective blocking minimizes non-specific binding (NSB) of detection antibodies or other assay components, thereby reducing background noise and enhancing the signal-to-noise ratio essential for accurate quantitative analysis.
Mechanisms and Chemical Rationale of Blocking Agents
Blocking agents function by adsorbing to any remaining hydrophobic or charged sites on the polystyrene microplate surface after the antigen or capture antibody coating step. The choice of blocking agent is dictated by the specific assay format and the nature of the target and detection molecules.
Key Blocking Agent Classes and Properties
The following table summarizes the characteristics, advantages, and limitations of common blocking agents, informed by recent comparative studies.
Table 1: Comparative Analysis of Common ELISA Blocking Agents
| Blocking Agent | Typical Concentration | Incubation Time/Temp | Key Mechanism | Best For | Potential Interference |
|---|---|---|---|---|---|
| Bovine Serum Albumin (BSA) | 1-5% (w/v) | 1-2 hr, RT or O/N 4°C | Protein-based, occupies sites via hydrophobic/ionic interactions | General use, phospho-specific assays, antibody-based detection. | May contain bovine Ig; avoid with bovine targets. |
| Non-Fat Dry Milk (NFDM) | 3-5% (w/v) | 1-2 hr, RT | Complex mixture of caseins and whey proteins; effective but variable. | High-capacity blocking for robust assays. | Contains biotin and phosphoproteins; unsuitable for streptavidin or phospho-protein detection. |
| Casein | 1-2% (w/v) | 1-2 hr, RT | Phosphoprotein, forms a stable layer, relatively inert. | Low background, alkaline phosphatase (AP) systems. | Slight variability between sources. |
| Fish Skin Gelatin | 0.1-1% (w/v) | 1-2 hr, RT | Low viscosity, mammalian protein-free, minimal cross-reactivity. | Assays with mammalian samples/targets; avoiding mammalian sera. | Less robust for high NSB situations. |
| Synthetic Blockers (e.g., PVP, PVA) | 0.5-2% (w/v) | 30 min - 1 hr, RT | Polymer-based, non-protein, defined composition. | Avoiding biological contaminants; consistent manufacturing. | May be less effective for some hydrophobic surfaces. |
| Serum (e.g., FBS, Goat) | 5-10% (v/v) | 1-2 hr, RT | Complex biological fluid, contains diverse proteins. | Mimicking physiological conditions; blocking in cell-based ELISAs. | High variability; contains immunoglobulins and bioactive factors. |
Advanced Blocking Strategies and Protocols
Optimization Protocol: Blocking Buffer Screening
Objective: To empirically determine the optimal blocking buffer for a novel assay. Materials: Coated ELISA plate, candidate blocking buffers (see Table 1), assay diluent, detection antibodies, substrate. Methodology:
- Prepare 5-8 different blocking buffers as per Table 1.
- After coating and washing (Step 1), divide the plate and apply different blockers to designated columns/rows. Incubate as per table.
- Wash plate 3x with wash buffer (e.g., PBS + 0.05% Tween-20).
- Proceed with standard assay steps (sample addition, detection Ab, etc.).
- Include controls: "No Primary Ab" (background control) and "No Antigen" (coating control).
- Calculate Signal-to-Noise (S/N) ratio: (Mean Signal of Positive Control) / (Mean Signal of No Primary Ab Control). The blocker yielding the highest S/N is optimal.
Protocol for Challenging Assays: Sequential or Mixed Blocking
Objective: To overcome persistent high background in assays involving sticky proteins (e.g., lysates) or high-affinity systems. Materials: Coated plate, two complementary blockers (e.g., 1% Casein and 1% BSA), wash buffer. Methodology:
- After coating, block initially with a protein-free or synthetic blocker (e.g., 0.5% PVP in PBS) for 1 hour at RT. This fills highly charged sites.
- Wash 2x.
- Apply a second, protein-based blocker (e.g., 3% BSA in PBS) for an additional 1-2 hours. This provides a proteinaceous layer.
- Wash thoroughly before proceeding. Alternatively, pre-mix the two agents (e.g., 0.5% Casein + 0.25% PVA) for simultaneous application.
Signaling Pathways in Non-Specific Binding and Blocking
The following diagram illustrates the molecular interactions leading to non-specific binding and how effective blocking mitigates them.
Diagram Title: Molecular Mechanism of Blocking to Prevent NSB in ELISA
The Scientist's Toolkit: Research Reagent Solutions for Blocking
Table 2: Essential Materials for ELISA Blocking Optimization
| Item | Function & Rationale | Example Product/Catalog |
|---|---|---|
| High-Purity BSA (IgG-Free, Protease-Free) | Standard blocking protein; IgG-free versions prevent interference with anti-IgG detection systems. | Sigma-Aldrich A2058 |
| Non-Fat Dry Milk Powder | Cost-effective, high-capacity blocker for general screening. Avoid with phospho- or biotin-detection. | Generic store-bought, or Bio-Rad 1706404 |
| Casein, Sodium Salt | Inert phosphoprotein, ideal for AP-conjugate systems due to lack of endogenous phosphatases. | Thermo Fisher 37528 |
| Fish Skin Gelatin | Mammalian protein-free alternative, reduces cross-reactivity with mammalian samples. | Sigma-Aldrich G7765 |
| Tween-20 (Polysorbate 20) | Non-ionic detergent added to wash and blocking buffers (0.05-0.1%) to reduce hydrophobic NSB. | Sigma-Aldrich P9416 |
| Advanced: Polyvinyl Alcohol (PVA) | Synthetic, non-proteinaceous polymer blocker; provides consistent, contaminant-free performance. | Sigma-Aldrich 363138 |
| Advanced: Commercial "SuperBlock" Solutions | Proprietary, optimized protein-free or protein-based formulations for maximum signal-to-noise. | Thermo Fisher 37515 |
| Assay-Specific: Normal Serum (from host species of detection Ab) | Used in blocking/diluent to saturate anti-species Ig reactivity, especially for indirect ELISA. | Jackson ImmunoResearch 017-000-121 (Goat) |
| Blocking Buffer Additives (e.g., Chelators) | EDTA (1-5 mM) can be added to block metalloproteinase activity that degrades coating antigen. | Sigma-Aldrich EDS |
The strategic implementation of blocking is a non-negotiable pillar of robust ELISA development. The move towards more defined, recombinant, and synthetic blocking agents reflects the demand for reproducibility in pharmaceutical and clinical research. The optimal strategy is not universal but must be empirically derived within the specific context of the assay's target, detection system, and sample matrix, directly impacting the sensitivity, specificity, and reliability of the resulting data in the drug development pipeline.
Within the comprehensive framework of a step-by-step ELISA guide, Step 3 is a critical juncture that directly impacts the accuracy, precision, and dynamic range of the assay. Following plate coating and blocking, this step involves the precise preparation and application of the analyte-containing solutions. The core challenge is to transform raw samples and a pure standard into a reliable, quantifiable series that will generate a valid calibration curve and yield accurate sample concentrations. Errors introduced here are systematic and cannot be corrected in later steps. This technical guide details the methodologies for preparing both samples and standards, with a focus on dilution series construction for the standard curve, a cornerstone of quantitative ELISA.
Core Principles: Standard Curve & Matrix Effects
The quantitation in ELISA is relative, not absolute. A standard curve, created from serial dilutions of a known concentration of the pure analyte, is the reference against which unknown samples are measured. The dilution series must span the assay's detection range, typically from above the expected maximum sample concentration to below the expected minimum.
A paramount consideration is the matrix. Samples (e.g., serum, plasma, cell lysate, tissue homogenate) contain numerous components that can non-specifically interfere with antibody binding or the enzymatic reaction (matrix effects). To compensate, standards must be diluted in a matrix that closely mimics the sample's composition. For serum samples, this is often a negative control matrix (e.g., analyte-depleted serum or a suitable buffer with equivalent protein content).
Experimental Protocols
Protocol 3.1: Preparation of Standard Stock Solution & Working Range
- Reconstitution: Obtain lyophilized standard of known mass. Briefly centrifuge the vial. Reconstitute with the recommended volume of the designated Standard Diluent (often an assay buffer or a defined matrix) to create a high-concentration Primary Stock Solution (e.g., 10,000 pg/mL). Allow to equilibrate for 10-15 minutes with gentle agitation.
- Aliquoting: Immediately aliquot the Primary Stock Solution into single-use volumes to avoid freeze-thaw cycles. Store at ≤ -20°C or as recommended.
- Defining the Range: Consult the kit manual for the suggested dynamic range (e.g., 7.8 – 500 pg/mL). Prepare a Top Standard at the maximum concentration of the curve (e.g., 500 pg/mL) by diluting the Primary Stock in the appropriate Matrix-Matched Diluent.
Protocol 3.2: Serial Dilution for Standard Curve
- Setup: Label a series of microcentrifuge tubes (e.g., #1 to #8). Place the required volume of Matrix-Matched Diluent into all tubes except tube #1.
- Initial Dilution: Into tube #1, add the calculated volume of the Top Standard to create the highest standard point.
- Serial Transfer: Perform a serial dilution. For a 2-fold series, transfer an equal volume from tube #1 to tube #2, mix thoroughly by pipetting or vortexing. Then transfer the same volume from tube #2 to tube #3. Continue this process down the series.
- Blank: The last tube in the series should contain only Matrix-Matched Diluent (Zero Standard).
- Application: Apply the diluted standards to the ELISA plate in duplicate or triplicate, following the plate map.
Protocol 3.3: Sample Preparation and Pre-Dilution
- Clarification: Centrifuge biological samples (e.g., serum) at 10,000 x g for 10 minutes at 4°C to remove particulates.
- Prediction: Based on literature or pilot experiments, predict the approximate concentration of the analyte in the sample.
- Initial Dilution (Predilution): Dilute the neat sample with Matrix-Matched Diluent to bring the expected concentration within the middle of the standard curve's range. For example, if the sample is predicted to contain ~2000 pg/mL and the standard curve goes to 500 pg/mL, a 1:10 or 1:20 initial dilution is required.
- Application: Apply the prediluted samples to the plate. It is often necessary to test multiple dilutions of a sample (e.g., 1:10, 1:50) to ensure at least one falls within the quantifiable range.
Quantitative Data & Dilution Schemes
Table 1: Example of a 2-Fold Serial Dilution Series for a Standard Curve (Top Standard = 500 pg/mL)
| Tube # | Relative Dilution | Volume Transfer | Final Concentration (pg/mL) | Assay Purpose |
|---|---|---|---|---|
| 1 | 1:1 (Top Std) | - | 500.0 | Maximum Signal |
| 2 | 1:2 | 100 µL from #1 | 250.0 | |
| 3 | 1:4 | 100 µL from #2 | 125.0 | |
| 1 | 1:8 | 100 µL from #3 | 62.5 | |
| 5 | 1:16 | 100 µL from #4 | 31.3 | |
| 6 | 1:32 | 100 µL from #5 | 15.6 | |
| 7 | 1:64 | 100 µL from #6 | 7.8 | Minimum Quantification |
| 8 | Zero | - | 0.0 | Blank/Background |
Table 2: Common Sample Predilution Strategies for Different Matrices
| Sample Matrix | Typical Initial Dilution | Diluent | Primary Reason |
|---|---|---|---|
| Human Serum/Plasma | 1:10 - 1:100 | Assay Buffer + 1% BSA or analyte-depleted serum | Reduce matrix interference & high analyte levels |
| Cell Culture Supernatant | 1:2 - 1:10 | Culture Medium or Assay Buffer | Reduce background from media components |
| Tissue Homogenate | 1:10 - 1:50 | Homogenization Buffer | Reduce non-specific binding from cellular debris |
| Urine | Often neat or 1:2 | Assay Buffer | Analyze native or concentrated state |
Visualization of Workflows
Title: ELISA Step 3: Sample & Standard Preparation Workflow
Title: Dilution Series Construction & Curve Fitting Relationship
The Scientist's Toolkit: Essential Reagents & Materials
Table 3: Key Research Reagent Solutions for Sample & Standard Preparation
| Item | Function & Importance |
|---|---|
| Lyophilized Standard | Pure, quantitated analyte used to generate the calibration curve. The cornerstone of quantitative accuracy. |
| Matrix-Matched Diluent | Buffer spiked with protein (e.g., BSA) or, critically, a negative control matrix (e.g., charcoal-stripped serum) to mimic sample composition and correct for matrix effects. |
| Analyte-Depleted Serum | Serum processed to remove the target analyte, providing the ideal matrix for diluting standards for serum/plasma samples. |
| Low-Binding Microcentrifuge Tubes | Minimizes adsorption of proteinaceous analytes to tube walls, especially critical at low concentrations. |
| Multichannel Pipette & Reservoirs | Enables rapid, reproducible transfer of dilution series and samples to the 96-well plate, reducing well-to-well variability. |
| Plate Layout Template | A pre-planned map (physical or digital) for sample and standard placement, essential for organized data collection and analysis. |
| Software for Curve Fitting | Programs (e.g., GraphPad Prism, ELISA analysis modules) that use 4PL or 5PL regression to interpolate sample concentrations from the standard curve. |
This whitepaper, as part of a comprehensive thesis on ELISA step-by-step methodology, addresses the critical fourth step: detection antibody incubation. This phase directly influences assay sensitivity, specificity, and dynamic range. The selection of an appropriate antibody-enzyme conjugate and optimization of incubation timing are pivotal for generating robust, quantitative data in research, diagnostic, and drug development applications.
Core Principles of Detection Antibody Incubation
The detection antibody, typically conjugated to an enzyme (e.g., Horseradish Peroxidase - HRP, or Alkaline Phosphatase - AP), binds specifically to the target antigen that has been captured on the plate. This step creates the essential link for subsequent signal generation via enzyme-substrate reaction. Key variables include conjugate type, concentration, incubation time, and temperature.
Conjugate Selection: Enzymes and Alternatives
The choice of conjugate is dictated by assay requirements for sensitivity, available substrates, and potential interferences.
Table 1: Common Enzyme Conjugates for ELISA Detection
| Conjugate Enzyme | Common Substrates | Typical Sensitivity (Lower Detection Limit) | Key Advantages | Key Disadvantages | Optimal Incubation Time* |
|---|---|---|---|---|---|
| Horseradish Peroxidase (HRP) | TMB, OPD, ABTS | 1-10 pg/mL | High turnover rate, small size, multiple substrate options | Inhibited by sodium azide, susceptible to endogenous peroxidases | 30 min - 2 hr (RT) |
| Alkaline Phosphatase (AP) | pNPP, BCIP/NBT | 10-100 pg/mL | Very stable, not inhibited by azide, low background in mammalian samples | Larger size, slower turnover rate | 1 - 2 hr (RT) |
| β-Galactosidase | ONPG, CPRG | 10-50 pg/mL | No endogenous activity in most mammalian cells/tissues | Less common, fewer commercial substrates | 1 - 2 hr (RT) |
| Polymer-based HRP (e.g., Streptavidin-Poly-HRP) | TMB, Enhanced Chemiluminescent | 0.1-1 pg/mL | Exceptional sensitivity due to multiple enzyme units | Can increase background if overused, more expensive | 15 - 30 min (RT) |
*RT = Room Temperature (20-25°C). Times can often be halved at 37°C with agitation.
Emerging Alternatives: Fluorescent and electrochemical detection conjugates are gaining traction for multiplexing and specialized high-throughput applications.
Optimization of Incubation Timing: A Methodological Guide
Optimal incubation time is determined by kinetic studies to ensure the reaction is within the linear range, maximizing signal-to-noise ratio without reaching plateau.
Experimental Protocol: Time-Course Optimization for Detection Antibody
Objective: To determine the optimal incubation time for the detection antibody conjugate.
Materials:
- Coated and blocked ELISA plate with target antigen bound.
- Detection antibody conjugate (at a predetermined starting dilution).
- Assay buffer (e.g., PBS with 0.1% BSA or proprietary blocking buffer).
- Plate washer.
- Microplate reader.
Procedure:
- Prepare the detection antibody conjugate in the recommended assay buffer. Aliquot into multiple tubes for simultaneous addition.
- Add the conjugate solution to all antigen-positive and negative control wells simultaneously. Start a timer.
- At each pre-defined time point (e.g., 15, 30, 60, 90, 120 minutes), select a set of replicate wells and immediately stop the incubation by thoroughly aspirating and washing (3-5 times) with wash buffer.
- Proceed immediately with the standardized substrate incubation step for all wells at the same time, using a precise, consistent duration.
- Measure the signal (absorbance, luminescence, etc.).
- Plot the mean signal for positive and negative controls against time. Calculate the signal-to-noise (S/N) ratio (Positive/Negative) for each time point.
Interpretation: The optimal time is typically at or just before the curve for the S/N ratio begins to plateau. A time that yields 70-90% of the maximum S/N is often chosen to conserve reagent and reduce total assay time.
Table 2: Impact of Incubation Parameters on Assay Performance
| Parameter | Typical Range | Effect on Sensitivity | Effect on Background | Recommended Optimization Method |
|---|---|---|---|---|
| Time | 30 min - 2 hr (RT) | Increases until equilibrium | May increase non-specific binding | Time-course experiment (see protocol above) |
| Temperature | 4°C, RT (20-25°C), 37°C | Faster kinetics at higher temp | Can increase at higher temp | Compare S/N at RT vs. 37°C with shorter times |
| Concentration | Vendor rec. to 1:10,000+ dilution | Higher conc. increases speed & signal | Dramatically increases at too high conc. | Checkerboard titration vs. time |
| Agitation | Orbital, 300-500 rpm | Can reduce incubation time by ~50% | May slightly reduce background | Compare static vs. agitated kinetics |
Visualizing the Detection Complex Formation
Diagram Title: Formation of the Detection Complex in Step 4
The Scientist's Toolkit: Key Research Reagent Solutions
Table 3: Essential Materials for Detection Antibody Incubation
| Item | Function & Critical Consideration |
|---|---|
| Detection Antibody Conjugate | Primary reagent. Must have high specificity and affinity for the target antigen. Species/isotype should not conflict with capture antibody. |
| Antibody Diluent Buffer | Typically a protein-based buffer (e.g., with BSA, serum, or casein) to minimize non-specific binding of the conjugate to the plate or capture antibody. Must be compatible with the conjugate (e.g., azide-free for HRP). |
| Microplate Sealing Tape | Prevents evaporation and contamination during incubation, which is critical for consistency across wells and plates. |
| Precision Pipettes & Tips | For accurate and reproducible dispensing of conjugate solutions. Single-channel and multi-channel options needed. |
| Plate Shaker (with temp control) | Provides consistent agitation to enhance binding kinetics and reduce incubation time. Temperature control (RT vs. 37°C) is key for optimization. |
| Timer | Essential for executing time-course experiments and ensuring precise, reproducible incubation durations across runs. |
| Wash Buffer & Plate Washer | Critical for terminating the incubation at exact time points and removing unbound conjugate to prevent high background. |
| Positive & Negative Control Samples | Validates the performance of the detection step. Positive control confirms conjugate activity; negative control (no antigen) measures non-specific binding. |
Troubleshooting and Advanced Considerations
- High Background: Increase number/frequency of washes post-incubation; decrease conjugate concentration or incubation time; optimize diluent blocking capacity.
- Low Signal: Increase conjugate concentration or incubation time (with temperature/agitation); verify conjugate is not degraded or inhibited; check substrate compatibility.
- Incubation at 4°C: Used for less stable conjugates or antigens, but requires significantly longer incubation times (often overnight).
- Sequential vs. Simultaneous Incubation: For sandwich ELISAs, detection antibody is always added after capture and antigen steps. It is never co-incubated with the sample antigen.
Within the broader thesis on a step-by-step ELISA guide, substrate development represents the critical juncture where detection is realized. The choice between chemiluminescent and chromogenic substrates fundamentally dictates the assay's sensitivity, dynamic range, quantification method, and required instrumentation. This technical guide provides an in-depth comparison to inform researchers and drug development professionals in optimizing their ELISA protocols.
Core Principles and Signaling Pathways
Chromogenic ELISA Pathway
Chromogenic substrates are enzymatically converted into a soluble colored product. For Horseradish Peroxidase (HRP), common substrates include TMB (3,3',5,5'-Tetramethylbenzidine) and ABTS, which yield a blue-green or blue end product, respectively. For Alkaline Phosphatase (AP), pNPP (p-Nitrophenyl Phosphate) is hydrolyzed to a yellow product.
Diagram Title: Chromogenic ELISA Detection Pathway
Chemiluminescent ELISA Pathway
Chemiluminescent substrates produce light upon enzymatic reaction. For HRP, luminol-based substrates are oxidized, producing an excited-state product that emits light upon relaxation. AP substrates like CDP-Star are dioxetane phosphates that, upon dephosphorylation, decompose and emit light.
Diagram Title: Chemiluminescent ELISA Detection Pathway
Quantitative Comparison of Substrate Characteristics
Table 1: Performance Metrics of Chemiluminescent vs. Chromogenic Substrates
| Parameter | Chemiluminescent | Chromogenic (e.g., TMB) | Notes |
|---|---|---|---|
| Typical Sensitivity (Lower Detection Limit) | 0.1 - 1 pg/mL | 1 - 10 pg/mL | Chemiluminescence offers 10-100x higher sensitivity. |
| Dynamic Range | 3 - 5+ logs | 1.5 - 2.5 logs | Chemiluminescence allows quantification over a wider concentration range without sample dilution. |
| Signal Duration | Transient (minutes to hours) | Stable (hours to days) | Chemiluminescent signal decays; chromogenic product is stable. |
| Readout Method | Luminometer (RLU) | Spectrophotometer (Absorbance) | RLU = Relative Light Units. |
| Assay Time (Post Incubation) | 1 - 10 minutes | 10 - 30 minutes | Chemiluminescent reactions are typically faster. |
| Background Signal | Very Low | Low to Moderate | Chemiluminescence benefits from no inherent background from sample color/turbidity. |
| Multiplexing Potential | Low (sequential) | High (colorimetric) | Different chromogens allow for color-based multiplexing in one well. |
| Cost per Test | Moderate to High | Low | Chemiluminescent reagents and required instrumentation are more expensive. |
Table 2: Application-Based Substrate Selection Guide
| Application / Requirement | Recommended Substrate | Rationale |
|---|---|---|
| High-Throughput Screening (HTS) | Chemiluminescent | Superior sensitivity reduces reagent consumption; fast readout. |
| Diagnostic Lateral Flow | Chromogenic (TMB) | Visual readout or simple colorimetric scanner suffices. |
| Low-Abundance Target Quantification | Chemiluminescent | Maximum sensitivity is critical. |
| Endpoint Kinetics / ELISA Development | Chromogenic | Stable signal allows for flexible, batch reading. |
| Multiplex ELISA | Chromogenic (Multicolor) | Distinct color products from different enzymes enable multiplexing. |
| Western Blot Compatible | Both (HRP substrates common) | ECL for film/imaging; colorimetric for membrane visualization. |
Detailed Experimental Protocols
Protocol A: Chromogenic ELISA Development with TMB
Objective: To develop and optimize a chromogenic endpoint detection for a sandwich ELISA.
Key Reagents & Materials:
- Capture antibody-coated microplate
- Antigen standard dilutions
- Detection antibody (biotinylated or conjugate-ready)
- HRP-Streptavidin or HRP-Conjugated Secondary Antibody
- TMB Substrate Solution (e.g., ready-to-use liquid)
- Stop Solution (1M H₂SO₄ or HCl)
- Microplate washer
- Microplate absorbance reader (450 nm filter)
Procedure:
- After completing the incubation with the enzyme-conjugated detection reagent, wash the plate 5 times with PBS-T (0.05% Tween-20).
- Prepare the TMB substrate solution according to the manufacturer's instructions. If using a two-component system (e.g., H₂O₂ and TMB), mix immediately before use.
- Add 100 µL of TMB substrate to each well.
- Incubate the plate at room temperature, protected from light, for 10-30 minutes. Monitor blue color development visually or kinetically with a plate reader.
- When the desired color intensity is reached (or when the high standard saturates), add 50-100 µL of 1M H₂SO₄ stop solution to each well. The color will change from blue to yellow.
- Read the absorbance at 450 nm (primary) with a reference filter at 570 nm or 620 nm within 30 minutes.
Optimization Notes: Incubation time must be optimized to ensure the standard curve is within the linear range of the detector. Over-development leads to high background and signal saturation.
Protocol B: Chemiluminescent ELISA Development
Objective: To develop a sensitive chemiluminescent detection protocol for a quantitative ELISA.
Key Reagents & Materials:
- Capture antibody-coated microplate
- Antigen standard dilutions
- Detection antibody (biotinylated or conjugate-ready)
- HRP-Streptavidin or HRP-Conjugated Secondary Antibody
- Enhanced Chemiluminescent (ECL) Substrate (two-component: peroxide solution + luminol/enhancer solution)
- White or black opaque microplates (to contain signal and prevent cross-talk)
- Microplate washer
- Luminometer or plate reader capable of detecting luminescence.
Procedure:
- After the final wash post-enzyme conjugate incubation, thoroughly remove all wash buffer by tapping the plate on absorbent paper.
- Prepare the ECL working solution by mixing the two components (peroxide and luminol) in equal volumes as per the manufacturer's protocol. Prepare fresh and use immediately.
- Add 50-100 µL of the ECL working solution to each well.
- Incubate the plate at room temperature for 2-5 minutes (or as optimized) to allow the signal to stabilize and reach its peak.
- Read the plate immediately in a luminometer, measuring Relative Light Units (RLUs). Integration times are typically 0.1-1 second per well.
- For kinetic analysis, repeated readings can be taken over 20-30 minutes.
Optimization Notes: Signal timing is critical. A kinetic read or a single read at the optimized time post-addition is required due to signal decay. Plate type is essential—opaque plates prevent signal bleed between wells.
The Scientist's Toolkit: Key Research Reagent Solutions
Table 3: Essential Materials for ELISA Substrate Development
| Item | Function | Key Consideration |
|---|---|---|
| HRP-Conjugated Detection Antibody | Binds to target, provides catalytic enzyme for substrate conversion. | Titer must be optimized to balance signal and background. |
| AP-Conjugated Detection Antibody | Alternative enzyme for detection, used with BCIP/NBT or pNPP. | Avoid samples with endogenous phosphatase activity. |
| Ready-to-Use TMB Solution | Stable, pre-mixed chromogenic substrate for HRP. | Simplifies workflow; ensures consistency; often includes a stopping reagent. |
| Enhanced Chemiluminescent (ECL) Substrate | High-sensitivity, light-emitting substrate for HRP. | "Enhanced" formulations include compounds that amplify and prolong light output. |
| CDP-Star or APS-5 Substrate | Highly sensitive, long-lasting chemiluminescent substrate for AP. | Produces a glow-type signal lasting several hours. |
| White Opaque 96-Well Plates | Microplate for chemiluminescent assays. | Walls reflect light to the detector; prevents optical cross-talk between wells. |
| Clear Flat-Bottom 96-Well Plates | Microplate for chromogenic assays. | Optimal for absorbance readings. |
| Microplate Absorbance Reader | Instrument to measure color intensity (OD). | Filter-based or monochromator-based; dual-wavelength capability reduces noise. |
| Microplate Luminometer | Instrument to measure light output (RLU). | Must have high sensitivity and a wide dynamic range. |
| Precision Microplate Washer | Removes unbound reagents between steps. | Critical for reducing background in both assay types. |
The decision between chemiluminescent and chromogenic substrates hinges on the assay's primary objectives. For maximal sensitivity and broad dynamic range in quantitative research and drug development applications, chemiluminescence is unparalleled. For robustness, simplicity, visual assessment, and multiplexing potential, chromogenic substrates remain a powerful choice. Integrating this selection into the broader ELISA workflow is essential for developing a fit-for-purpose immunoassay.
Step 6, "Signal Measurement and Stopping the Reaction," represents the definitive endpoint and data acquisition phase in an Enzyme-Linked Immunosorbent Assay (ELISA). Within the broader thesis of a step-by-step ELISA guide, this stage transitions the assay from a biochemical reaction to a quantifiable dataset. The accuracy and precision of this step directly determine the validity of the entire experimental procedure, making it critical for researchers, scientists, and drug development professionals in diagnostic and quantitative applications.
Core Principles of Signal Measurement
The measured signal is generated from the enzyme-substrate reaction initiated in the previous step. The type of measurement is dictated by the substrate used:
- Chromogenic Substrates: Produce a soluble colored product. The reaction is stopped, and absorbance is measured.
- Chemiluminescent Substrates: Produce light. The reaction is not typically stopped prior to measurement; light emission is measured over time.
- Fluorogenic Substrates: Produce fluorescent light. The reaction is often stopped, and fluorescence is measured at specific excitation/emission wavelengths.
Stopping the Reaction (For Chromogenic ELISA)
The primary function of a stop solution is to abruptly alter the pH of the reaction mixture, denaturing the enzyme and halting its catalytic activity. This "freezes" the color development at a specific point, allowing for measurement at a convenient time.
Detailed Protocol: Stopping the Reaction
- Preparation: Pre-load a multichannel pipette with the appropriate volume of stop solution (typically 1N sulfuric acid (H₂SO₄) or 1N hydrochloric acid (HCl) for alkaline phosphatase (AP) and horseradish peroxidase (HRP) substrates, respectively).
- Addition: Carefully add the stop solution to each well in the same order and with the same timing as the substrate was added. For consistency, use the same time interval (e.g., exactly 10, 15, or 30 minutes) between substrate and stop solution addition for all plates in an experiment.
- Mixing: Gently tap the plate sides to ensure thorough mixing. A visible color change often occurs (e.g., from blue to yellow for TMB stopped with acid).
- Measurement: Read the plate absorbance promptly (usually within 30 minutes) to prevent potential signal drift or precipitation.
Quantitative Signal Measurement Techniques
A. Absorbance Measurement (Colorimetric ELISA)
- Instrument: Microplate Reader (Spectrophotometer).
- Protocol:
- Wipe the bottom of the plate clean with a lint-free cloth.
- Insert the plate into the reader.
- Select the appropriate filter or monochromator setting for the substrate's peak absorbance wavelength (see Table 1).
- Set the reader to also measure at a reference wavelength (e.g., 490nm for 450nm measurement) to subtract background optical imperfections in the plate.
- Initiate reading. Data is typically output as optical density (OD) values.
B. Luminescence Measurement (Chemiluminescent ELISA)
- Instrument: Microplate Luminometer.
- Protocol:
- No stopping step. Prepare the plate in subdued light.
- Inject or add the substrate immediately prior to reading, following manufacturer instructions.
- Insert the plate into the luminometer.
- Set integration time per well (typically 100-1000 milliseconds).
- Measure Relative Light Units (RLUs). Signal kinetics are important; read all plates in an experiment with a consistent delay after substrate addition.
C. Fluorescence Measurement (Fluorescent ELISA)
- Instrument: Microplate Fluorometer.
- Protocol:
- Stop the reaction if required by the substrate protocol.
- Insert the plate into the fluorometer.
- Set the optimal excitation and emission wavelengths (see Table 1).
- Set bandwidths and gain sensitivity.
- Measure Relative Fluorescence Units (RFUs).
Table 1: Common ELISA Substrates and Measurement Parameters
| Enzyme | Substrate Type | Substrate Example | Product Color / Type | Peak Absorbance (nm) | Ex/Em (nm) | Stop Solution | Measurement |
|---|---|---|---|---|---|---|---|
| HRP | Chromogenic | TMB (Tetramethylbenzidine) | Blue -> Yellow | 450* (650 for kinetic) | N/A | 1N H₂SO₄ | Absorbance |
| HRP | Chromogenic | OPD (o-Phenylenediamine) | Orange-Brown | 492 | N/A | 1N H₂SO₄ | Absorbance |
| HRP | Chemiluminescent | Luminol / Peroxide | Light | N/A | N/A | Not Used | Luminescence (RLU) |
| AP | Chromogenic | PNPP (p-Nitrophenyl Phosphate) | Yellow | 405 | N/A | 1N NaOH | Absorbance |
| AP | Chemiluminescent | CDP-Star / CSPD | Light | N/A | N/A | Not Used | Luminescence (RLU) |
| AP | Fluorogenic | 4-MUP (4-Methylumbelliferyl Phosphate) | Fluorescent | N/A | 360/450 | 1N NaOH | Fluorescence (RFU) |
Note: *TMB absorbance is read at 450nm after acid stop. *Chemiluminescence does not require specific excitation light.*
Critical Factors and Troubleshooting
- Kinetics: The enzyme reaction is time-dependent. Consistent timing between substrate addition and stopping/reading is paramount.
- Signal Saturation: Overly high signals may exceed the linear range of the reader (typically OD > 2.5-3.0 for absorbance). Samples may require dilution and re-assay.
- Bubbles: Bubbles in wells will scatter light and cause erroneous readings. Pop them with a fine needle before reading.
- Volume Discrepancies: Evaporation or unequal volumes can affect path length and absorbance. Seal plates during incubation if possible.
- Plate Reader Calibration: Regular maintenance and calibration of the microplate reader using neutral density filters or reference standards are essential.
The Scientist's Toolkit: Key Research Reagent Solutions
Table 2: Essential Materials for Signal Measurement and Stopping
| Item | Function / Description | Key Consideration |
|---|---|---|
| Stop Solution (e.g., 1N H₂SO₄, 1N NaOH) | Halts enzyme activity by denaturing the enzyme via extreme pH change. | Must be matched to the enzyme-substrate pair. Handle with appropriate PPE. |
| Chromogenic Substrate (e.g., TMB, PNPP) | Provides the chromogen that the enzyme converts to a colored product. | Light-sensitive. Must be prepared fresh or stored as per manufacturer guidelines. |
| Chemiluminescent Substrate | Provides a luminogenic compound that emits light upon enzyme conversion. | Highly sensitive to light and temperature. Use immediately after preparation. |
| Microplate Reader (Spectrophotometer) | Measures the absorbance of light by the colored product in each well. | Must have correct filters/monochromator for substrate wavelength. |
| Microplate Luminometer | Measures the intensity of light emitted from chemiluminescent reactions. | Requires sensitive photomultiplier tubes (PMTs) and should be kept in a dark room. |
| Clear or White Flat-Bottom Plates | Optimal plate type for absorbance or luminescence measurements, respectively. | Plate type must be compatible with the detection mode and reader. |
| Multichannel Pipette & Reagent Reservoirs | Ensures rapid and uniform addition of stop solution across the plate. | Critical for maintaining consistent reaction times across all wells. |
Experimental Workflow and Data Pathway
Diagram Title: ELISA Step 6: Signal Measurement Decision and Workflow
This guide is a core chapter within a comprehensive thesis on ELISA step-by-step methodology. Accurate data analysis, specifically the generation of a standard curve and subsequent interpolation of unknown sample concentrations, is the critical final step that determines the validity and quantitative output of any ELISA experiment. This process transforms raw absorbance values into meaningful biological data, forming the basis for conclusions in research, diagnostic development, and drug discovery.
Core Principles of the Standard Curve
A standard curve is a plot of known concentrations of a reference standard analyte against their corresponding assay signal (typically absorbance). It establishes the relationship between concentration and response, allowing for the interpolation of unknown sample concentrations. The most common model applied to ELISA data is the Four-Parameter Logistic (4PL) curve, which accounts for the sigmoidal nature of the binding response.
Mathematical Models for Curve Fitting
The following models are routinely used:
| Model Name | Equation | Best Use Case | Advantages | Limitations |
|---|---|---|---|---|
| Linear | y = mx + c |
Only the central, linear portion of the ELISA range. | Simple, intuitive. | Poor fit for full sigmoidal data; inaccurate at extremes. |
| Log-Linear | y = m*log(x) + c |
Rough approximation over limited range. | Simple with transformed data. | Not truly representative of binding kinetics. |
| Four-Parameter Logistic (4PL) | y = D + (A - D) / (1 + (x/C)^B) |
Standard for most quantitative ELISAs. | Accurately models sigmoidal shape, plateaus, and inflection point. | Requires robust software for fitting. |
| Five-Parameter Logistic (5PL) | y = D + (A - D) / (1 + (x/C)^B)^E |
Asymmetric dose-response curves. | Handles asymmetry; even more flexible than 4PL. | More complex; requires more data points. |
Where:
y= Response (Absorbance)x= Analyte ConcentrationA= Minimum asymptote (Background signal)B= Slope factor (Steepness of the curve)C= Inflection point (EC50/IC50)D= Maximum asymptote (Maximum signal)E= Asymmetry factor (5PL only)
Experimental Protocol: Generating and Running the Standard Curve
Preparation of Standard Dilutions
Materials: High-purity reference standard, matrix-matched diluent (e.g., assay buffer or negative sample matrix), serial dilution tubes.
- Reconstitution: Reconstitute the standard according to the Certificate of Analysis to create a high-concentration stock solution.
- Serial Dilution: Perform a serial dilution in the matrix diluent to create a series of known concentrations, typically spanning a 5-6 log range (e.g., from 1000 pg/mL to 15.6 pg/mL for a 7-point 1:2 dilution series).
- Replication: Each concentration point, including the blank (zero standard), should be assayed in duplicate or triplicate.
ELISA Run and Data Acquisition
- Run the prepared standards and unknown samples on the same microplate under identical conditions as per the core ELISA protocol (coating, blocking, detection, etc.).
- Read the final absorbance (Optical Density, OD) using a plate reader at the appropriate wavelength(s).
- Export the raw OD data for analysis.
Step-by-Step Data Analysis Workflow
Quality Control of the Standard Curve
A well-fitted standard curve is paramount. Use these QC parameters:
| QC Parameter | Target Value | Interpretation |
|---|---|---|
| Coefficient of Determination (R²) | ≥ 0.99 | Indicates how well the model explains the variance in the data. |
| Percent Recovery of Standards | 80–120% (esp. 70–130% at LLOQ/ULOQ) | Back-calculated concentration of each standard should be within ±20% of its nominal value. |
| CV of Replicates | < 15% (or < 20% at LLOQ) | Measures precision of replicate wells. |
Example Data Table:
| Standard Point | Nominal Conc. (pg/mL) | Mean OD (Blank Sub.) | Back-Calculated Conc. (pg/mL) | % Recovery | CV% (Replicates) |
|---|---|---|---|---|---|
| Blank | 0.000 | 0.000 | N/A | N/A | N/A |
| 1 | 15.6 | 0.125 | 16.1 | 103.2 | 5.2 |
| 2 | 31.3 | 0.240 | 30.5 | 97.4 | 3.8 |
| 3 | 62.5 | 0.485 | 60.8 | 97.3 | 2.1 |
| 4 | 125.0 | 0.950 | 128.3 | 102.6 | 1.5 |
| 5 | 250.0 | 1.560 | 245.1 | 98.0 | 1.0 |
| 6 | 500.0 | 2.100 | 505.5 | 101.1 | 0.8 |
| 7 | 1000.0 | 2.350 | 995.2 | 99.5 | 1.2 |
| Curve Fit (4PL) | R² = 0.9993 |
Interpolation of Unknown Samples
- Input the background-subtracted, averaged OD for each unknown sample into the fitted curve equation.
- The software (or manual calculation) solves for
x(concentration) given they(OD) value. - Multiply the interpolated concentration by the total dilution factor applied to the sample prior to the assay to obtain the final concentration in the original sample matrix.
The Scientist's Toolkit: Essential Reagents & Software
| Item | Function & Importance |
|---|---|
| Reference Standard (Calibrator) | Highly characterized, pure analyte used to construct the standard curve. Defines the quantitative scale of the assay. |
| Matrix-Matched Diluent | Buffer or negative sample matrix identical to the sample milieu. Ensures equal protein binding and background, preventing matrix effects that distort the curve. |
| Microplate Reader | Photometer that accurately measures absorbance (OD) at specific wavelengths (e.g., 450 nm, 620 nm reference). Sensitivity and linear range are critical. |
| Data Analysis Software | Specialized software (e.g., SoftMax Pro, GraphPad Prism, Gen5, ELISA Analysis Tool) capable of nonlinear regression (4PL/5PL) fitting and sample interpolation. |
| Precision Pipettes & Tips | Essential for accurate serial dilution of the standard and sample handling. Small volumetric errors propagate into large curve inaccuracies. |
Advanced Considerations
- Dynamic Range & LLOQ/ULOQ: The Lower and Upper Limits of Quantification define the concentration range where the assay is precise and accurate. These are determined from the standard curve using predefined criteria for precision (CV%) and accuracy (% Recovery).
- Sample Results Outside the Curve: Samples with ODs above the top standard (ULOQ) must be diluted and re-assayed. Samples below the LLOQ should be reported as "< LLOQ" as their concentration cannot be reliably quantified.
- Automation & Compliance: In regulated drug development (GLP/GCP), use of validated, audit-trail-enabled software is mandatory for final data reporting.
This systematic approach to standard curve generation and analysis ensures the reliable, reproducible, and defensible quantification of analytes that is fundamental to all ELISA-based research and development.
Best Practices for Sample Handling, Storage, and Plate Washing
Within the comprehensive framework of an ELISA step-by-step guide, mastering pre-analytical and post-analytical phases is critical for assay fidelity. This whitepaper details best practices for sample handling, storage, and plate washing—fundamental processes that directly impact sensitivity, specificity, and reproducibility in drug development and biomedical research.
Sample Handling and Pre-Analytical Variables
Proper sample handling is the first defense against assay variability.
Key Principles:
- Aseptic Technique: Minimize microbial contamination.
- Temperature Control: Maintain specified temperatures during processing.
- Timeliness: Process samples within validated stability windows.
- Homogenization: Ensure sample uniformity before aliquoting.
Recommended Stability Windows for Common Sample Types: Table 1: Typical sample stability at room temperature (RT) and recommended processing.
| Sample Type | Stability at RT (Hours) | Recommended Processing Step |
|---|---|---|
| Serum (clotted) | 2-4 | Centrifuge at 1000-2000 x g for 10 min. |
| Plasma (EDTA) | 0.5-1 | Centrifuge at 1000-2000 x g for 15 min. |
| Cell Culture Supernatant | 1-2 | Centrifuge at 500 x g for 5 min to remove cells. |
| Tissue Homogenate | <1 | Aliquot immediately; store on ice. |
Sample Storage Protocols
Long-term sample integrity requires standardized storage conditions.
Methodology for Establishing Storage Conditions:
- Aliquot Samples: Aliquot into small, single-use volumes to avoid freeze-thaw cycles.
- Use Suitable Vials: Use low-protein-binding, cryogenic tubes.
- Rapid Freezing: Snap-freeze in liquid nitrogen or dry ice for labile analytes.
- Storage Temperature: Store at or below -70°C for long-term preservation of most proteins.
- Documentation: Log freezer temperature continuously and track freeze-thaw cycles.
Quantitative Impact of Freeze-Thaw Cycles: Table 2: Analyte recovery (%) after multiple freeze-thaw cycles.
| Analyte Type | 1 Cycle | 2 Cycles | 3 Cycles | Recommendation |
|---|---|---|---|---|
| Cytokines (e.g., IL-6) | 95-100% | 90-95% | 80-90% | ≤ 2 cycles |
| Phosphoproteins | 85-95% | 70-85% | 50-70% | Avoid; assay fresh |
| IgG Antibodies | 98-100% | 95-98% | 92-95% | ≤ 3 cycles |
Plate Washing: A Critical Experimental Protocol
Effective washing removes unbound materials, reducing background noise and improving signal-to-noise ratio.
Detailed Manual Washing Protocol:
- Decantation: Quickly invert the microplate over a sink and tap firmly on absorbent paper.
- Filling: Using a wash bottle or multichannel pipette, fill each well completely with wash buffer (e.g., PBS with 0.05% Tween 20).
- Soaking: Allow the plate to soak for 30 seconds to 1 minute to dissociate nonspecifically bound material.
- Decantation: Invert and empty the plate again. Repeat steps 2-4 for the total number of washes (typically 3-5).
- Final Removal: After the last wash, tap the plate vigorously on absorbent paper to remove residual droplets.
- Immediate Proceeding: Proceed to the next assay step immediately to prevent wells from drying out.
Automated Washer Best Practices:
- Calibration: Regularly calibrate washer heads for alignment and volume.
- Prime Lines: Prime with wash buffer before running.
- Check Nozzles: Ensure no clogging or partial dispensing.
- Residual Volume: Optimize aspiration to leave a consistent, minimal residual volume (typically <5 µL).
Impact of Wash Parameters on Assay Performance: Table 3: Effect of wash variables on ELISA output.
| Wash Variable | Inadequate Practice | Optimal Practice | Effect on Results |
|---|---|---|---|
| Number of Washes | < 3 | 3-5 | High background with fewer washes. |
| Wash Volume per Well | 200 µL | 300-350 µL | Improved removal of unbound conjugate. |
| Soak Time | 0 seconds | 30-60 seconds | Reduces nonspecific binding. |
| Wash Buffer Additive | None | 0.05% Tween 20 | Lowers hydrophobic interactions. |
The Scientist's Toolkit: Research Reagent Solutions
Table 4: Essential materials for sample handling and plate washing.
| Item | Function & Importance |
|---|---|
| Low-Protein-Binding Microtubes (e.g., siliconized tubes) | Minimizes analyte loss due to adhesion to tube walls during sample aliquoting and storage. |
| Cryogenic Vials | Designed to withstand extreme temperatures of liquid nitrogen and -80°C freezers without cracking. |
| PBS with 0.05% Tween 20 (PBST) | Standard wash buffer; the detergent disrupts hydrophobic interactions to reduce background. |
| Plate Sealers | Prevent evaporation and contamination during sample incubation and storage. |
| Automated Microplate Washer | Provides consistent, reproducible wash cycles, critical for high-throughput screening and assay uniformity. |
| Multichannel Pipette | Enables rapid, uniform dispensing of wash buffer across rows/columns during manual washing. |
| Microplate Absorbent Blotting Paper | For effective removal of residual wash buffer after decanting. |
Visualizing the Workflow and Impact
Diagram Title: Impact of Pre- and Post-Analytical Steps on ELISA Outcomes
Diagram Title: Manual Plate Washing Protocol Workflow
Integrating rigorous sample handling, standardized storage, and meticulous plate washing protocols into an ELISA workflow is non-negotiable for generating reliable, publication-quality data. These practices form the foundation upon which the specificity and sensitivity of the entire assay are built, ensuring that results accurately reflect biological reality rather than pre-analytical or technical artifacts.
Within the comprehensive framework of ELISA step-by-step guide research, precise quantification of biomolecules is foundational. Enzyme-Linked Immunosorbent Assay (ELISA) remains the cornerstone technique for detecting and quantifying specific proteins, cytokines, antibodies, and other analytes in complex biological matrices. This technical guide details the advanced applications, protocols, and data analysis critical for modern research and therapeutic development.
Core Assay Formats and Quantitative Data
The selection of ELISA format is dictated by the analyte and sample type. Key quantitative performance metrics are summarized below.
Table 1: Comparative Performance of Major ELISA Formats
| Format | Target Analytes | Typical Sensitivity Range | Dynamic Range | Key Advantage | Common Application |
|---|---|---|---|---|---|
| Direct ELISA | Antigens with high abundance | 0.5 - 5 ng/mL | ~2 logs | Speed, simplicity | Screening purified proteins, viral capsids |
| Indirect ELISA | Specific antibodies (e.g., serum IgG) | 0.1 - 1 μg/mL | ~2.5 logs | Signal amplification | Serology, immunogenicity testing |
| Sandwich ELISA | Cytokines, biomarkers, complex antigens | 1 - 10 pg/mL | ~3-4 logs | High specificity & sensitivity | Biomarker discovery, pharmacokinetics |
| Competitive/Inhibition ELISA | Small molecules, haptens, drugs | 0.1 - 10 ng/mL | ~2 logs | Measures low-MW analytes | Therapeutic drug monitoring, hormones |
Table 2: Representative Sensitivity of Sandwich ELISA for Key Cytokines
| Cytokine | Common Function | Typical Detection Limit (pg/mL) | Sample Matrix (Typical) |
|---|---|---|---|
| IL-6 | Pro-inflammatory | 0.5 - 2 | Serum, cell supernatant |
| TNF-α | Pro-inflammatory, apoptosis | 1 - 5 | Plasma, tissue lysate |
| IFN-γ | Antiviral, immunomodulatory | 5 - 15 | Serum, PBMC culture |
| IL-10 | Anti-inflammatory | 1 - 3 | Serum, cell supernatant |
| IL-17A | Pro-inflammatory, autoimmunity | 2 - 8 | Serum, synovial fluid |
Detailed Experimental Protocol: Sandwich ELISA for Cytokine Quantification
This protocol is for a quantitative, colorimetric sandwich ELISA, representing the gold standard for precise cytokine measurement.
Day 1: Coating and Blocking
- Coating: Dilute the capture antibody in carbonate-bicarbonate coating buffer (0.1 M, pH 9.6) to the manufacturer's recommended concentration (typically 1-10 μg/mL). Add 100 μL per well to a 96-well microplate.
- Seal the plate and incubate overnight at 4°C.
Day 2: Sample and Standard Incubation
- Wash the plate 3 times with 300 μL PBS containing 0.05% Tween 20 (PBST) using a plate washer or manual aspirator.
- Blocking: Add 300 μL of blocking buffer (e.g., 5% BSA or 1% Casein in PBS) per well. Incubate for 1-2 hours at room temperature (RT).
- Wash plate 3x with PBST.
- Prepare Standard Curve: Perform a serial dilution (e.g., 2-fold or 10-fold) of the recombinant cytokine standard in the sample diluent (e.g., blocking buffer with 0.05% Tween). Include a blank (zero) standard.
- Add Samples & Standards: Add 100 μL of prepared standards, samples, and appropriate controls (spiked recovery, QC samples) to designated wells. Incubate for 2 hours at RT or 1 hour at 37°C on a plate shaker.
- Wash plate 5x with PBST.
Day 2: Detection and Development
- Detection Antibody: Add 100 μL per well of the biotinylated detection antibody, diluted in blocking buffer. Incubate for 1-2 hours at RT.
- Wash plate 5x with PBST.
- Enzyme Conjugate: Add 100 μL per well of Streptavidin-Horseradish Peroxidase (SA-HRP), diluted per manufacturer's instructions. Incubate for 30-60 minutes at RT in the dark.
- Wash plate 7x with PBST.
- Substrate Development: Add 100 μL of TMB (3,3',5,5'-Tetramethylbenzidine) substrate solution per well. Incubate in the dark for 5-30 minutes until a clear blue color develops in the highest standards.
- Stop Reaction: Add 50 μL of 1M H₂SO₄ or 2N HCl per well. The color will change from blue to yellow.
- Readout: Measure the absorbance at 450 nm (primary) and 570 nm or 620 nm (reference wavelength for subtraction) using a microplate reader within 30 minutes.
Workflow and Pathway Visualizations
Sandwich ELISA Experimental Workflow
JAK-STAT Pathway Targeted by Cytokine ELISAs
The Scientist's Toolkit: Essential Research Reagent Solutions
Table 3: Key Reagents and Materials for Quantitative ELISA
| Reagent/Material | Function & Critical Role | Selection Criteria & Notes |
|---|---|---|
| High-Binding Microplates | Solid phase for antibody/antigen immobilization. | Polystyrene, protein-binding capacity >400 ng IgG/cm². Ensure lot-to-lot consistency. |
| Matched Antibody Pair | Capture and detection antibodies for sandwich ELISA. | Must recognize non-overlapping epitopes. Validate pair for specificity, sensitivity, and lack of cross-reactivity. |
| Recombinant Protein Standard | Calibrant for generating the quantitative standard curve. | Lyophilized or liquid. Purity >95%. Must be biologically active and identical to the endogenous analyte. |
| Detection Enzyme Conjugate | Signal generation (e.g., HRP, AP). Often Streptavidin-linked. | High Specific Activity. Check for interference from sample matrix (e.g., endogenous biotin, HRP inhibitors). |
| Chromogenic Substrate (TMB/OPD) | Enzymatic conversion to colored product for absorbance reading. | TMB is preferred for higher sensitivity and safer stop solution. Use stabilized, ready-to-use solutions. |
| Plate Washer/Buffer | Removes unbound material to reduce background signal. | Automated washers improve reproducibility. Buffer typically PBS with 0.05-0.1% Tween 20. |
| Plate Reader | Measures absorbance of developed colorimetric reaction. | Capable of reading at 450 nm (TMB) and a reference wavelength (e.g., 570 or 620 nm). |
| Sample Diluent/Assay Buffer | Matrix for diluting standards and samples. | Mimics sample matrix to minimize matrix effects. Often contains a blocking agent (BSA) and detergent. |
ELISA Troubleshooting: Diagnosing and Solving Common Problems
Within the context of a comprehensive step-by-step guide to ELISA research, managing background signal is paramount for assay validity. High background undermines the signal-to-noise ratio, obscuring true positive results, reducing dynamic range, and compromising data integrity in both diagnostic and drug development settings. This guide details the root causes and provides actionable, evidence-based corrective protocols.
Primary Causes and Quantitative Impact
The following table summarizes common causes, their mechanisms, and typical quantitative impact on absorbance (OD) readings.
Table 1: Causes and Impact of High ELISA Background
| Cause Category | Specific Cause | Mechanism | Typical Background Increase (OD450) |
|---|---|---|---|
| Antibody Issues | Non-specific binding | Cross-reactivity with non-target antigens or plate components. | 0.3 - 0.8 |
| Inadequate blocking | Insufficient coverage of protein-binding sites on the plate. | 0.4 - 1.0+ | |
| High antibody concentration | Aggravates non-specific binding. | 0.2 - 0.6 | |
| Reagent & Plate | Contaminated reagents | Microbial growth or particulates. | Variable, often >0.5 |
| Plate type mismatch | High-binding plate used where a medium/low-binding is optimal. | 0.2 - 0.5 | |
| Wash Stringency | Inadequate wash buffer/volume | Incomplete removal of unbound reagents. | 0.3 - 0.7 |
| Insufficient wash cycles | Residual detection components remain. | 0.3 - 0.9 | |
| Detection | Substrate degradation/contamination | Spontaneous oxidation or contamination leading to premature chromogen conversion. | 0.2 - 1.0+ |
| Overdevelopment | Extended incubation beyond linear range. | Increases over time | |
| Sample & Matrix | Endogenous enzymes (HRP/AP) | In biological samples (e.g., serum), can directly act on substrate. | 0.2 - 0.6 |
| Heterophilic antibodies | Cause bridging between capture and detection antibodies. | 0.5 - 1.5+ |
Experimental Protocols for Diagnosis and Correction
Protocol 1: Systematic Diagnosis of Background Source Objective: To isolate the component responsible for elevated background. Materials: Coated ELISA plate, all assay reagents (blocker, antibodies, substrate, stop solution). Method:
- Set up the following wells in triplicate:
- Well A: Coating + Blocking + Substrate.
- Well B: Coating + Blocking + Detection Ab (with conjugate) + Substrate.
- Well C: Coating + Blocking + Sample (if applicable) + Detection Ab + Substrate.
- Well D: Full protocol (all reagents).
- Incubate and develop substrate per standard protocol.
- Interpretation: High signal in A indicates substrate or plate issues. Signal in B but not A points to detection antibody non-specificity. Signal in C but not B suggests sample interference. Signal in D only confirms assay-specific background.
Protocol 2: Checkerboard Titration for Optimal Reagent Concentrations Objective: To determine the optimal concentration of capture and detection antibodies that maximizes signal-to-noise. Materials: Antigen, capture antibody, detection antibody, full ELISA kit components. Method:
- Coat plate with varying concentrations of capture antibody (e.g., 0.5, 1, 2, 4 µg/mL) overnight.
- Block plate.
- Apply a fixed, known concentration of antigen.
- Apply varying concentrations of detection antibody (e.g., 0.1, 0.25, 0.5, 1 µg/mL).
- Complete assay with standardized conjugate, substrate, and development times.
- Plot signal vs. background (no-antigen control) for each combination. The optimal pair is the lowest concentration yielding high specific signal with minimal background.
Protocol 3: Blocking Optimization and Stringency Wash Objective: To evaluate and implement enhanced blocking and washing. Materials: Coated plate, various blocking buffers (e.g., 1% BSA, 5% Non-fat dry milk, Commercial Protein-Free blocker), wash buffer with/without additives. Method:
- Divide coated plate into sections for each blocker.
- Block with candidate buffers for 1 hour at 37°C or overnight at 4°C.
- Include a wash stringency test: For each blocking condition, wash one set of wells with standard PBS-T (0.05% Tween-20) and another with a higher stringency buffer (e.g., PBS with 0.1% Tween-20 or 500 mM NaCl).
- Run the remainder of the assay identically.
- Compare background OD from no-antigen wells. Select the blocker/wash combination yielding the lowest background.
The Scientist's Toolkit: Key Reagent Solutions
Table 2: Essential Research Reagents for Background Mitigation
| Reagent/Material | Primary Function | Key Consideration for Background |
|---|---|---|
| High-Purity Antibodies | Specific target binding. | Affinity-purified, pre-adsorbed antibodies minimize cross-reactivity. |
| Protein-Based Blockers (BSA, Serum) | Saturate non-specific sites. | May contain bovine IgGs; can cause interference in some systems. |
| Protein-Free/Polymer Blockers | Inert blocking of sites. | Ideal for samples with heterophilic antibodies or endogenous biotin. |
| High-Purity Tween-20 | Non-ionic detergent in wash buffer. | Removes unbound reagents; old or impure batches can cause high background. |
| Stabilized TMB Substrate | Chromogenic signal generation. | Stabilized, ready-to-use low-pH TMB reduces non-enzymatic oxidation. |
| Heterophilic Antibody Blocking Reagents | Neutralize interfering human antibodies. | Essential for clinical serum/plasma samples to prevent false positives. |
| Low/Mid-Binding ELISA Plates | Solid phase for assay. | Reduces passive adsorption of assay components vs. high-binding plates. |
Visualization of Pathways and Workflows
Diagram 1: ELISA High Background Troubleshooting Workflow
Diagram 2: Sample-Induced Interference Pathways in ELISA
Within the broader thesis of a step-by-step guide to ELISA research, the dynamic range of an assay is a critical performance metric. It defines the span between the lower limit of detection (LLOD) and the upper limit of quantification (ULOQ), within which analyte concentration can be measured with accuracy and precision. A narrow dynamic range, characterized by premature signal saturation at high concentrations and poor sensitivity at low concentrations, severely limits an assay's utility in research and drug development. This technical guide delves into the mechanistic causes of low signal and poor sensitivity, providing actionable, in-depth methodologies to systematically expand the working dynamic range of immunoassays, with a focus on ELISA.
Fundamental Principles: What Limits Dynamic Range?
The dynamic range in a sandwich ELISA is constrained by two primary factors:
- Poor Sensitivity (Low Signal at Low Concentrations): Caused by insufficient capture or detection of the target molecule, often due to low-affinity antibodies, suboptimal reagent concentrations, or inefficient signal generation.
- Signal Saturation (High-End Hook Effect): At very high analyte concentrations, all antibody binding sites become saturated. In a sandwich assay, this can lead to a prozone effect where analyte molecules saturate the capture antibody but are bound by only one detection antibody, preventing cross-linking and resulting in a false-low signal.
Strategies and Experimental Protocols for Range Expansion
Optimizing Core Assay Components
Protocol: Checkerboard Titration for Antibody & Antigen Optimization
- Objective: To determine the optimal pair and concentration of capture and detection antibodies that maximize sensitivity while delaying saturation.
- Materials: 96-well plate, coating buffer (e.g., PBS, pH 7.4), blocking buffer (e.g., 1-5% BSA/PBS), serial dilutions of capture antibody, serial dilutions of antigen standard, serial dilutions of detection antibody, appropriate wash buffer, signal generation reagents.
- Method:
- Coat wells with varying concentrations of capture antibody (e.g., 0.5, 1, 2, 4 µg/mL) overnight at 4°C.
- Block plate for 1-2 hours at room temperature (RT).
- Apply a matrix of antigen standard concentrations (including a high concentration to test for hook effect) across the different capture antibody conditions.
- Apply varying concentrations of detection antibody (e.g., 0.25, 0.5, 1, 2 µg/mL) in a cross-matrix fashion.
- Complete assay with standard amplification and detection steps.
- Plot signal vs. antigen concentration for each antibody combination. The optimal pair yields the highest sensitivity (steepest slope at low concentration) and the highest saturation point.
Table 1: Example Data from Checkerboard Titration Analysis
| Capture Ab [µg/mL] | Detection Ab [µg/mL] | LLOD [pg/mL] | ULOQ [ng/mL] | Dynamic Range (Log) |
|---|---|---|---|---|
| 1.0 | 0.5 | 15.6 | 2.0 | 5.1 |
| 2.0 | 0.5 | 10.2 | 4.0 | 5.6 |
| 4.0 | 1.0 | 8.5 | 8.0 | 6.0 |
| 4.0 | 0.5 | 7.1 | 10.0 | 6.2 |
Signal Amplification and Detection Strategies
Protocol: Implementation of Tyramide Signal Amplification (TSA)
- Objective: Dramatically increase sensitivity for low-abundance targets without increasing background.
- Principle: A horseradish peroxidase (HRP)-conjugated detection antibody catalyzes the deposition of numerous labeled tyramide molecules onto the assay well near the enzyme site.
- Method (Post-Standard Detection):
- Complete a standard sandwich ELISA up to and including incubation with a biotinylated detection antibody.
- Incubate with Streptavidin-HRP (sa-HRP) for 30-60 minutes at RT.
- Wash thoroughly.
- Prepare working solution of fluorophore- or enzyme-labeled tyramide reagent per manufacturer's instructions.
- Incubate with tyramide working solution for 2-10 minutes (critical optimization step).
- Stop reaction by washing. If using fluorescent tyramide, read directly. If using enzyme-labeled tyramide, add appropriate substrate.
Table 2: Impact of Signal Amplification on Dynamic Range
| Detection Method | LLOD (pg/mL) | ULOQ (ng/mL) | Dynamic Range (Log) | Assay Time |
|---|---|---|---|---|
| Direct HRP/Chromogen | 50.0 | 5.0 | 5.0 | 4 hours |
| Sa-HRP/Chromogen | 12.5 | 5.0 | 5.6 | 5 hours |
| TSA (Fluorescent) | 0.5 | 5.0 | 7.0 | 6 hours |
Alternative Approach: Sequential & Saturation Assay Formats
Protocol: Sequential Saturation Assay to Mitigate Hook Effect
- Objective: Prevent the high-dose hook effect and extend the ULOQ.
- Principle: The analyte is first bound to the capture antibody. After washing away excess, the detection antibody is added. This ensures all captured analyte is available for detection, even at very high concentrations.
- Method:
- Coat and block plate as usual.
- Incubate with sample/standard. DO NOT add detection antibody simultaneously.
- Wash plate thoroughly to remove unbound analyte.
- Then, incubate with the detection antibody. This ensures a true 1:1 binding ratio for the sandwich, even at supra-physiological analyte concentrations.
- Proceed with standard detection steps.
Diagram Title: Sequential vs. Standard Assay Workflow to Prevent Hook Effect
The Scientist's Toolkit: Key Research Reagent Solutions
Table 3: Essential Materials for Dynamic Range Optimization
| Reagent / Solution | Function & Rationale for Range Optimization |
|---|---|
| High-Affinity, Matched Antibody Pair | Minimizes nonspecific binding (lowers background) and maximizes specific signal at low concentrations, directly improving sensitivity and LLOD. |
| Recombinant Protein Standard | Provides accurate quantification and enables precise calibration curve generation across the intended range. |
| Tyramide Signal Amplification (TSA) Kits | Enzyme-mediated deposition of numerous labels dramatically increases signal per binding event, lowering LLOD by 10-100x. |
| Pre-coated & Validated ELISA Plates | Reduces well-to-well and lot-to-lot variability, ensuring consistent performance across the dynamic range. |
| Stable, High-Sensitivity Chemiluminescent Substrate | Generates high-intensity, low-background signal with a wide linear range, delaying saturation at high analyte concentrations. |
| Sample Diluent with Matrix Matching | Mitigates matrix interference effects that can compress the dynamic range, ensuring accuracy in biological samples. |
Integrated Workflow for Systematic Optimization
Diagram Title: Systematic Workflow to Increase ELISA Dynamic Range
Expanding the dynamic range of an ELISA is a systematic exercise in balancing the conflicting demands of sensitivity and saturation. By methodically optimizing reagent selection (Table 3), employing advanced signal amplification techniques like TSA (Table 2), and adopting intelligent assay formats such as sequential saturation, researchers can develop robust assays capable of quantifying analytes across concentrations spanning 4-7 orders of magnitude. This capability is indispensable in drug development, where measuring both subtle biological changes and supra-physiological drug concentrations within a single assay accelerates research and improves data fidelity. Integrating these strategies into a step-by-step ELISA development thesis ensures the creation of fit-for-purpose tools that deliver reliable data across the full spectrum of expected analyte concentrations.
High Variation and Poor Reproducibility (High CV%)
Within the broader framework of a step-by-step ELISA research guide, addressing high coefficient of variation (CV%) is paramount. High inter- and intra-assay variability undermines data reliability, compromises statistical power, and impedes drug development pipelines. This whitepaper details the technical roots of ELISA variability and provides actionable, detailed protocols for mitigation, ensuring robust, reproducible quantitation of analytes.
Recent literature and technical bulletins identify critical control points. The summarized data below highlights the proportional contribution of each step to total assay CV%.
Table 1: Primary Contributors to High CV% in ELISA
| Process Step | Typical CV% Contribution | Key Factors Influencing Variability |
|---|---|---|
| Sample Preparation | 25-35% | Inconsistent collection, hemolysis, freeze-thaw cycles, matrix effects. |
| Liquid Handling | 20-30% | Pipetting technique (manual vs. automated), calibration, tip wetting. |
| Incubation Steps | 15-25% | Time, temperature uniformity, evaporation, plate sealing. |
| Washing | 15-20% | Insufficient cycles, residual volume, buffer contamination, aspirator alignment. |
| Detection & Readout | 10-15% | Reader calibration, wavelength accuracy, plate well optics. |
Detailed Experimental Protocols for Investigation and Mitigation
Protocol 3.1: Systematic Pipette Calibration and Technique Validation
Objective: To quantify and minimize liquid handling error. Materials: Certified calibration weights (for positive displacement pipettes), dye solution (e.g., 0.1% w/v Orange G), low-binding microcentrifuge tubes, plate reader capable of measuring absorbance at 490 nm. Method:
- Gravimetric Calibration: Dispense distilled water onto an analytical balance at 10%, 50%, and 100% of pipette volume. Perform 10 replicates per volume. Calculate accuracy and precision (CV%).
- Dye-Based Uniformity Test: Pipette 100 µL of dye solution into all 96 wells of a microplate using the same pipette and tip lot. Measure absorbance.
- Data Analysis: Calculate inter-well CV% from absorbance values. A CV% >5% indicates problematic technique or equipment requiring intervention.
Protocol 3.2: Optimization of Plate Washing Efficiency
Objective: To standardize washing to minimize background and well-to-well variation. Materials: ELISA plate washer, wash buffer (PBS + 0.05% Tween-20), residual volume detection kit (e.g., containing a non-interfering fluorescent marker). Method:
- Prime washer lines thoroughly with wash buffer.
- Using a mock-coated plate, perform a standard wash cycle. After the final aspiration, add 50 µL of detection reagent to each well.
- Measure fluorescence/absorbance to visualize residual volume patterns (edge effects, streaks).
- Iteratively adjust washer height (typically 0.5-1.0 mm above well bottom) and soak time (e.g., 5-30 seconds) until residual volume CV% across the plate is minimized (<10%).
Protocol 3.3: Kinetic vs. Endpoint Read Comparison for Dynamic Range
Objective: To determine if endpoint saturation is causing high variation in high-concentration samples. Materials: ELISA substrate (e.g., TMB), stop solution (1M H2SO4), plate reader capable of kinetic reads. Method:
- Develop the plate with substrate. Immediately place in the reader.
- Take kinetic reads every 30-60 seconds for 15-20 minutes.
- For a separate set of identical wells, stop the reaction at a traditional fixed timepoint (e.g., 10 minutes).
- Compare the CV% of the high-standard replicates between the linear phase of the kinetic read (selected timepoint) and the endpoint read. Endpoint CV% is often higher due to non-linear signal plateau.
Visualizing Workflows and Relationships
Title: Root Cause Analysis of High CV% in ELISA
Title: Optimized ELISA Workflow for Low CV%
The Scientist's Toolkit: Key Research Reagent Solutions
Table 2: Essential Materials for Reproducible ELISA
| Item | Function & Rationale for Reducing CV% |
|---|---|
| Certified Calibration Standards | Traceable reference material for creating standard curves; minimizes curve-fitting error. |
| Matrix-Matched Controls | Controls (e.g., pooled normal serum) that mimic sample matrix; corrects for non-specific interference. |
| Stable, Lyophilized Reagent Pellets | Eliminates variability from reconstitution and aliquoting of liquid substrates/buffers. |
| Low-Binding Pipette Tips & Microplates | Minimizes adsorption of analyte/capture antibody to plastic surfaces, improving recovery. |
| Automated Plate Washer with Calibrated Height | Ensures consistent aspiration residual volume across all wells and plates. |
| Plate Sealer, Thermally Conductive | Prevents evaporation during incubation and ensures uniform well temperature. |
| Multi-Channel Pipette with Electronic Control | Reduces repetitive strain and improves precision during reagent dispensing. |
| Plate Reader with Shaking & Temperature Control | Provides consistent development conditions for kinetic or endpoint reads. |
Within the framework of a comprehensive ELISA step-by-step guide research, achieving a reliable standard curve is paramount for accurate quantification of target analytes. The ideal standard curve is a sigmoidal logistic plot with a robust linear dynamic range. Deviations from this, specifically non-linear or flattened standard curves, invalidate data and compromise research integrity. This guide details the technical interpretation of these aberrant curves and provides actionable, evidence-based protocols for troubleshooting and resolution, critical for researchers, scientists, and drug development professionals.
Interpretation of Common Aberrant Curve Profiles
A flattened or non-linear standard curve indicates a failure in the assay's fundamental binding kinetics. Correct interpretation is the first step toward a fix.
Table 1: Interpretation of Non-Linear/Flattened Curve Profiles
| Curve Profile | Likely Cause | Underlying Principle |
|---|---|---|
| High-Hook Effect (Prozone) | Extremely high analyte concentration saturates both capture and detection antibodies, preventing sandwich formation. | Antigen excess leads to non-equivalent binding, reducing signal. |
| Low-End Flattening (Shallow Slope) | Poor antibody affinity/avidity, suboptimal conjugate concentration, or matrix interference at low concentrations. | The assay lacks the sensitivity to distinguish between low standard concentrations. |
| Plateauing at High ODs | Signal saturation due to enzyme-substrate depletion or detector saturation. | The reaction exceeds the maximum dynamic range of the substrate or plate reader. |
| General Non-Linearity | Improper standard reconstitution/dilution, pipetting errors, or inconsistent incubation times/temperatures. | Introduces random error and invalidates the assumed serial dilution model. |
Diagnostic and Fix Protocols
The following experimental protocols are designed to systematically identify and correct the root cause.
Protocol 3.1: Diagnosing Antibody or Conjugate Issues
- Objective: Determine if poor binding kinetics cause low-end flattening.
- Materials: Coated plate, analyte standard, detection antibody, streptavidin-HRP (if applicable).
- Method:
- Prepare a standard curve alongside a "Detection Antibody Titration" matrix.
- In separate wells, test 2-3 different concentrations of the detection antibody (e.g., 1:1000, 1:2000, 1:4000 dilutions) across the standard range.
- If using a biotin-streptavidin system, also titrate the streptavidin-enzyme conjugate (e.g., 1:2000, 1:5000, 1:10000).
- Develop and plot the curves. The optimal concentration yields the highest signal-to-noise ratio with a steep linear segment.
- Expected Fix: Optimized reagent concentrations improve sensitivity and slope.
Protocol 3.2: Investigating the High-Hook Effect
- Objective: Confirm antigen excess.
- Materials: Suspected high-concentration sample, assay diluent.
- Method:
- Run the neat sample. Then, prepare a series of 2-fold to 10-fold dilutions of the sample in the recommended assay diluent.
- Analyze all dilutions in the same assay.
- Plot measured concentration vs. dilution factor. A non-linear, hook-like profile confirms antigen excess.
- Expected Fix: Reported concentration should be taken from the dilution that falls within the linear range of the standard curve.
Protocol 3.3: Validating Standard Preparation and Matrix Effects
- Objective: Rule out errors in standard stock or matrix interference.
- Materials: Lyophilized standard, specified reconstitution buffer, sample matrix (e.g., serum, cell culture media).
- Method:
- Pre-wet the pipette tip with buffer before aspirating the standard. Reconstitute thoroughly and allow adequate equilibration time (≥10 mins).
- Perform serial dilutions using reverse pipetting for accuracy.
- For matrix effects, prepare the standard curve in both the provided diluent and a matrix-matched diluent (e.g., analyte-free serum diluted per protocol).
- Compare the two curves. A significant shift in the matrix-matched curve indicates interference.
- Expected Fix: Accurate pipetting techniques and matrix matching restore curve linearity.
Essential Diagrams
Troubleshooting Logic for Aberrant ELISA Curves
Antigen Binding in Ideal vs. Hook Effect Scenarios
The Scientist's Toolkit: Key Research Reagent Solutions
Table 2: Essential Materials for ELISA Curve Troubleshooting
| Reagent/Material | Primary Function in Troubleshooting | Critical Consideration |
|---|---|---|
| Antibody Pair (Mab/Mab) | Provides specificity for sandwich formation. | Use validated, matched pairs from the same vendor to ensure target epitope diversity and avoid competition. |
| Recombinant Purified Standard | Generates the calibration curve for quantification. | Must be identical to the native analyte; verify lyophilized vs. pre-reconstituted stability. |
| Matrix-Matched Diluent | Diluent spiked with analyte-free matrix (e.g., serum). | Critical for identifying and correcting matrix interference that flattens the curve. |
| High-Sensitivity TMB Substrate | Chromogenic solution for HRP-based detection. | Linearly proportional signal generation is vital; use a consistent, fresh lot. |
| Precision Multi-Channel Pipettes | For accurate serial dilution and reagent dispensing. | Regular calibration is mandatory to prevent systematic error in standard preparation. |
| Microplate Reader with Kinetic Mode | Measures absorbance (OD). | Kinetic reads can identify substrate depletion by tracking signal over time. |
| Plate Shaker with Heated Lid | Ensures uniform incubation temperature and mixing. | Eliminates edge effects and temperature gradients that cause well-to-well variability. |
| Data Analysis Software (4PL/5PL) | Fits the sigmoidal standard curve (4 or 5 Parameter Logistic). | Correct model selection (5PL for asymmetry) is essential for accurate extreme concentration quantification. |
Edge Effect (Plate Uniformity Issues) and How to Avoid It
Within the rigorous framework of ELISA step-by-step guide research, achieving uniform signal development across all wells of a microplate is paramount for data accuracy. The "edge effect"—systematic discrepancies in assay signal between wells at the perimeter and those in the interior of the plate—is a pervasive technical challenge that can invalidate results. This guide details the causes, consequences, and mitigation strategies for this phenomenon.
Primary Causes of Edge Effect
Edge effects are primarily driven by differential evaporation rates across the plate. Wells at the perimeter experience greater evaporation due to greater exposure, leading to:
- Increased concentration of reagents (antigens, antibodies, conjugates).
- Altered incubation kinetics and binding equilibria.
- Higher salt concentrations and changes in pH.
- Temperature gradients during incubation.
The consequence is a characteristic pattern of higher signals (in colorimetric assays) around the plate's edges, compromising the validity of internal controls and sample comparisons.
Quantitative Impact Analysis
The following table summarizes typical signal variation data observed due to edge effects in a standard colorimetric ELISA.
Table 1: Typical Edge Effect-Induced Signal Variation in a Colorimetric ELISA
| Plate Zone | Mean Absorbance (450 nm) | Coefficient of Variation (CV) | Deviation from Plate Mean |
|---|---|---|---|
| Interior Wells | 1.25 | 5.2% | +0.0% (Baseline) |
| Edge Wells (Non-Corner) | 1.41 | 8.7% | +12.8% |
| Corner Wells | 1.53 | 10.5% | +22.4% |
Experimental Protocol for Diagnosing Edge Effect
To systematically diagnose edge effect in your ELISA workflow, conduct the following controlled experiment.
Title: Protocol for Edge Effect Diagnosis Using Uniform Substrate Development. Objective: To map inter-well variability attributable to physical plate position. Materials: See "The Scientist's Toolkit" below. Method:
- Plate Preparation: Coat a 96-well plate with a uniform, non-limiting concentration of your target protein (e.g., 100 µL/well of 2 µg/mL capture antibody in carbonate buffer). Seal and incubate overnight at 4°C.
- Uniform Reaction Initiation: Without performing blocking or sample steps, directly add the same volume and concentration of enzyme conjugate (e.g., 100 µL/well of HRV) diluted in assay buffer to all wells using a multichannel pipette. Incubate for 1 hour at room temperature (RT) on a plate shaker.
- Simultaneous Development: After washing, use a reagent reservoir and multichannel pipette to rapidly add TMB substrate (<10 seconds for full plate) to all wells simultaneously.
- Timed Stopping: Precisely after an optimal development time (e.g., 10 minutes), add stop solution (e.g., 1M H₂SO₄) in the same rapid, sequential order used for substrate addition.
- Data Analysis: Read absorbance immediately. Plot values by well position (heat map) and calculate the mean and CV for edge, corner, and interior wells as in Table 1.
Strategies to Avoid Edge Effect
- Physical Sealing: Always use a high-quality, adhesive plate sealer during all incubation steps. Avoid using lids alone.
- Humidified Incubation: Place the sealed plate inside a sealed container or bag with a damp paper towel during extended incubations (especially >30 minutes).
- Consistent Volumes: Use precise pipetting techniques and ensure all wells contain equal volumes. Pre-wet tips for viscous solutions.
- Thermal Equilibration: Allow all reagents and the plate to reach room temperature before starting the assay. Use a thermally uniform incubator or water bath for precise temperature control.
- Plate Layout Design: Place critical standards and controls in both interior and edge positions to monitor the effect. Consider using a "checkerboard" pattern for high-throughput screens.
- Instrumentation: Ensure your plate reader is properly calibrated and that it reads from the center of each well.
Signaling Pathway & Workflow Visualization
The Scientist's Toolkit: Essential Reagents & Materials
Table 2: Key Research Reagent Solutions for Edge Effect Mitigation
| Item | Function & Relevance to Edge Effect |
|---|---|
| High-Binding 96-Well Plate | Ensures uniform protein adsorption across all wells. Inconsistent coating is a primary confounding factor. |
| Adhesive Plate Seals (PCR-quality) | Creates a vapor-proof seal during incubations to prevent differential evaporation at the plate edges. |
| Precision Multichannel Pipette (8 or 12 channel) | Enables simultaneous reagent addition to entire rows/columns, minimizing timing-based incubation differences. |
| Microplate Shaker with Lid | Provides consistent agitation for even mixing and temperature distribution during liquid-phase incubations. |
| Humidified Incubation Chamber | A sealed container with moistened towels maintains a saturated atmosphere, eliminating evaporation gradients. |
| Thermally-Calibrated Incubator | Maintains a uniform temperature (±0.5°C) across the entire plate during critical incubations. |
| TMB Substrate (Single-Component, Ready-to-Use) | Provides consistent, stable chromogen solution, reducing variability introduced by substrate preparation. |
| Timing Device (Laboratory Timer) | Critical for precisely controlling and replicating the enzymatic substrate development time for all wells. |
Within the framework of a comprehensive thesis on ELISA methodology, the Hook Effect (Prozone Effect) represents a critical analytical challenge that can compromise assay validity. In sandwich ELISA, this phenomenon occurs when excessively high concentrations of the target analyte saturate both the capture and detection antibodies, preventing the formation of the requisite "sandwich" complex. This leads to a falsely low or plateaued signal, misinterpreted as a lower analyte concentration. This whitepaper provides an in-depth technical guide to identifying, diagnosing, and resolving the Hook Effect to ensure accurate quantitative results in research and drug development.
Mechanism and Identification
The core mechanism involves analyte excess. At optimal concentrations, each analyte molecule bridges a capture antibody and a detection antibody, generating signal. At supra-optimal concentrations, analyte molecules bind separately to each antibody type, occupying all epitopes without forming bridges, thus diminishing signal.
Key Indicators of the Hook Effect:
- A plateau or decrease in signal intensity in the high-concentration region of the standard curve.
- Discrepancy between expected (e.g., based on sample dilution) and observed analyte concentration.
- Sample dilution yielding a higher calculated concentration than the undiluted sample.
Diagram: Mechanism of the Hook Effect in Sandwich ELISA
Diagnostic Experimental Protocol
Objective: To confirm the presence of the Hook Effect in a sample.
Materials: See "Scientist's Toolkit" below.
Method:
- Prepare a standard serial dilution of the reference analyte per your established protocol.
- Prepare serial dilutions (e.g., 1:2, 1:10, 1:100, 1:1000) of the test sample suspected of causing the Hook Effect. Use the recommended assay buffer.
- Run the sandwich ELISA according to your standard procedure, including the standard curve and all sample dilutions in the same plate.
- Plot the standard curve (Signal vs. Reference Concentration) and calculate the apparent concentration of each sample dilution from the curve.
- Analyze the data. A hallmark sign is non-linearity upon dilution: the calculated concentration does not adjust proportionally. The apparent concentration increases with higher dilution until it plateaus at the true value.
Table 1: Example Data Analysis for Hook Effect Diagnosis
| Sample Dilution Factor | Observed OD (450 nm) | Apparent Concentration (from Std Curve) | Corrected Concentration (Apparent x Dilution) | Interpretation |
|---|---|---|---|---|
| Neat (1:1) | 0.85 | 15 ng/mL | 15 ng/mL | Falsely Low |
| 1:10 | 1.45 | 85 ng/mL | 850 ng/mL | Indicates Hook Effect |
| 1:100 | 1.70 | 120 ng/mL | 12,000 ng/mL | True Value Region |
| 1:1000 | 1.25 | 95 ng/mL | 95,000 ng/mL | Dilution beyond curve |
Resolution Strategies and Protocols
Strategy A: Sample Dilution and Re-Assay
The primary and most straightforward solution.
- Protocol: Repeat the assay with the test sample diluted in assay buffer so that its concentration falls within the linear range of the standard curve. The dilution factor must be determined empirically (see Diagnostic Protocol). Always report the final concentration corrected for the dilution factor.
Strategy B: Assay Optimization with Increased Antibody Concentration
To shift the Hook Effect to higher analyte concentrations.
- Protocol: Titrate both the capture and detection antibodies. Coat plates with increasing concentrations of capture antibody (e.g., 2-20 µg/mL). Similarly, test a range of concentrations for the detection antibody. Identify the combination that yields the highest signal for the mid-range standard while maintaining a low background. Re-generate the standard curve with the optimized conditions; the upper limit of detection (ULOQ) should increase.
Table 2: Comparison of Resolution Strategies
| Strategy | Key Action | Pros | Cons | Best For |
|---|---|---|---|---|
| Sample Dilution | Dilute sample prior to assay | Simple, fast, low-cost. | Requires sufficient sample volume; need to identify correct dilution. | Routine identification and correction. |
| Antibody Optimization | Increase conc. of capture/detection antibodies | Permanently extends assay dynamic range. | More reagent use; requires re-validation of entire assay. | Assay development for known high-concentration targets. |
| Alternative Detection | Use a detection system with higher affinity/titer. | Can improve sensitivity and range. | May require new reagent validation; potential for increased cost. | Stubborn cases where dilution is impractical. |
Diagram: Workflow for Identifying and Resolving the Hook Effect
The Scientist's Toolkit: Key Research Reagent Solutions
Table 3: Essential Materials for Hook Effect Investigation
| Item | Function & Relevance to Hook Effect |
|---|---|
| High-Affinity Matched Antibody Pair | The core reagents. Higher affinity antibodies resist saturation at high analyte concentrations, pushing the Hook point higher. |
| Recombinant Purified Target Protein | Essential for generating a reliable standard curve to diagnose the effect and determine the assay's true dynamic range. |
| HRP (or AP) Conjugated Detection System | Enzyme-conjugated secondary antibody or streptavidin for signal generation. A high-specific-activity conjugate improves signal-to-noise. |
| High-Binding Capacity ELISA Microplate | Ensures sufficient capture antibody can be immobilized, a factor in managing high analyte levels. |
| Precision Multichannel Pipettes & Liquid Handler | Critical for accurately preparing the serial dilutions required for diagnosis and resolution. |
| Plate Reader with Kinetic Capability | For measuring endpoint or kinetic absorbance/fluorescence. Monitoring reaction kinetics can sometimes reveal saturation issues. |
| Data Analysis Software (e.g., SoftMax, GraphPad Prism) | Necessary for generating 4- or 5-parameter logistic (4PL/5PL) standard curves and accurately analyzing non-linear dilution data. |
The Hook Effect is a fundamental interference in sandwich ELISA that must be systematically ruled out in any quantitative assay, especially when analyzing samples of unknown concentration. As part of a rigorous ELISA thesis framework, researchers must incorporate diagnostic dilution experiments during assay development and validation. By understanding its mechanism and applying the described protocols for identification and resolution—primarily through sample dilution and assay optimization—scientists can ensure the accuracy and reliability of their data, which is paramount in research and critical decision-making in drug development.
Within the comprehensive workflow of ELISA research, the optimization of reagent concentrations is a critical, yet often bottleneck, step. The checkerboard titration (also known as chessboard titration) is a systematic, high-throughput method to simultaneously determine the optimal working concentrations of two key reagents, typically a capture antibody and a detection antibody, or an antibody and a sample. This guide details its application within sandwich ELISA development, providing a rigorous protocol for researchers and drug development professionals to establish robust and sensitive assays.
Theoretical Basis and Rationale
The fundamental principle of a sandwich ELISA relies on the efficient formation of an antibody-antigen-antibody complex. Using either a single antibody concentration or an arbitrary dilution for both paired antibodies can lead to suboptimal signal-to-noise ratios, increased background, unnecessary reagent consumption, and reduced assay sensitivity and dynamic range. The checkerboard titration experimentally maps the interaction landscape of the two variables, identifying the combination that yields the highest specific signal with the lowest background. This is essential for achieving a high-performance assay required for pre-clinical and clinical sample analysis.
Detailed Experimental Protocol
Materials and Reagents (The Scientist's Toolkit)
| Item | Function/Description |
|---|---|
| High-Binding 96-Well Microplate | Polystyrene plate treated for optimal protein adsorption. Critical for efficient capture antibody immobilization. |
| Capture Antibody | The first antibody, specific to the target antigen, which is immobilized onto the plate. |
| Detection Antibody | The second, labeled antibody that binds to a different epitope on the captured antigen. |
| Target Antigen (Standard) | Purified recombinant protein of known concentration used to generate the standard curve and for optimization. |
| Blocking Buffer (e.g., 5% BSA in PBS) | Blocks unoccupied binding sites on the plate to minimize non-specific adsorption of reagents. |
| Wash Buffer (e.g., PBS + 0.05% Tween 20) | Removes unbound reagents between steps; detergent reduces non-specific binding. |
| Enzyme Conjugate (e.g., HRP-Streptavidin) | Binds to biotinylated detection antibody, enabling enzymatic signal generation. |
| Chromogenic Substrate (e.g., TMB) | Colorless solution converted by the enzyme (e.g., HRP) into a colored product. |
| Stop Solution (e.g., 1M H2SO4) | Acidic solution that halts the enzyme-substrate reaction, stabilizing the final signal. |
| Plate Reader | Spectrophotometer capable of measuring absorbance at the appropriate wavelength (e.g., 450 nm for TMB). |
| Multichannel Pipette & Reagent Reservoirs | Essential for efficient and consistent liquid handling across the 96-well plate format. |
Step-by-Step Procedure
Plate Coating (Capture Antibody Titration):
- Prepare a 2x serial dilution series of the capture antibody in carbonate-bicarbonate coating buffer (pH 9.6) across a range (e.g., 10 µg/mL to 0.08 µg/mL). Typically, 8 concentrations are prepared.
- Using a multichannel pipette, add 100 µL of each capture antibody dilution to all wells of a single column on the 96-well plate. Each column will therefore represent a single capture antibody concentration.
- Incubate plate at 4°C overnight or at 37°C for 2 hours.
- Aspirate and wash plate 3x with Wash Buffer.
Blocking:
- Add 300 µL of Blocking Buffer to every well.
- Incubate at room temperature for 1-2 hours on a plate shaker.
- Aspirate and wash 3x. The plate can be dried and sealed for short-term storage at 4°C at this point.
Antigen Addition:
- Prepare a 2x serial dilution of the antigen standard in an assay buffer (e.g., PBS with 1% BSA). Typically, 8 concentrations are prepared.
- Add 100 µL of each antigen dilution to all wells of a single row. Each row will therefore represent a single antigen concentration.
- Incubate at room temperature for 2 hours on a shaker.
- Aspirate and wash 3-5x.
Detection Antibody Titration:
- Prepare a 2x serial dilution series of the detection antibody (biotinylated) in assay buffer.
- Following the checkerboard layout, add 100 µL of each detection antibody dilution to the appropriate wells, creating a matrix of all capture x detection combinations for a given antigen concentration.
- Incubate at room temperature for 1-2 hours on a shaker.
- Aspirate and wash 3-5x.
Enzyme Conjugate Incubation:
- Add 100 µL of Streptavidin-HRP (or other appropriate conjugate) at its recommended dilution in assay buffer to every well.
- Incubate at room temperature for 30-60 minutes protected from light.
- Aspirate and wash 3-5x thoroughly.
Substrate Development & Signal Detection:
- Add 100 µL of TMB substrate to every well.
- Incubate in the dark at room temperature for a consistent time (e.g., 15 minutes) or until desired color develops.
- Add 50-100 µL of Stop Solution to each well.
- Read the absorbance at 450 nm (with a 570-650 nm reference wavelength) within 30 minutes.
Data Analysis and Interpretation
The primary data output is a matrix of absorbance values. Analysis focuses on two key outcomes:
- Optimal Pair Selection: Identify the combination of capture and detection antibody concentrations that yields the highest signal for the lowest antigen concentration (maximizing sensitivity) while maintaining a low background (zero antigen control). This point represents the most efficient pair usage.
- Hook Effect Assessment: At high antigen concentrations, observe if the signal plateaus or decreases, which can indicate a prozone (hook) effect.
Table 1: Example Checkerboard Titration Results (Absorbance at 450 nm)
| [Ag] / [Capture Ab] | 2 µg/mL | 1 µg/mL | 0.5 µg/mL | 0.25 µg/mL | 0 µg/mL (Background) |
|---|---|---|---|---|---|
| 100 ng/mL | 3.500* | 3.200 | 2.800 | 1.950 | 0.080 |
| 10 ng/mL | 2.800 | 2.600 | 2.100 | 1.300 | 0.075 |
| 1 ng/mL | 1.200 | 1.350 | 1.400 | 1.000 | 0.070 |
| 0.1 ng/mL | 0.300 | 0.450 | 0.600* | 0.400 | 0.065 |
| 0 ng/mL | 0.085 | 0.080 | 0.075 | 0.070 | 0.060 |
Interpretation: The combination of 0.5 µg/mL Capture Ab and 1 µg/mL Detection Ab (highlighted) provides a strong, specific signal (0.600) at a low antigen concentration (0.1 ng/mL) with a very low background (0.075), making it a prime candidate for the optimal condition.
Key Visualizations
Checkerboard ELISA Experimental Workflow
Checkerboard Plate Layout and Variable Matrix
Within the context of a comprehensive ELISA step-by-step guide research thesis, buffer optimization is a critical, yet often underappreciated, determinant of success. The sensitivity, specificity, and reproducibility of an ELISA hinge on the precise biochemical environment created by the assay buffers. Suboptimal conditions can lead to high background, reduced signal, poor antibody-antigen binding, and non-specific interactions, ultimately yielding unreliable data. This technical guide delves into the core principles of optimizing three fundamental buffer parameters—pH, ionic strength, and key additives—to maximize assay performance in research and drug development applications.
Core Optimization Parameters: Mechanisms and Impact
pH Optimization
The pH of a buffer directly influences the charge and three-dimensional structure of proteins (antibodies, antigens, and enzymes). The isoelectric point (pI) of a protein is paramount; operating at a pH near the pI can promote aggregation, while a pH that stabilizes net charge favors solubility and specific interaction.
- Coating Buffer: Typically carbonate/bicarbonate buffer at pH 9.6. This alkaline pH facilitates the passive adsorption of most proteins (antigens or capture antibodies) to the polystyrene plate by enhancing hydrophobic interactions.
- Assay & Washing Buffers: Near-physiological pH (7.0-7.4) is standard for antigen-antibody binding. Phosphate-buffered saline (PBS) is ubiquitous. Deviations can drastically alter binding kinetics.
- Stop Solution: A strong acid (e.g., 1M H₂SO₄) at low pH (~2.0) denatures the enzyme (HRP), halting the colorimetric reaction precisely.
Table 1: Impact of pH on Common ELISA Components
| Component | Recommended pH Range | Primary Effect of Deviation |
|---|---|---|
| Passive Coating | 9.2 - 9.8 | Reduced adsorption efficiency, uneven coating. |
| Antibody-Antigen Binding | 6.5 - 7.5 | Reduced affinity/kinetics; potential denaturation. |
| Streptavidin-Biotin Interaction | 6.5 - 8.5 | Minimal effect; highly stable across range. |
| HRP Enzyme Activity | 5.0 - 7.0 (Optimum ~6.0) | Significant loss of catalytic activity. |
| AP Enzyme Activity | 9.0 - 10.0 (Optimum ~9.5) | Significant loss of catalytic activity. |
Ionic Strength
Ionic strength, governed by salts like NaCl, modulates electrostatic interactions. The classic "salt bridge" model describes how oppositely charged residues on antibody and antigen surfaces can facilitate binding.
- Low Ionic Strength: Can enhance the longevity of electrostatic attractions but may also promote non-specific binding of charged interferents.
- High Ionic Strength: Shields charged groups, weakening specific electrostatic interactions but also suppressing non-specific ionic binding. An optimal "salt concentration sweet spot" balances these effects.
- Wash Buffers: Often include ~150mM NaCl (isotonic) to maintain protein stability while removing unbound material. Slightly elevated ionic strength (e.g., 300-500mM NaCl) can be used in stringent washes to reduce background.
Critical Additives
Additives are employed to block non-specific binding sites, stabilize proteins, and mitigate assay interference.
Table 2: Common ELISA Buffer Additives and Their Functions
| Additive | Typical Concentration | Primary Function | Considerations |
|---|---|---|---|
| BSA (Bovine Serum Albumin) | 0.1% - 5.0% (w/v) | Blocks non-specific protein binding sites on the plate and assay components. Provides protein stabilizer. | Source (e.g., fatty acid-free) can matter. Potential for cross-reactivity in some assays. |
| Casein | 0.2% - 1.0% (w/v) | Effective blocking agent, often in milk-based buffers. Good for reducing background. | Can contain biotin and AP; unsuitable for respective assays. Prone to bacterial growth. |
| Tween 20 (Polysorbate 20) | 0.05% - 0.1% (v/v) | Non-ionic detergent that reduces hydrophobic interactions and prevents protein aggregation. | Excess (>0.1%) can disrupt antibody-antigen binding and strip coated protein. |
| Proclin (or Sodium Azide) | 0.05% - 0.1% (w/v) | Preservative to inhibit microbial growth in stored buffers. | Sodium azide inhibits HRP; avoid in HRP substrate buffers. Proclin is a common alternative. |
| Carrier Proteins (e.g., Gelatin) | 0.1% - 1.0% (w/v) | Alternative blocking agent, useful in specific applications like histidine-tagged protein detection. | Gelatin must be dissolved in warm buffer. |
| Chelators (e.g., EDTA) | 1 - 10 mM | Binds metal ions, inhibiting metalloproteases that may degrade samples. | May interfere with metal-dependent enzymes (e.g., AP). |
Experimental Protocol: Systematic Buffer Optimization
This protocol outlines a matrix-based approach to simultaneously optimize pH and additive composition for a sandwich ELISA.
Objective: To determine the optimal assay/diluent buffer composition for maximum signal-to-noise ratio (SNR).
Materials: See "The Scientist's Toolkit" below.
Method:
- Prepare Coating: Coat plate with capture antibody in standard carbonate buffer (pH 9.6) overnight at 4°C. Wash 3x with PBS-0.05% Tween 20 (PBST).
- Blocking: Block with a standard blocking buffer (e.g., 1% BSA in PBS) for 2 hours at RT. Wash as in step 1.
- Prepare Buffer Matrix: Create a series of assay/diluent buffers varying two parameters:
- pH: Prepare 0.1M phosphate buffers at pH 6.0, 6.5, 7.0, 7.5, and 8.0.
- Additive Profile: For each pH, prepare buffers containing:
- Buffer + 0.1% BSA
- Buffer + 0.1% BSA + 0.05% Tween 20
- Buffer + 1.0% BSA
- Buffer + 1.0% BSA + 0.05% Tween 20
- Buffer + 0.5% Casein + 0.05% Tween 20
- Sample & Detection Incubation:
- Add a mid-range concentration of target antigen (from a standard curve) diluted in each buffer from the matrix to duplicate wells. Include negative control (zero analyte) wells for each buffer.
- Incubate, then wash.
- Add detection antibody (concentration fixed) diluted in the same corresponding buffer as the antigen step. Incubate and wash.
- Signal Detection: Add enzyme conjugate and substrate sequentially according to standard protocol. Terminate reaction and read absorbance.
- Data Analysis: For each buffer condition, calculate the Signal-to-Noise Ratio:
SNR = (Mean Absorbance of Sample) / (Mean Absorbance of Negative Control). The condition yielding the highest SNR is optimal.
Visualization of Optimization Logic and Workflow
Diagram 1: ELISA Buffer Optimization Decision Workflow
Diagram 2: How Buffer Parameters Influence ELISA Performance
The Scientist's Toolkit: Key Research Reagent Solutions
Table 3: Essential Materials for ELISA Buffer Optimization
| Reagent/Material | Function in Optimization | Example Supplier/Product |
|---|---|---|
| Polystyrene Microplates | Solid phase for protein adsorption; plate chemistry can affect binding. | Corning Costar, Nunc MaxiSorp, Greiner Bio-One. |
| Phosphate Buffered Saline (PBS) 10X Stock | Basis for isotonic washing and dilution buffers. | Thermo Fisher, Sigma-Aldrich. |
| Carbonate-Bicarbonate Buffer Capsules | For consistent, high-pH coating buffer preparation. | Sigma-Aldrich, Millipore. |
| Fatty-Acid-Free BSA | High-purity blocking agent to minimize background interference. | Jackson ImmunoResearch, New England Biolabs. |
| Tween 20 (Polysorbate 20) | Non-ionic detergent for wash and diluent buffers. | Sigma-Aldrich, Bio-Rad. |
| Casein (from Bovine Milk) | Alternative blocking protein for high-sensitivity assays. | Thermo Fisher Pierce. |
| Proclin 300 Preservative | Microbial preservative safe for HRP and AP systems. | Sigma-Aldrich. |
| Precision pH Meter & Buffers | Critical for accurate pH adjustment of buffer stocks. | Mettler Toledo, Beckman. |
| 96-Well Plate Spectrophotometer | For endpoint absorbance measurement of colorimetric signals. | BioTek Instruments, Molecular Devices. |
Common Pitfalls in Protocol Execution and How to Prevent Them
Within the context of broader ELISA research and step-by-step guide development, rigorous protocol execution is paramount. This technical guide details frequent operational failures and their prevention, ensuring data integrity in immunoassay-driven drug development.
Sample Preparation & Handling Pitfalls
Inaccurate sample preparation is a primary source of variability, compromising the entire assay.
Pitfall 1: Improper Sample Collection and Storage Degradation of analytes (e.g., cytokines, phospho-proteins) due to delayed processing or suboptimal storage conditions leads to falsely low values.
Prevention Protocol:
- Immediate Stabilization: For plasma, use appropriate anticoagulants (EDTA for most cytokines). For cell lysates, add protease and phosphatase inhibitors directly upon lysis.
- Flash-Freeze: Snap-freeze aliquots in liquid nitrogen or dry ice/ethanol slurry. Store at -80°C. Avoid repeated freeze-thaw cycles; aliquot singly.
- Validated Thawing: Thaw samples rapidly at 37°C in a water bath, then immediately place on ice.
Pitfall 2: Inaccurate Dilution Series Serial dilution errors are multiplicative, creating non-linear standard curves and invalidating quantification.
Prevention Protocol:
- Independent Dilutions: Prepare critical standard curve points from a stock independently rather than via serial dilution.
- Volume Verification: Use calibrated pipettes with tips appropriate for the viscosity of the diluent (e.g., matrix-matched buffer).
- Documentation: Log exact weights, volumes, and dilution factors for each sample.
Quantitative Impact of Sample Handling Errors: Table 1: Analyte Recovery Under Different Handling Conditions
| Analyte | Optimal Processing (Recovery %) | 2hr RT Delay (Recovery %) | 1 Freeze-Thaw Cycle (Recovery %) | 3 Freeze-Thaw Cycles (Recovery %) |
|---|---|---|---|---|
| TNF-α | 100% | 65% | 85% | 60% |
| IL-6 | 100% | 70% | 90% | 72% |
| pERK1/2 | 100% | 30% | 80% | 45% |
| VEGF | 100% | 95% | 95% | 88% |
Assay Procedure & Timing Pitfalls
Deviations from precise incubation and washing steps directly affect antigen-antibody binding kinetics.
Pitfall 3: Inconsistent Incubation Conditions Fluctuations in incubation time, temperature, or orbital shaking speed cause plate-to-plate variability.
Prevention Protocol:
- Temperature Uniformity: Use a calibrated, humidified incubator for 37°C steps. For room temperature (RT) steps, standardize to a specific, monitored temperature (e.g., 22°C).
- Timing Rigor: Use a multi-channel timer. Begin and end incubations per well, not per plate.
- Sealing: Use plate sealers to prevent evaporation during long incubations.
Pitfall 4: Inadequate Washing Residual unbound protein causes high background. Overly vigorous washing can elute bound analyte.
Prevention Detailed Methodology:
- Automated Washer Validation: Program washer to aspirate to a consistent residual volume (e.g., 5 µL). Perform a dye test to confirm uniformity across all wells.
- Manual Washing Technique: Decant buffer sharply, blot plate on clean lint-free towels. Add wash buffer with a consistent, non-turbulent stream.
- Soak Step: Include a 30-second soak in wash buffer between aspiration cycles to dissociate non-specific bonds.
Pitfall 5: Enzymatic Detection Errors Inconsistent substrate preparation, incubation, or stopping ruins the final signal.
Prevention Protocol:
- Substrate Equilibration: Bring TMB substrate to RT in the dark 20 minutes before use.
- Precise Stopping: For acid-stop (e.g., 1M H₂SO₄), use a multi-channel pipette to add stop solution in the same order and speed used for substrate addition.
- Read Time Window: Read absorbance (450nm for TMB) within 5-30 minutes of stopping.
Data Acquisition & Analysis Pitfalls
Improper curve fitting and outlier handling invalidate results.
Pitfall 6: Incorrect Standard Curve Model Forcing a linear fit onto a sigmoidal curve misrepresents the dynamic range.
Prevention Protocol:
- 4-Parameter Logistic (4PL) Fit: Use 4PL (or 5PL) regression as the default for immunoassay data:
y = d + (a - d) / (1 + (x/c)^b) - Weighting: Apply appropriate weighting (e.g., 1/Y²) to account for heteroscedasticity (greater variance at high signals).
- QC Parameters: Reject curves where the top asymptote (a), bottom asymptote (d), or EC50 (c) fall outside validated ranges.
Pitfall 7: Ignoring Hook Effect At extremely high analyte concentrations, saturation of both capture and detection antibodies can cause a false-low signal, observed as a downturn at the high end of the standard curve.
Prevention Methodology: Always run samples at multiple dilutions. A lack of parallelism between dilutions indicates matrix interference or a potential hook effect.
Diagram 1: ELISA Hook Effect Mechanism (Max 760px)
The Scientist's Toolkit: Research Reagent Solutions
Table 2: Essential Reagents for Robust ELISA Execution
| Reagent / Material | Function & Criticality | Selection & Handling Tip |
|---|---|---|
| Matched Antibody Pair | Capture & detection antibodies targeting non-overlapping epitopes. Critical for specificity. | Validate pair for absence of cross-reactivity. Aliquot to avoid freeze-thaw. |
| Matrix-Matched Diluent | Sample/standard diluent mimicking the sample matrix (e.g., serum, cell culture media). Reduces background. | Must contain blockers (BSA, casein) and non-interfering proteins to normalize recovery. |
| High-Binding Plates | Polystyrene plates with optimized surface charge for passive antibody adsorption. | Use plates from the same lot for a study. Validate binding capacity. |
| Precision Calibrators | Lyophilized or stabilized analyte of known concentration for standard curve generation. | Traceable to an international standard. Reconstitute with exact volume; do not vortex proteins. |
| HRP or AP Conjugate | Enzyme linked to detection antibody for signal generation. | Check activity with chromogen before use. Store in glycerol at -20°C. |
| Stable Chromogenic Substrate | TMB (HRP) or pNPP (AP) formulations yielding soluble, colored product. | Use a single lot per study. Protect from light. Stop reaction at consistent endpoint. |
| Validated Wash Buffer | Typically PBS or Tris with a mild detergent (e.g., 0.05% Tween-20). | Check pH (7.2-7.4). Filter to prevent particulate nozzle clogs in automated washers. |
| Plate Sealer & Sealing Tape | Prevents evaporation and contamination during incubations. | Use optically clear seals for in-plate kinetic reads. Ensure adhesive compatibility with plate polymer. |
Comprehensive Experimental Workflow & Validation
A robust ELISA protocol integrates prevention strategies at every step.
Diagram 2: Robust ELISA Workflow with Integrated Pitfall Prevention (Max 760px)
Validation Methodology: To prevent pitfalls, each assay requires formal validation:
- Precision: Run intra-assay (n=20) and inter-assay (n=5 over 5 days) replicates at Low, Mid, High QC concentrations. CV must be <15% (20% at LLOQ).
- Accuracy/Recovery: Spike known analyte into matrix at 3 levels. Calculate % Recovery (80-120% acceptable).
- Linearity of Dilution: Serially dilute a high-concentration sample in matrix. Demonstrate parallelism to the standard curve.
- Limit of Detection (LOD): Mean signal of zero standard + 3(SD of zero standard replicates).
- Specificity: Test cross-reactivity with structurally similar molecules at high concentration.
ELISA Validation and Comparison with Modern Immunoassay Platforms
Within the comprehensive framework of a step-by-step ELISA research guide, the rigorous validation of the assay is paramount. Validation ensures the reliability, accuracy, and reproducibility of data, which is critical for research conclusions, diagnostic applications, and drug development. This technical guide delves into three core validation parameters: Specificity, Sensitivity (encompassing Limit of Detection and Limit of Quantification), and Precision. These parameters form the bedrock of any robust ELISA protocol, confirming that the assay measures the intended analyte correctly, at the required concentrations, and with consistent results.
Specificity
Specificity defines the ability of an assay to measure solely the analyte of interest in the presence of other potentially cross-reactive components in the sample matrix. In ELISA, this is primarily determined by the antibody pair used.
Experimental Protocol for Specificity Assessment
Method: Prepare samples containing the target analyte at a mid-range concentration (e.g., near the EC50 of the standard curve). In parallel, prepare samples spiked with structurally similar molecules, potential metabolic derivatives, or other related proteins at concentrations significantly higher (e.g., 10-100x) than the target. Also, test the sample matrix alone (blank). Run all samples in replicates (n≥3) on the same ELISA plate. Analysis: Calculate the mean signal for the target analyte and each potential interferent. Specificity is demonstrated if the signal from interferent samples is not statistically significantly different from the blank/matrix signal. Cross-reactivity (%) is calculated as: (Mean signal of interferent / Mean signal of target analyte) * 100.
Table 1: Example Specificity/Cross-Reactivity Data
| Potential Interferent | Concentration Tested | Mean OD (450nm) | Signal vs. Blank | % Cross-Reactivity |
|---|---|---|---|---|
| Target Analyte A | 50 ng/mL | 1.850 | N/A | 100.0 |
| Related Protein B | 500 ng/mL | 0.055 | Negligible | 0.3 |
| Related Protein C | 500 ng/mL | 0.210 | Detectable | 2.3 |
| Sample Matrix (Blank) | N/A | 0.045 | N/A | 0.0 |
Diagram Title: ELISA Specificity Testing Workflow
Sensitivity: LoD and LoQ
Sensitivity characterizes the lowest amount of analyte that can be reliably detected (LoD) or quantified (LoQ). It is a critical parameter for assays measuring low-abundance biomarkers.
Experimental Protocol for LoD and LoQ Determination
Method (Based on CLSI EP17-A2): A minimum of 20 replicates of the zero calibrator (sample matrix without analyte) and 20 replicates of a low-concentration sample (near the expected LoD) are analyzed over multiple runs/days. The data is used to model the distribution of the blank response.
Analysis:
- Limit of Blank (LoB): LoB = μblank + 1.645*σblank (for 95% confidence, assuming normal distribution).
- Limit of Detection (LoD): LoD = LoB + 1.645*σ_low concentration sample. LoD is the lowest concentration that can be distinguished from zero with 95% confidence.
- Limit of Quantification (LoQ): Defined as the lowest concentration where the assay meets predefined precision (e.g., CV ≤ 20%) and accuracy (e.g., 80-120% recovery) criteria. It is determined empirically by testing multiple low-concentration samples in replicates and evaluating their CV and mean recovery.
Table 2: Example LoD/LoQ Calculation Data
| Parameter | Value (OD) | Calculation |
|---|---|---|
| Mean Blank Signal (μb) | 0.042 | Measured from 24 replicates |
| SD Blank (σb) | 0.005 | Measured from 24 replicates |
| LoB | 0.050 | μb + 1.645σb = 0.042 + (1.6450.005) |
| SD Low Conc. Sample | 0.008 | Measured from 24 replicates of a 0.5 ng/mL spike |
| LoD | 0.063 | LoB + 1.645σ_low = 0.050 + (1.6450.008) |
| LoQ (Empirical) | 1.0 ng/mL | Lowest conc. with CV=18% & Recovery=92% |
Diagram Title: Relationship Between LoB, LoD, and LoQ
Precision
Precision describes the closeness of agreement between independent measurement results obtained under stipulated conditions. It is expressed as repeatability (intra-assay) and intermediate precision (inter-assay) and reported as standard deviation (SD) and coefficient of variation (%CV).
Experimental Protocol for Precision Testing
Method: Prepare quality control (QC) samples at three concentrations spanning the assay range: Low (near LoQ), Medium (mid-curve), and High (upper curve). For repeatability, analyze each QC level in a minimum of 6-10 replicates within a single run/plate. For intermediate precision, analyze each QC level in duplicate or triplicate across at least 3 separate runs conducted on different days, by different analysts, or with different reagent lots if possible.
Analysis: Calculate the mean, SD, and %CV ([SD/Mean] x 100) for each QC level for both conditions.
Table 3: Example Precision Data Summary
| QC Level | Nominal Conc. (ng/mL) | Intra-Assay (n=10) | Inter-Assay (3 days, n=6) | ||||
|---|---|---|---|---|---|---|---|
| Mean | SD | %CV | Mean | SD | %CV | ||
| Low | 2.5 | 2.3 | 0.25 | 10.9 | 2.4 | 0.31 | 12.9 |
| Medium | 25.0 | 24.7 | 1.85 | 7.5 | 25.2 | 2.10 | 8.3 |
| High | 80.0 | 78.5 | 4.40 | 5.6 | 79.8 | 5.18 | 6.5 |
Diagram Title: Intra-Assay vs. Intermediate Precision
The Scientist's Toolkit: Key Reagent Solutions for ELISA Validation
| Reagent / Material | Function in Validation |
|---|---|
| Reference Standard | Highly purified, well-characterized analyte used to construct the calibration curve. Its accuracy is fundamental for LoD, LoQ, and precision calculations. |
| Matrix-matched Calibrators & QCs | Calibrators and QC samples prepared in the same biological matrix (e.g., serum, plasma) as unknown samples. Critical for accurate recovery and specificity assessments by controlling for matrix effects. |
| Cross-Reactivity Panel | A set of purified proteins or compounds structurally similar to the target analyte. Used to definitively evaluate assay specificity. |
| High-Precision Micropipettes & Calibrated Tips | Essential for accurate and reproducible low-volume liquid handling, especially when preparing serial dilutions for LoD/LoQ and precision studies. |
| Validated Coated ELISA Plates | Plates pre-coated with capture antibody. Lot-to-lot consistency is vital for robust intermediate precision. |
| Signal Generation Reagents (HRP/ALP Substrates) | Enzymatic substrates (e.g., TMB for HRP) that produce a measurable colorimetric, chemiluminescent, or fluorescent signal. Stability and consistency are key for precision. |
| Plate Reader with Validated Performance | Spectrophotometer or luminometer with demonstrated precision and linear dynamic range. Regular calibration ensures accurate optical density (OD) readings. |
Within a comprehensive thesis detailing a step-by-step guide to ELISA research, the validation of method accuracy is paramount. This chapter focuses on two rigorous approaches: recovery experiments and comparison to a gold standard method. These procedures are fundamental for researchers, scientists, and drug development professionals to demonstrate that an ELISA assay reliably measures the true concentration of an analyte in a complex biological matrix, such as serum or cell lysate.
Conceptual Framework
Accuracy is defined as the closeness of agreement between a measured value and its accepted reference or true value. In ELISA development and validation, it is assessed through:
- Recovery Experiments: Evaluating how much of a known, spiked amount of analyte can be quantitatively recovered from the sample matrix.
- Comparison to a Gold Standard: Measuring the correlation and agreement between the new ELISA method and an established, reference method of known accuracy.
Recovery Experiments: Detailed Methodology
A recovery experiment determines the proportionality of measurement by spiking a known quantity of pure analyte into the sample matrix.
Protocol
- Prepare Matrix Pools: Obtain the target matrix (e.g., human serum) from at least six different sources, confirmed to be devoid of the target analyte (blank matrix). Pool them to create a representative matrix pool.
- Prepare Spiking Solutions: Create a concentrated stock solution of the pure analyte with known, high accuracy (e.g., recombinant protein standard). Prepare serial dilutions in a buffer compatible with the matrix.
- Spike Samples:
- Low Spike: Add a volume of spiking solution to achieve a concentration near the lower limit of quantification (LLOQ).
- Medium Spike: Add to achieve a concentration near the midpoint of the calibration curve.
- High Spike: Add to achieve a concentration near the upper limit of quantification (ULOQ).
- Perform each spike level in triplicate.
- Prepare Control Samples:
- Unspiked Matrix: Matrix pool with an equal volume of dilution buffer (no analyte).
- Spike in Diluent: The same amount of analyte spiked directly into assay buffer/diluent instead of matrix.
- Analysis: Run all spiked samples, unspiked matrix, and diluent spikes in the same ELISA batch alongside a standard calibration curve.
- Calculation:
- Measured Concentration = Concentration from ELISA curve.
- Expected Concentration = (Amount Spiked) / (Total Volume).
- % Recovery = (Measured Concentration in Spiked Matrix / Expected Concentration) * 100.
- % Recovery (Corrected) = [(Measured Spiked Matrix – Measured Unspiked Matrix) / Expected Concentration] * 100.
Data Presentation & Acceptance
Recovery results are typically summarized as follows:
Table 1: Example Recovery Experiment Data for a Cytokine ELISA in Human Serum
| Spike Level (pg/mL) | Mean % Recovery (Corrected) | Standard Deviation (SD) | % Coefficient of Variation (%CV) | n |
|---|---|---|---|---|
| 25 (Low) | 98.5 | 5.2 | 5.3 | 6 |
| 200 (Mid) | 102.3 | 4.1 | 4.0 | 6 |
| 800 (High) | 96.8 | 3.8 | 3.9 | 6 |
| Overall Mean | 99.2 | 4.4 | 4.4 | 18 |
Acceptance Criteria: Recoveries between 80-120% (often tightened to 85-115% for ligand-binding assays) with a %CV <20% (or <15%) are generally considered acceptable, depending on the assay context and regulatory guidelines.
Comparison to a Gold Standard: Detailed Methodology
This experiment establishes the relative accuracy of the new ELISA by comparing it to an existing reference method (e.g., LC-MS/MS, a commercial ELISA of proven performance, or a bioassay).
Protocol
- Sample Selection: Select a minimum of 40-60 individual patient or study samples that span the entire measurable range of the assay (from LLOQ to ULOQ). The samples should be representative of the intended-use population.
- Sample Analysis: Analyze each sample using both the Test Method (the new ELISA) and the Reference Method (Gold Standard) in a blinded manner. The analysis order should be randomized.
- Replication: Ideally, each sample should be tested in duplicate by both methods.
- Data Analysis: Use statistical methods to assess correlation and agreement (see below).
Statistical Analysis & Data Presentation
Table 2: Key Statistical Metrics for Method Comparison
| Metric | Formula/Purpose | Interpretation |
|---|---|---|
| Linear Regression | y = mx + c (Test Method = m*(Ref Method) + c) | Slope (m): Close to 1 indicates proportional agreement. Intercept (c): Close to 0 indicates no constant bias. |
| Correlation Coefficient (r or R²) | Measures strength of linear relationship. | R² > 0.95 suggests strong correlation. |
| Bland-Altman Analysis | Plot difference vs. average of two methods. Calculate mean difference (bias) and 95% limits of agreement (LoA). | Assesses systematic bias and agreement across concentrations. |
Table 3: Example Comparison Data: New ELISA vs. LC-MS/MS
| Sample ID | Reference Method (LC-MS/MS) [ng/mL] | Test Method (ELISA) [ng/mL] | Difference (ELISA - LCMS) [ng/mL] |
|---|---|---|---|
| PT-01 | 1.2 | 1.4 | +0.2 |
| PT-02 | 15.8 | 16.5 | +0.7 |
| ... | ... | ... | ... |
| PT-40 | 89.5 | 85.2 | -4.3 |
| Statistical Summary | |||
| Regression Slope | 0.97 | ||
| Regression Intercept | 0.45 ng/mL | ||
| R² | 0.987 | ||
| Mean Bias (Bland-Altman) | +0.32 ng/mL | ||
| 95% LoA | -3.1 to +3.7 ng/mL |
Experimental Workflow & Pathway Visualization
Title: Accuracy Validation: Recovery vs. Gold Standard Workflow
The Scientist's Toolkit: Essential Research Reagents & Materials
Table 4: Key Reagents for Accuracy Validation Experiments
| Item | Function in Experiment | Critical Specifications |
|---|---|---|
| Analyte of Interest (Pure Standard) | Used for spiking in recovery experiments and as a calibrator. Serves as the reference material. | High purity (>95%), verified concentration (by A280, amino acid analysis, etc.), stability in solution. |
| Blank/Depleted Matrix | The biological sample (serum, plasma, tissue homogenate) without the endogenous target analyte. Essential for recovery experiments. | Must be confirmed as "blank" via a sensitive method. Pooled from multiple donors for representativeness. |
| Reference Method Kit/Reagents (Gold Standard) | The established assay (e.g., commercial ELISA kit, LC-MS/MS reagents) used for method comparison. | Validated performance per its instructions for use (IFU). Must be appropriate for the same sample matrix. |
| ELISA Kit or Components | The test method undergoing validation. Includes capture/detection antibodies, coated plates, conjugates, and buffers. | High specificity and affinity antibodies. Lot-to-lot consistency is crucial. |
| Precision Pipettes & Calibrated Volumetric Equipment | For accurate and precise liquid handling during spiking, sample/reagent transfer, and serial dilution. | Regular calibration and maintenance. Use appropriate size pipette for the volume (e.g., 10-100 µL for spiking). |
| Data Analysis Software | For performing regression analysis, Bland-Altman plots, and statistical calculations (mean, SD, %CV). | Examples: GraphPad Prism, R, SPSS, or specialized method validation software. |
Determining Assay Range, Linearity, and Robustness
Within a comprehensive thesis on ELISA step-by-step guide research, rigorous characterization of the analytical method is paramount. This technical guide details the core concepts and procedures for determining the assay range, linearity, and robustness of an Enzyme-Linked Immunosorbent Assay (ELISA). These validation parameters ensure the assay generates reliable, accurate, and precise data across its intended use, forming the foundation for credible research and drug development.
Key Validation Parameters: Definitions and Significance
Assay Range: The interval between the upper and lower concentrations of analyte that can be quantified with acceptable accuracy, precision, and linearity. Linearity: The ability of the assay to elicit results that are directly proportional to the analyte concentration within the defined range. Robustness: A measure of the assay's capacity to remain unaffected by small, deliberate variations in method parameters, indicating its reliability during routine use.
Experimental Protocols
Determining Assay Range and Linearity
Objective: To establish the lower limit of quantification (LLOQ) and upper limit of quantification (ULOQ) and confirm linearity within this range.
Materials: See "The Scientist's Toolkit" section. Protocol:
- Prepare a high-concentration stock of the target analyte in the appropriate matrix (e.g., sample diluent, serum).
- Generate a minimum of 8 serial dilutions spanning the expected range (from below the anticipated LLOQ to above the ULOQ). Include replicates (n≥3).
- Run the dilution series alongside calibrators and controls in the same ELISA plate, following the standard protocol.
- Plot the mean measured signal (e.g., OD450nm) against the nominal analyte concentration.
- Perform linear regression analysis. Calculate the coefficient of determination (R²) and the residual plot.
- The LLOQ is the lowest concentration with accuracy (80-120%) and precision (CV ≤20%). The ULOQ is the highest concentration meeting the same criteria. The assay range is LLOQ-ULOQ.
Assessing Robustness
Objective: To evaluate the impact of deliberate, minor procedural variations on assay performance.
Protocol (Factorial Design Approach):
- Identify Critical Parameters: Select key steps prone to variation (e.g., incubation times, temperatures, reagent incubation periods, washing steps).
- Define Variations: For each parameter, set a nominal (standard) value and two minor variations (e.g., ±5°C for incubation temperature, ±10% for incubation time).
- Experimental Design: Use a fractional factorial design to test combinations of these variations efficiently. Run the assay with these variations using a mid-range control sample in replicates.
- Analysis: Compare the accuracy, precision, and mean signal of the control sample across all variations to the nominal condition. A robust assay shows no statistically significant or clinically relevant deviation.
Data Presentation
Table 1: Assay Range and Linearity Data
| Nominal Conc. (pg/mL) | Mean OD (n=3) | SD | CV% | Accuracy (%) |
|---|---|---|---|---|
| 3.9 (LLOQ) | 0.105 | 0.008 | 7.6 | 85 |
| 7.8 | 0.210 | 0.012 | 5.7 | 98 |
| 15.6 | 0.405 | 0.018 | 4.4 | 102 |
| 31.3 | 0.815 | 0.031 | 3.8 | 101 |
| 62.5 | 1.560 | 0.055 | 3.5 | 99 |
| 125 | 2.950 | 0.110 | 3.7 | 103 |
| 250 | 5.200 | 0.210 | 4.0 | 97 |
| 500 (ULOQ) | 8.900 | 0.450 | 5.1 | 105 |
| 1000 | 12.300 | 1.100 | 8.9 | 78 |
Regression Analysis: y = 0.0176x + 0.045, R² = 0.998
Table 2: Robustness Testing Results
| Varied Parameter | Condition | Mean Recovery (%) | CV% |
|---|---|---|---|
| Coating Incubation Temp | 35°C (-5°C) | 97 | 5.2 |
| 40°C (Nominal) | 100 | 4.8 | |
| 45°C (+5°C) | 102 | 6.1 | |
| Sample Incubation Time | 54 min (-10%) | 98 | 5.8 |
| 60 min (Nominal) | 100 | 4.9 | |
| 66 min (+10%) | 101 | 5.5 | |
| Detection Ab Time | 18 min (-10%) | 94 | 6.5 |
| 20 min (Nominal) | 100 | 5.1 | |
| 22 min (+10%) | 103 | 5.9 |
Visualizations
Title: ELISA Range & Linearity Determination Workflow
Title: Robustness Evaluation Decision Tree
The Scientist's Toolkit
| Research Reagent / Material | Function in Validation |
|---|---|
| High-Purity Reference Standard | The definitive analyte sample used to prepare accurate calibration curves and spiked samples for linearity/recovery studies. |
| Matrix-Matched Diluent | Diluent that mimics the sample matrix (e.g., serum, plasma, cell lysate buffer) to account for matrix effects on the assay. |
| Pre-Coated ELISA Plates | Plates with immobilized capture antibody, ensuring consistency for inter-assay precision studies during robustness testing. |
| High-Sensitivity Detection System | Includes biotinylated detection antibodies, streptavidin-HRP/TMB substrate, or other chemiluminescent systems for wide dynamic range. |
| Precision Microplate Washer | Critical for consistent washing stringency, a key parameter in robustness testing. |
| Calibrated Multichannel Pipettes | Ensure accurate and precise liquid handling for serial dilution preparation and reagent addition. |
| Validated Plate Reader | Spectrophotometer or luminometer with stable calibration for consistent optical density (OD) measurements across validation runs. |
| Statistical Analysis Software | For performing linear regression, ANOVA, and other statistical analyses of accuracy, precision, and robustness data. |
Within the broader thesis of a step-by-step ELISA research guide, the interpretation of data stands as the critical juncture where experimental execution meets scientific conclusion. ELISA (Enzyme-Linked Immunosorbent Assay) is a cornerstone technique in biomedical research, diagnostics, and drug development for quantifying peptides, proteins, antibodies, and hormones. However, its reliability is entirely dependent on the rigorous implementation and interpretation of controls, alongside a robust statistical analysis of the raw data. This guide provides an in-depth technical framework for evaluating ELISA results, ensuring that conclusions drawn are valid, reproducible, and scientifically defensible.
Foundational Principles: Assay Types and Signal Generation
Accurate interpretation begins with understanding the specific assay format employed. The core principle involves the specific binding of an antigen by an antibody, with the detection achieved via an enzyme-labeled conjugate that produces a measurable colorimetric, chemiluminescent, or fluorescent signal proportional to the analyte concentration.
Key ELISA Formats:
- Direct ELISA: Primary antibody is directly conjugated to the enzyme. Simple but less sensitive.
- Indirect ELISA: A labeled secondary antibody binds to the primary antibody, offering signal amplification.
- Sandwich ELISA: Requires two antibodies (capture and detection) specific to different epitopes of the target analyte. Offers high specificity and sensitivity, and is the most common format for complex samples.
- Competitive/Inhibition ELISA: Used for small antigens. The sample analyte competes with a labeled reference analyte for a limited number of antibody binding sites. Signal is inversely proportional to analyte concentration.
The Imperative of Controls: Validation and Troubleshooting
Controls are non-negotiable elements that validate the assay's performance. Their results must be scrutinized before any sample data can be trusted.
Table 1: Essential ELISA Controls and Their Interpretation
| Control Type | Purpose & Preparation | Expected Result | Interpretation of Deviation |
|---|---|---|---|
| Blank | Well with only substrate (and stop solution). No antibodies or sample. | Very low absorbance (near zero). | High blank indicates substrate contamination, dirty plates, or reader malfunction. |
| Standard Curve | Serial dilutions of a known concentration of the target analyte. | Logistic (4- or 5-parameter) or linear sigmoidal curve with high R² value (e.g., >0.99). | Poor fit indicates issues with dilution technique, degraded standards, or improper assay conditions. |
| Positive Control | A sample with a known, medium-high concentration of the analyte. | Concentration falls within the expected range on the standard curve. | Out-of-range recovery indicates assay drift, reagent failure, or operator error. |
| Negative Control | A sample matrix known to be devoid of the target analyte (e.g., buffer, placebo). | Concentration below the assay's lower limit of detection (LLOD). | High signal suggests non-specific binding or cross-reactivity in the assay. |
| Background/Matrix Control | Sample matrix (e.g., serum, cell lysate) spiked with zero analyte. | Signal similar to negative control. | Elevated signal indicates matrix interference, requiring sample dilution or purification. |
| Intra-assay Precision | Multiple replicates (n≥3) of the same sample on the same plate. | Low coefficient of variation (CV) (typically <10%). | High CV highlights pipetting errors or inconsistent washing. |
| Inter-assay Precision | Same sample run across multiple plates/days. | CV across runs should be <15%. | High CV indicates poor reproducibility due to reagent lot changes, calibration drift, or protocol variability. |
Protocol: Establishing a Standard Curve
- Reconstitute the provided standard protein lyophilizate precisely as per the kit datasheet.
- Perform a serial dilution (e.g., two-fold or five-fold) in the recommended dilution buffer to create 6-8 concentration points, covering the entire dynamic range of the assay. Include a zero standard.
- Run these dilutions in duplicate or triplicate alongside samples.
- Plot the mean absorbance (y-axis) against the known concentration (x-axis).
- Fit the data using the curve-fitting algorithm specified by the manufacturer (most often a 4- or 5-parameter logistic model). Do not force a linear fit.
Data Processing and Quantitative Analysis
Raw absorbance values must be transformed into interpretable concentrations.
Step-by-Step Analysis Protocol:
- Correct for Background: Subtract the mean absorbance of the blank wells from all other absorbance readings.
- Average Replicates: Calculate the mean background-corrected absorbance for each standard and sample.
- Generate the Curve: Using statistical software, fit the standard curve data with the appropriate model.
- Interpolate Unknowns: Use the generated curve equation to calculate the concentration of each unknown sample from its mean absorbance.
- Apply Dilution Factors: Multiply the interpolated concentration by any dilution factor applied to the original sample.
- Assess Quality: The standard curve's R² or sum of squared residuals should meet pre-defined acceptance criteria (e.g., R² ≥ 0.98).
Table 2: Key Quantitative Parameters in ELISA Validation
| Parameter | Formula/Description | Acceptability Criteria |
|---|---|---|
| Lower Limit of Detection (LLOD) | Meanblank + 3*(SDblank) | The smallest concentration distinguishable from zero. |
| Lower Limit of Quantification (LLOQ) | Lowest standard with CV <20% and recovery of 80-120%. | The lowest concentration quantifiable with acceptable precision and accuracy. |
| Upper Limit of Quantification (ULOQ) | Highest standard with CV <20% and recovery of 80-120%. | The highest concentration quantifiable within the linear range. |
| Dynamic Range | LLOQ to ULOQ. | The span of concentrations that can be reliably measured. |
| % Recovery (Accuracy) | (Observed Concentration / Expected Concentration) * 100 | Typically 80-120% for spike-recovery experiments. |
| Coefficient of Variation (Precision) | (Standard Deviation / Mean) * 100 | Intra-assay: <10%. Inter-assay: <15%. |
Advanced Interpretation: Pitfalls and Artifact Recognition
- Hook Effect (Prozone Effect): In sandwich ELISAs, extremely high analyte concentrations can saturate both capture and detection antibodies, preventing the formation of the "sandwich" and leading to a falsely low signal. Solution: Always test samples at multiple dilutions.
- Matrix Effects: Components in sample (e.g., lipids, heterophilic antibodies, complement) can interfere. Solution: Dilute samples, use matrix-matched standards, or employ sample purification.
- Edge Effects: Wells on the periphery of the plate exhibit different evaporation rates, causing uneven results. Solution: Use a plate seal during incubations, and consider excluding outer wells or using them only for controls.
- Cross-Reactivity: Detection antibodies binding to similar epitopes on non-target molecules. Evaluated during assay validation.
Title: Step-by-Step Sandwich ELISA Workflow Diagram
Title: ELISA Data Processing and QC Decision Logic
The Scientist's Toolkit: Essential Research Reagent Solutions
Table 3: Key Reagents and Materials for ELISA
| Item | Function & Critical Notes |
|---|---|
| High-Binding Plates (e.g., Polystyrene) | Optimized surface chemistry for passive adsorption of capture antibodies or antigens. |
| Capture & Detection Antibodies | Must be validated as a matched pair (for sandwich ELISA) with high specificity and affinity. Different epitopes are required. |
| Recombinant Protein Standards | Quantified, pure analyte for generating the standard curve. Lyophilized standards require precise reconstitution. |
| Blocking Buffer (e.g., BSA, Casein) | Saturates unused binding sites on the plate to minimize non-specific background signal. |
| Sample Dilution Buffer | Often contains blockers and salts to mimic the standard curve matrix and reduce interference. |
| Enzyme Conjugate (HRP or AP) | Horseradish Peroxidase (HRP) or Alkaline Phosphatase (AP) linked to detection antibody or streptavidin. Defines assay sensitivity. |
| Chromogenic Substrate (TMB, OPD, pNPP) | Produces a color change upon enzymatic action. TMB (for HRP) is most common, yielding a blue product that turns yellow when stopped. |
| Stop Solution (e.g., Sulfuric Acid) | Halts the enzymatic reaction abruptly, stabilizing the final signal for reading. |
| Plate Washer/Buffer | Critical for removing unbound material. Inconsistent washing is a major source of error. Wash buffers often contain mild detergents (e.g., Tween-20). |
| Microplate Reader | Spectrophotometer capable of reading absorbance at the appropriate wavelength (e.g., 450nm for TMB, 405nm for pNPP). |
Interpreting ELISA data extends far beyond simply reading concentrations from a software output. It is a critical exercise that demands a systematic evaluation of controls, an understanding of the assay's limitations, and a rigorous approach to statistical analysis. By adhering to the principles and protocols outlined in this guide—embedded within the comprehensive framework of ELISA research—scientists and drug developers can ensure their data is robust, their conclusions are valid, and their research maintains the highest standards of reliability.
Within the broader context of developing a comprehensive ELISA Step-by-Step Guide, understanding the comparative landscape of protein detection techniques is essential for experimental design. ELISA (Enzyme-Linked Immunosorbent Assay) and Western Blot (Immunoblot) are cornerstone methodologies. This technical guide provides an in-depth comparison, focusing on principles, quantitative capabilities, protocols, and applications to inform researchers, scientists, and drug development professionals.
Fundamental Principles & Applications
ELISA is a plate-based, high-throughput technique for detecting and quantifying soluble proteins (e.g., cytokines, hormones, antibodies) in complex mixtures. It relies on antigen immobilization and enzyme-conjugated antibody detection, producing a colorimetric or fluorometric signal proportional to target concentration. Its primary strength lies in quantitative analysis.
Western Blot is a semi-quantitative technique that separates proteins by molecular weight via gel electrophoresis before transferring them to a membrane and detecting them with specific antibodies. It provides critical information on protein size, post-translational modifications, and specificity confirmation, making it indispensable for validating protein identity.
Quantitative Data Comparison
Table 1: Core Characteristics of ELISA vs. Western Blot
| Feature | ELISA | Western Blot |
|---|---|---|
| Primary Purpose | Quantitative detection & high-throughput screening | Qualitative/Semi-quantitative detection & specificity validation |
| Throughput | Very High (96-384 well plates) | Low to Medium (1-12 samples per gel) |
| Sensitivity | High (pg/mL range) | Moderate to High (low ng range) |
| Dynamic Range | ~2-3 log units | ~1.5-2 log units |
| Information Gained | Concentration only | Molecular weight, protein isoforms, modification states |
| Time to Result | 2-6 hours | 1-2 days |
| Key Advantage | Excellent for precise quantification of many samples | Confirms target identity via size and minimizes cross-reactivity artifacts |
| Key Limitation | Potential for cross-reactivity; no size validation | Poorly quantitative, low throughput, technically demanding |
Table 2: Typical Performance Metrics for a Cytokine Target (e.g., IL-6)
| Parameter | Sandwich ELISA | Western Blot |
|---|---|---|
| Sample Volume | 50-100 µL | 10-50 µL (lysate) |
| Detection Limit | 1-5 pg/mL | 50-100 pg per lane |
| Assay Time | ~4 hours | ~24 hours (including overnight transfer/blocking) |
| Multiplexing | Possible with electrochemiluminescence or fluorescent arrays | Limited (sequential probing or fluorescent multiplex with 2-3 targets) |
| Data Output | Numerical concentration (from standard curve) | Band intensity (relative densitometry units) |
Detailed Experimental Protocols
Protocol A: Key Steps in a Sandwich ELISA
- Coating: Dilute capture antibody in carbonate/bicarbonate coating buffer (pH 9.6). Add 100 µL/well to a 96-well microplate. Incubate overnight at 4°C.
- Washing & Blocking: Aspirate wells. Wash 3x with PBS containing 0.05% Tween-20 (PBST). Add 200-300 µL of blocking buffer (e.g., 5% BSA or non-fat dry milk in PBS). Incubate 1-2 hours at room temperature (RT). Wash 3x.
- Sample & Standard Incubation: Prepare serial dilutions of the protein standard in sample diluent. Add standards and test samples (100 µL/well). Incubate 2 hours at RT or overnight at 4°C. Wash 3-5x.
- Detection Antibody Incubation: Add enzyme-conjugated detection antibody (100 µL/well) diluted in blocking buffer. Incubate 1-2 hours at RT. Wash 3-5x thoroughly.
- Substrate Development: Add enzyme substrate (e.g., TMB for HRP, 100 µL/well). Incubate in the dark for 5-30 minutes.
- Signal Measurement: Stop the reaction with stop solution (e.g., 2N H₂SO₄ for TMB). Read absorbance immediately at the appropriate wavelength (e.g., 450 nm).
Protocol B: Key Steps in Western Blotting
- Sample Preparation & SDS-PAGE: Lyse cells/tissue in RIPA buffer with protease inhibitors. Determine protein concentration (e.g., via BCA assay). Mix protein lysate with Laemmli buffer, denature at 95°C for 5 min. Load equal amounts (10-50 µg) per lane on a polyacrylamide gel. Run electrophoresis at constant voltage until dye front reaches bottom.
- Membrane Transfer: Assemble "sandwich" in transfer cassette: cathode, sponge, filter paper, gel, PVDF/nitrocellulose membrane, filter paper, sponge, anode. Transfer proteins via wet or semi-dry transfer method (e.g., 100V for 60-90 min on ice).
- Blocking & Antibody Probing: Block membrane in 5% non-fat milk in TBST for 1 hour at RT. Incubate with primary antibody diluted in blocking buffer or 5% BSA/TBST overnight at 4°C. Wash membrane 3x for 5-10 min with TBST. Incubate with HRP-conjugated secondary antibody for 1 hour at RT. Wash 3x for 5-10 min.
- Detection: Incubate membrane with chemiluminescent substrate. Image using a CCD camera-based imager to capture signal within the linear range.
The Scientist's Toolkit: Essential Research Reagent Solutions
Table 3: Key Reagents and Their Functions
| Reagent/Material | Primary Function in ELISA | Primary Function in Western Blot |
|---|---|---|
| Microplate | Solid phase for antibody coating and reaction incubation. | Not applicable. |
| PVDF/Nitrocellulose Membrane | Not typically used. | Solid support for immobilized proteins after transfer. |
| Capture & Detection Antibodies | Form the immunochemical "sandwich" for specific target capture and signal generation. | Primary Antibody: Specifically binds target protein. Secondary Antibody: Conjugated to enzyme, binds primary for detection. |
| Blocking Agent (BSA, Non-fat Milk) | Coats uncovered sites to prevent non-specific antibody binding. | Coats membrane to prevent non-specific antibody binding. |
| HRP or AP Conjugates | Enzymes linked to detection antibody for catalytic signal amplification. | Enzymes linked to secondary antibody for catalytic signal amplification. |
| Chemiluminescent Substrate | Used for high-sensitivity ELISA platforms. | Essential for detecting proteins on membrane via light emission. |
| Colorimetric Substrate (TMB, etc.) | Produces a colored product for absorbance measurement in standard ELISA. | Less common; used for colorimetric detection on membranes. |
| SDS-PAGE Gels | Not used. | Matrix for separating proteins by molecular weight. |
| Transfer Buffer | Not used. | Medium for electrophoretic protein transfer from gel to membrane. |
| Enhanced ECL Reagent | Optional for ultra-sensitive ELISA. | Standard for high-sensitivity protein detection on blots. |
Selection Criteria & Complementary Use
The choice between ELISA and Western Blot is driven by the research question.
- Choose ELISA for: Quantifying protein levels in large sample sets (serum, cell supernatants), kinetic studies, or screening assays where throughput and precision are paramount.
- Choose Western Blot for: Confirming the presence of a specific protein, assessing its molecular weight, detecting isoforms or cleavage products, and verifying antibody specificity (a critical step following ELISA development).
In a robust research pipeline, these techniques are complementary. A common strategy involves using ELISA for high-throughput quantification and employing Western Blot to validate key findings, ensuring that the detected signal corresponds to the protein of interest at the expected size. This integrated approach is fundamental to the thesis of rigorous, reproducible protein analysis.
In the continuum of immunoassay development detailed in our broader thesis on ELISA step-by-step guides, the evolution from singleplex to multiplex technologies represents a critical advancement. While ELISA remains the gold standard for measuring a single analyte per well, the demand for higher-throughput, sample-sparing, and multi-parametric analysis in biomarker discovery, drug development, and systems biology has driven the adoption of multiplex bead-based platforms. This guide delves into the core principles, comparative advantages, and methodologies of two leading technologies: Luminex xMAP and Meso Scale Discovery (MSD) electrochemiluminescence.
Core Technology Principles
Luminex xMAP (Multi-Analyte Profiling): This platform utilizes color-coded magnetic or polystyrene microspheres ("beads") internally dyed with varying ratios of two fluorophores. Each bead set, with a unique spectral signature, is coated with a capture antibody (or other biomolecule). After the assay, a dual-laser flow-based detector identifies the bead (and thus the analyte) by its fluorescent color and quantifies the bound analyte via a reporter fluorophore (e.g., PE or APC).
Meso Scale Discovery (MSD) Electrochemiluminescence: MSD employs carbon electrode-coated microplates as the solid phase. Capture antibodies are spotted onto individual electrodes within each well. Detection antibodies are labeled with a Sulfo-Tag, a ruthenium complex that emits light upon electrochemical stimulation. The application of an electric voltage to the plate electrodes induces emission, which is measured by a CCD camera. This spatial resolution allows for multiplexing within a well via patterned spot arrays.
Quantitative Comparison of Platforms
Table 1: Technical and Performance Comparison: ELISA, Luminex, and MSD.
| Parameter | Traditional ELISA | Luminex xMAP | Meso Scale Discovery (MSD) |
|---|---|---|---|
| Multiplex Capability | Singleplex | High-plex (up to 500 analytes) | Low- to Mid-plex (typically 1-10 per well) |
| Sample Volume Required | 50-100 µL | 25-50 µL | 25-50 µL |
| Dynamic Range | ~2 logs | 3-4 logs | 4-5 logs (often wider than ELISA & Luminex) |
| Assay Time | 4-8 hours (typical) | 2-4 hours (typical) | 2-3 hours (typical) |
| Detection Method | Colorimetric (Absorbance) | Fluorescence (Flow Cytometry) | Electrochemiluminescence (ECL) |
| Solid Phase | Polystyrene Well | Color-Coded Microsphere | Carbon Electrode Array |
| Throughput | Lower (1 analyte/well) | High (Many analytes/well) | High (Multiple analytes/well) |
| Sensitivity | Moderate | Good to Excellent (fg-pg/mL) | Excellent (often fg/mL) |
Detailed Experimental Protocols
Protocol 1: Generic Sandwich Immunoassay for Luminex xMAP Note: This is a representative protocol. Always optimize and follow manufacturer-specific guidelines.
- Bead Preparation: Vortex and sonicate coupled magnetic bead stocks. Prepare a working mixture of the desired bead regions in Assay Buffer.
- Plate Washing: Pre-wet a magnetic microplate separator. Add 100 µL of Wash Buffer to each well.
- Add Beads & Sample: Add 50 µL of the mixed beads to each well. Add 50 µL of standard, control, or sample per well. Seal and incubate for 1-2 hours on a plate shaker at room temperature (RT).
- Wash: Place plate on magnet for 1 minute, decant supernatant. Wash wells 2x with 100 µL Wash Buffer while on the magnet.
- Detection Antibody: Add 50 µL of biotinylated detection antibody cocktail. Seal, incubate 1 hour on shaker at RT.
- Wash: Repeat wash step 3x.
- Streptavidin-Phycoerythrin (SA-PE): Add 50 µL of SA-PE reporter. Seal, incubate for 30 minutes on shaker at RT, protected from light.
- Wash: Repeat wash step 3x.
- Resuspension & Reading: Add 100-150 µL of Reading Buffer. Shake for 5 minutes. Analyze on a Luminex analyzer (e.g., MAGPIX, Luminex 200).
Protocol 2: Generic Sandwich Immunoassay for MSD MULTI-ARRAY / U-PLEX Note: This is a representative protocol. Always optimize and follow manufacturer-specific guidelines.
- Plate Preparation: MSD plates are pre-coated. Block plates with 150 µL of MSD Blocker A for 30 minutes with shaking at RT.
- Wash: Wash plates 3x with 150 µL of MSD Wash Buffer (Tris-based with surfactant).
- Add Sample & Standards: Add 25-50 µL of standard, control, or sample per well. Add 25-50 µL of Diluent to bring total volume to ~50-100 µL/well. Seal, incubate for 1-2 hours with shaking at RT.
- Wash: Wash plates 3x with Wash Buffer.
- Detection Antibody: Add 50 µL of Sulfo-Tag-labeled detection antibody cocktail. Seal, incubate for 1 hour with shaking at RT, protected from light.
- Wash: Wash plates 3x with Wash Buffer.
- Read: Add 150 µL of MSD GOLD Read Buffer B (contains tripropylamine, the coreactant) to each well. Read immediately on an MSD imager (e.g., MESO QuickPlex SQ 120). The instrument applies a voltage to induce ECL.
Visualizing Workflows and Principles
Diagram Title: Luminex xMAP Assay Detection Workflow
Diagram Title: MSD Electrochemiluminescence Principle
The Scientist's Toolkit: Essential Research Reagent Solutions
Table 2: Key Reagents and Materials for Multiplex Bead-Based Assays.
| Item | Primary Function | Key Considerations |
|---|---|---|
| Luminex Magnetic Beads | Solid phase for analyte capture; spectral barcode identifies assay. | Choose validated panels or custom coupling kits. Ensure proper sonication/vortexing to prevent bead aggregation. |
| MSD MULTI-ARRAY / U-PLEX Plates | Solid phase with integrated electrodes for capture and ECL initiation. | Plates are often pre-coated. U-PLEX uses linker-capture systems for flexible panel building. |
| Assay / Diluent Buffer | Matrix for reconstituting standards and diluting samples. | Critical for minimizing matrix effects. MSD buffers are specifically formulated for ECL. |
| Wash Buffer | Removes unbound material between steps. | Typically a Tris- or PBS-based buffer with surfactant (e.g., Tween-20). |
| Detection Antibody Cocktail | Analyte-specific, labeled for detection. | Luminex: Biotinylated. MSD: Labeled with Sulfo-Tag (ruthenium chelate). |
| Reporter / Read Buffer | Final step generating detectable signal. | Luminex: Streptavidin conjugated to Phycoerythrin (SA-PE). MSD: Read Buffer containing tripropylamine coreactant. |
| Calibrators / Standards | Quantified analytes for generating the standard curve. | Use the matrix-matched standard set provided with kits. Serial dilution accuracy is paramount. |
| Quality Controls | Monitor inter-assay precision and accuracy. | Should span low, medium, and high concentrations of the dynamic range. |
| Plate Sealer | Prevents evaporation and contamination during incubations. | Use foil or clear adhesive seals compatible with shaking protocols. |
| Magnetic Plate Washer (Luminex) | Efficiently holds beads during wash steps. | Manual magnets or automated washers. Ensure even bead resuspension after washing. |
The enzyme-linked immunosorbent assay (ELISA) has been a cornerstone of quantitative protein analysis in biomedical research and diagnostic development. However, its sensitivity, typically in the low picogram-per-milliliter (pg/mL) range, is insufficient for measuring ultralow-abundance biomarkers like neuronal proteins, cytokines in serum, or early disease markers. This technical guide, framed as an extension of a comprehensive ELISA thesis, details two transformative, ultra-sensitive immunoassay platforms: Single Molecule Array (Simoa) and ELISA with Single Molecule Counting (ELISA-SCA). These technologies push detection limits into the femtomolar (fM) and attomolar (aM) range, enabling novel research and clinical applications.
Core Technology: Principles and Mechanisms
Simoa (Single Molecule Array)
Simoa, a digital ELISA technology, achieves ultra-sensitivity by isolating and detecting individual immunocomplexes. The core innovation is the use of femtoliter-sized wells that sequester single enzyme-labeled molecules, allowing for "digital" counting of individual binding events.
Workflow:
- Immunocomplex Formation: Similar to a sandwich ELISA, the analyte is captured on magnetic beads coated with a capture antibody and labeled with an enzyme-linked detection antibody.
- Confinement: The bead-bound immunocomplexes are resuspended in a substrate solution and loaded onto a disc containing an array of ~216,000 femtoliter wells. The wells are sized to hold only one bead each.
- Sealing and Incubation: The disc is sealed with oil, isolating each bead. If the bead carries an enzyme-labeled immunocomplex, the enzyme converts the substrate to a fluorescent product, which rapidly accumulates to a high concentration in the tiny well.
- Digital Imaging & Analysis: A high-resolution fluorescence microscope scans the array. Wells with fluorescence intensity above a threshold are scored as "on" (positive, containing an enzyme label). Those below are "off" (negative). The analyte concentration is determined from the ratio of positive beads to total beads (AEB - Average Enzymes per Bead).
Diagram 1: Simoa Digital ELISA Workflow
ELISA-SCA (Single Molecule Counting)
ELISA-SCA enhances a conventional microplate-based sandwich ELISA with a single molecule detection step. Instead of using a colorimetric or chemiluminescent readout, it employs a fluorescently labeled detection antibody. The final eluate is streamed through a laser-induced fluorescence detector in a flow cell, where individual immunocomplexes are counted as fluorescent bursts.
Workflow:
- Conventional ELISA Steps: Analyte is captured on a plate and probed with a biotinylated detection antibody, followed by streptavidin-enzyme conjugate.
- Elution: The enzyme substrate (often a fluorescent precipitating substrate) is added, generating a localized fluorescent precipitate on the detection antibody.
- Dissolution & Streamlining: The fluorescent product is dissolved and the entire eluate is injected into the SCA instrument.
- Single Molecule Counting: The sample is hydrodynamically focused into a microfluidic flow cell. A laser excites individual fluorescent molecules, which are counted via a photomultiplier tube as they pass. The count is directly proportional to the original analyte concentration.
Diagram 2: ELISA-SCA Workflow
Quantitative Performance Comparison
Table 1: Platform Comparison - Simoa vs. ELISA-SCA
| Parameter | Simoa (Digital ELISA) | ELISA-SCA (Single Molecule Counting) | Conventional ELISA |
|---|---|---|---|
| Detection Principle | Digital counting in femtoliter wells | Analog counting of molecules in flow | Bulk colorimetric/chemiluminescent signal |
| Typical Sensitivity Gain | 100–1000x over ELISA | 10–100x over ELISA | Baseline |
| Lower Limit of Detection (LLoD) | Low fg/mL to sub-fg/mL range (e.g., 0.01–0.1 pg/mL) | Mid fg/mL to pg/mL range (e.g., 0.1–1 pg/mL) | 1–10 pg/mL |
| Dynamic Range | 3–4 logs | 3–4 logs | 3–4 logs |
| Throughput | Medium (1–2 plates per run) | Low-Medium (plate-based, slower readout) | High |
| Sample Volume Required | Low (25–50 µL) | Moderate (50–100 µL) | 50–100 µL |
| Instrumentation | Dedicated, automated Simoa HD-X analyzer | Modified microplate reader + SCA flow detector | Standard microplate reader |
| Key Advantage | Highest sensitivity, fully automated digital readout | High sensitivity, leverages standard ELISA plate format | High-throughput, well-established, low cost |
Table 2: Example Biomarker Detection Limits (Representative Data)
| Biomarker | Simoa Reported LLoD | ELISA-SCA Reported LLoD | Conventional ELISA LLoD |
|---|---|---|---|
| IL-6 | 0.01 pg/mL | 0.1 pg/mL | 1–5 pg/mL |
| Tau (Neurology) | 0.02 pg/mL | 0.3 pg/mL | >10 pg/mL |
| cTnI (Cardiac) | 0.05 pg/mL | 0.5 pg/mL | 10–50 pg/mL |
Detailed Experimental Protocols
Protocol 1: Simoa Assay for Cytokine Detection (e.g., IL-6)
This protocol is adapted for the Quanterix Simoa HD-X analyzer.
I. Reagent Preparation:
- Sample Diluent: Use the manufacturer's recommended matrix (e.g., Simoa Sample Diluent).
- Standards: Prepare a dilution series of recombinant cytokine in sample diluent, covering the expected range (e.g., 0–2000 fM).
- Beads: Vortex streptavidin-coated paramagnetic beads thoroughly.
- Detection Antibody: Dilute biotinylated anti-cytokine detection antibody to working concentration.
- SBG Reagent: Dilute streptavidin-β-galactosidase (SBG) conjugate as specified.
- Substrate: Resuspend the fluorescent substrate (Resorufin β-D-galactopyranoside) in the provided buffer.
II. Assay Procedure:
- Capture: Mix 100 µL of sample/standard with 100 µL of bead suspension and capture antibody in a reaction cup. Seal and incubate with shaking (30 min, RT).
- Wash 1: Transfer the reaction cup to the instrument. The system performs an automated magnetic wash.
- Detection: The system adds the biotinylated detection antibody, incubates, and washes.
- Labeling: SBG conjugate is added, incubated, and washed.
- Array Loading & Read: The instrument resuspends beads in substrate, loads the array, seals, incubates, and images the array.
- Analysis: Software calculates the AEB for each sample and interpolates concentration from the standard curve.
Protocol 2: ELISA-SCA Assay Setup
This protocol outlines the plate-based steps prior to SCA instrument reading.
I. Microplate ELISA:
- Coating: Coat a high-binding 96-well plate with capture antibody (2–4 µg/mL in PBS). Incubate overnight at 4°C.
- Blocking: Aspirate and block with 300 µL of blocking buffer (e.g., PBS with 1% BSA) for 1–2 hours at RT.
- Sample/Analyte Incubation: Add samples and standards in duplicate (100 µL/well). Incubate 2 hours at RT with shaking.
- Washing: Wash plate 3–4 times with wash buffer (PBS with 0.05% Tween-20).
- Detection Antibody: Add biotinylated detection antibody at optimized concentration. Incubate 1–2 hours at RT.
- Washing: Repeat wash step.
- Enzyme Conjugate: Add streptavidin-HRP conjugate. Incubate 30–60 min at RT.
- Washing: Repeat wash step thoroughly.
- Precipitating Fluorescent Substrate: Add precipitating tyramide-fluorophore substrate (e.g., Tyramide-Alexa Fluor 647). Incubate precisely (e.g., 10 min).
- Stop & Elute: Add elution buffer (e.g., DMSO or specific dissolution buffer) to dissolve the fluorescent precipitate. Mix thoroughly.
II. SCA Instrument Reading:
- Transfer eluate to a sealed vial or plate compatible with the SCA autosampler.
- The instrument automatically injects the sample, counts fluorescent events in the flow cell, and reports molecules per unit volume.
The Scientist's Toolkit: Essential Research Reagent Solutions
Table 3: Key Reagents and Materials
| Item | Function / Role | Example/Notes |
|---|---|---|
| Paramagnetic Beads (Simoa) | Solid phase for immunocomplex formation; enables capture and magnetic washing. | Quanterix Streptavidin-coated beads. Size uniformity is critical. |
| β-Galactosidase Enzyme (SBG) | Label for detection antibody in Simoa. Hydrolyzes substrate to generate fluorescent signal in wells. | Streptavidin-β-Galactosidase conjugate. High specific activity is essential. |
| Precipitating Tyramide Substrate (SCA) | Enzyme substrate that generates a localized, dense fluorescent precipitate on the detection antibody. | Tyramide signal amplification (TSA) kits coupled to bright fluorophores (e.g., AF647). |
| Single Molecule Flow Detector (SCA) | Core instrument that counts individual fluorescent events in a hydrodynamically focused stream. | E.g., SCA instrument from Merck or equivalent. Requires precise microfluidics. |
| High-Sensitivity Fluorophore | Label for detection in SCA; must be extremely bright and photostable for single molecule detection. | Alexa Fluor 647, Phycoerythrin (PE). |
| Low-Binding Microplates & Tubes | Minimizes nonspecific adsorption of low-abundance target proteins, crucial for both techniques. | Polypropylene plates/tubes, siliconized tubes. |
| Ultra-Pure Assay Diluents | Matrix for standards and samples; must be optimized to reduce background in high-sensitivity assays. | Commercial Simoa diluent or in-house formulations with high-grade BSA/protease inhibitors. |
| Reference Standard (CRM) | Highly characterized, pure analyte for generating the standard curve. Defines assay accuracy. | WHO International Standards or NIST Reference Materials are preferred. |
Within the broader thesis of developing a comprehensive step-by-step guide for ELISA research, a critical, often overlooked, component is the strategic selection of assay format. This selection is governed by a rigorous cost-benefit analysis weighing three interdependent pillars: throughput (samples per unit time), sensitivity (lowest detectable concentration), and multiplexing (targets per sample). This whitepaper provides an in-depth technical guide to quantifying these parameters and making informed decisions for drug development and research applications.
Core Concepts and Quantitative Comparisons
Defining the Key Parameters
- Throughput: The number of samples that can be analyzed in a given timeframe. High-throughput systems are essential for screening applications.
- Sensitivity: The lowest concentration of analyte that can be reliably distinguished from background. Critical for detecting low-abundance biomarkers.
- Multiplexing: The simultaneous measurement of multiple analytes in a single sample well. Conserves sample volume and provides correlated data.
Assay Format Comparison
The choice between traditional ELISA, chemiluminescent ELISA, and multiplex bead-based arrays (e.g., Luminex) dictates the performance landscape.
Table 1: Comparative Analysis of ELISA-Based Formats
| Parameter | Traditional Colorimetric ELISA | Chemiluminescent ELISA | Multiplex Bead-Based Array (e.g., Luminex) |
|---|---|---|---|
| Typical Throughput | 40-96 samples/run (manual); 2-4 hours | 40-96 samples/run (manual); 2-4 hours | 96-384 samples/run; 2-3 hours |
| Assay Time | 4-5 hours | 3-4 hours | 3-4 hours (incubation) + bead reading |
| Sensitivity (Typical) | High (pg/mL range) | Very High (fg/mL - low pg/mL) | Moderate to High (pg/mL range) |
| Multiplexing Capacity | Singleplex only | Singleplex only | High (up to 50-500 targets) |
| Dynamic Range | 2-3 logs | 3-5 logs | 3-4 logs |
| Sample Volume Required | 50-100 µL | 25-50 µL | 25-50 µL (for multiple targets) |
| Primary Cost Driver | Plates, antibodies, TMB substrate | Plates, antibodies, luminescent substrate | Bead sets, specialized reader, detection antibodies |
| Best Suited For | Targeted, single-analyte studies; validation | Ultra-sensitive single-analyte detection | Discovery-phase biomarker panels, cytokine profiling, signaling pathway analysis |
Experimental Protocols for Key Comparisons
Protocol 1: Determining Assay Sensitivity (Limit of Detection - LOD)
Objective: To empirically determine the Lowest Detectable Concentration for a given ELISA format. Method:
- Prepare a dilution series of the analyte standard in the recommended matrix (e.g., assay buffer, diluted serum) covering a range expected to be below the estimated detection limit (e.g., 0, 0.5, 1, 2, 5, 10 pg/mL).
- Run the dilution series in replicates (n=8-10) for the target ELISA (colorimetric, chemiluminescent, or multiplex).
- Include replicate wells of the "zero" analyte standard (background).
- Perform the assay according to the optimized protocol.
- Calculation: LOD = Mean(background) + 2*SD(background). Determine the corresponding concentration from the standard curve.
Protocol 2: Throughput Benchmarking
Objective: To measure the hands-on time and total time to result for 96 samples. Method:
- Standardize the workflow: plate coating, blocking, sample/antibody incubations, washes, and detection.
- For each format (manual 96-well plate vs. automated liquid handler vs. bead-based array processor), time each step for a full 96-sample plate.
- Record: a) Total hands-on time, b) Total incubation/waiting time, c) Time to final data acquisition.
- Calculate samples processed per hour of total time and per hour of hands-on time.
Protocol 3: Multiplexing Validation (Bead-Based Array)
Objective: To verify the lack of cross-reactivity in a multiplex panel. Method:
- Select a multiplex panel (e.g., 10-plex cytokine panel).
- For each analyte in the panel, prepare a sample spiked with a high concentration (top of standard curve) of that single analyte only.
- Run all single-analyte-spiked samples on the multiplex array.
- Analyze data: Signal for each analyte should be high only in its corresponding spiked sample and at background levels in samples spiked with other analytes. This confirms antibody specificity within the multiplex mix.
Visualizing the Decision Workflow and Pathways
Title: Decision Flowchart for ELISA Format Selection
Title: Core ELISA Detection Pathway and Signal Options
The Scientist's Toolkit: Research Reagent Solutions
Table 2: Essential Materials for Cost-Benefit Analysis Experiments
| Item | Function in Analysis | Key Consideration |
|---|---|---|
| Pre-Coated ELISA Plates | Ready-to-use plates with immobilized capture antibody. Saves time, increases reproducibility. | Costly; optimal for focused, high-throughput singleplex studies. |
| Matched Antibody Pairs | Optimized capture and detection antibodies for a specific target. Foundational for reliable assays. | Validation data is crucial. Bulk purchasing for multiple targets can reduce cost. |
| Chemiluminescent Substrate | Provides amplified signal for ultra-sensitive detection (e.g., HRP-Luminol systems). | Higher cost than TMB, but superior sensitivity reduces repeat runs. |
| Multiplex Bead Sets | Magnetic or non-magnetic beads with unique spectral signatures, each coated with a different capture antibody. | Enables multiplexing. Requires compatible flow-based or imaging reader. |
| Automated Plate Washer | Ensures consistent, efficient removal of unbound material across all wells. | Majorly improves throughput and reproducibility, reducing inter-operator variability. |
| Microplate Reader | Instrument to measure absorbance, fluorescence, or luminescence. | Must match detection mode (colorimetric, fluorescent, luminescent). Multi-mode readers offer flexibility. |
| Sample Dilution Buffer | Matrix to dilute samples and standards, minimizing non-specific background. | Critical for accuracy in complex matrices like serum. May require optimization. |
| Data Analysis Software | For curve fitting, interpolation of unknowns, and statistical analysis (LOD/LOQ). | Integrated software (e.g., with Luminex) speeds analysis. 4- or 5-parameter logistic (4PL/5PL) models are standard. |
Within the broader thesis on ELISA development, the evolution from conventional plate-based assays to Digital ELISA (dELISA) and its integration with automated high-throughput screening (HTS) platforms represents a paradigm shift. This whitepaper details the core technologies, experimental protocols, and future trajectories that are setting new benchmarks for sensitivity, throughput, and reproducibility in biomedical research and drug discovery.
Core Technology: Principles of Digital ELISA
Digital ELISA achieves attomolar sensitivity by segregating single enzyme-labeled immunocomplexes into arrays of femtoliter-volume wells (e.g., Simoa technology) and detecting fluorescence from individual enzymatic product molecules.
Key Signaling Pathway & Workflow:
Diagram Title: Digital ELISA Immunocomplex Formation and Detection Pathway
Quantitative Performance Data
Recent studies demonstrate the superior performance of dELISA versus conventional ELISA.
Table 1: Performance Comparison of Conventional vs. Digital ELISA
| Parameter | Conventional ELISA | Digital ELISA (Simoa) | Notes |
|---|---|---|---|
| Typical Sensitivity | 1-10 pg/mL | 0.01-0.1 pg/mL (fg/mL) | 100-1000x improvement |
| Dynamic Range | 2-3 log | 3-4 log | Extended lower limit |
| Assay Time | 4-8 hours | 2-4 hours | Reduced incubation via microfluidics |
| Coefficient of Variation (CV) | 10-15% | <10% (often ~5%) | Improved reproducibility |
| Sample Volume | 50-100 µL | <25 µL | Critical for rare samples |
Experimental Protocols
Protocol: Digital ELISA for Cytokine Detection in Serum
Objective: Quantify IL-6 in human serum at sub-femtomolar concentration.
Research Reagent Solutions & Essential Materials:
Table 2: Key Reagents for Digital ELISA
| Reagent/Material | Function | Example (Vendor) |
|---|---|---|
| Paramagnetic Beads | Solid phase for capture antibody immobilization. | Carboxylated beads, 2.7µm (Simoa Homebrew kits) |
| Biotinylated Detection Ab | Binds antigen, links to enzyme via streptavidin. | Anti-IL-6 Biotin (R&D Systems) |
| Streptavidin-β-Galactosidase (SBG) | Enzyme label; generates fluorescent product. | Simoa SBG Conjugate (Quanterix) |
| Fluorogenic Substrate (Resorufin β-D-galactopyranoside) | Enzyme substrate; yields fluorescent resorufin upon cleavage. | Simoa Substrate RGP |
| Array Disc (femtoliter wells) | Partitions beads for single-molecule detection. | Simoa HD-1/HD-X Array Disc |
| Automated Digital Analyzer | Performs bead loading, sealing, imaging, and counting. | Quanterix HD-X Analyzer |
| Assay Buffer | Diluent for samples/reagents, reduces non-specific binding. | Simoa Sample Diluent |
Methodology:
- Bead Preparation: Coat paramagnetic beads with capture antibody per manufacturer's protocol. Block with appropriate buffer (e.g., 0.1% BSA/PBS).
- Immunocomplex Formation (1 hour):
- Mix 25 µL of serum sample (diluted 1:2 in sample diluent) with 10 µL of capture bead suspension.
- Add 10 µL of biotinylated detection antibody. Incubate with shaking (800 rpm) at 25°C.
- Enzyme Labeling (30 min): Wash beads 3x (magnetic separator). Resuspend in 20 µL of SBG conjugate (0.5 pM). Incubate with shaking.
- Array Loading & Sealing (Automated):
- Wash beads 3x to remove unbound SBG.
- Resuspend beads in 20 µL of substrate-containing buffer.
- The analyzer loads the bead suspension into the array disc. Beads settle into wells via gravity (∼50,000 wells/panel). Excess solution is removed, and the array is sealed with oil.
- Imaging & Digital Counting (15 min):
- The analyzer acquires fluorescence images of each array field over time (typically 150-300 sec).
- Wells containing a bead with active enzyme generate a growing fluorescent signal. A threshold algorithm identifies "on" wells (positive) versus "off" wells (negative).
- Data Analysis: The average enzymes per bead (AEB) is calculated: AEB = –ln(1 – (Positive Beads / Total Beads)). Concentration is interpolated from a standard curve (AEB vs. concentration).
Protocol: Integration with Automated Liquid Handling for HTS
Objective: Execute a 384-well dELISA screen for a target biomarker.
Diagram Title: Automated HTS Workflow for Digital ELISA
Methodology:
- System Configuration: Integrate a robotic liquid handler (e.g., Hamilton STAR, Tecan Fluent) with an on-deck incubator/shaker, magnetic wash station, and a digital analyzer.
- Plate-Based Assay Setup: The liquid handler transfers 2 µL of compound/library and 18 µL of sample matrix from source 384-well plates to an assay microplate.
- Automated Immunoassay: Adds 5 µL of capture bead/detection antibody mix. The plate is incubated on-deck. The wash station performs all magnetic wash steps.
- Seamless Transfer: The final bead pellet in each well is resuspended in substrate buffer by the liquid handler.
- Automated Analysis: The analyzer is equipped with a plate handler. It automatically aspirates from each well, performs the digital ELISA steps (loading, sealing, imaging), and outputs data to a Laboratory Information Management System (LIMS).
Future Directions and Challenges
Table 3: Emerging Trends and Development Needs
| Direction | Technical Goal | Potential Impact |
|---|---|---|
| Multiplexing | >10-plex dELISA in a single well via spatially or spectrally encoded beads. | Systems-level biomarker profiling from ultra-low sample volumes. |
| Single-Cell Secretion Analysis | Coupling dELISA to cell isolation (e.g., microfluidics, droplets). | Uncover cellular heterogeneity in immune response and drug resistance. |
| Full Workflow Integration | End-to-end automation from sample prep to final result, leveraging AI for scheduling and QC. | Enable true hands-off, walk-away operation for 24/7 HTS. |
| Point-of-Care (POC) Devices | Developing portable, lower-cost digital detection platforms. | Translate ultra-sensitive diagnostics to clinical settings. |
| Data Science Integration | Advanced algorithms for noise reduction, multiplex deconvolution, and kinetic analysis. | Extract more biological information from digital counting data. |
Primary Challenges: Include the high initial instrument cost, the complexity of developing robust multiplex assays, and the need for specialized reagents and consumables. Standardization of protocols and data reporting across platforms is also crucial for widespread adoption.
Conclusion
Mastering ELISA requires a solid grasp of its foundational immunology principles, meticulous execution of a step-by-step protocol, systematic troubleshooting skills, and rigorous validation. This guide has synthesized these four critical intents, providing a roadmap from assay design to data interpretation. While ELISA remains a cornerstone technique due to its robustness, cost-effectiveness, and wide applicability, researchers must be aware of its limitations in sensitivity and multiplexing. The future of immunoassays lies in integrating the reliability of ELISA with the ultra-sensitivity of platforms like Simoa and the multiplexing power of bead-based arrays. As drug development and personalized medicine advance, the principles outlined here will continue to underpin the generation of high-quality, reproducible data essential for scientific discovery and clinical diagnostics. Continued optimization and validation are paramount to ensure that ELISA-derived results remain trustworthy and impactful in an evolving technological landscape.