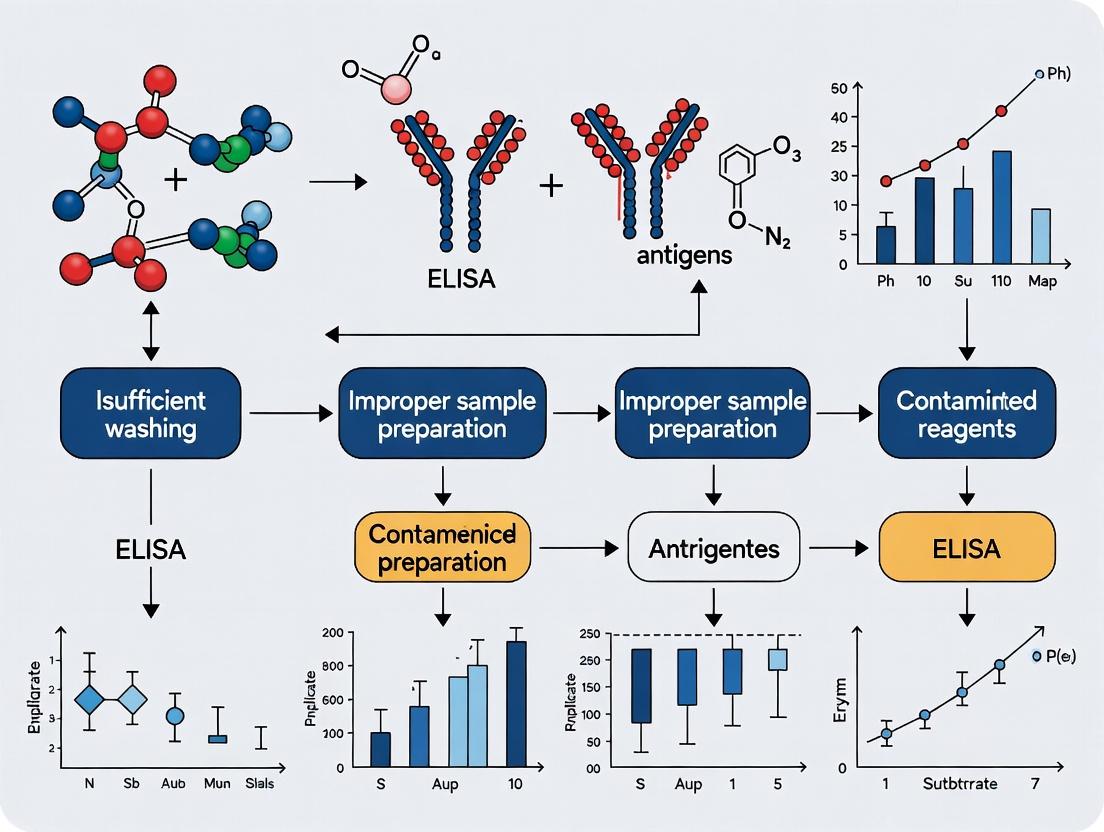
Why Is My ELISA Data Inconsistent? 10 Key Causes of Poor Replicate Variability in Biomedical Research
This comprehensive guide for researchers, scientists, and drug development professionals systematically explores the primary causes of poor replicate data in Enzyme-Linked Immunosorbent Assay (ELISA) experiments.
Why Is My ELISA Data Inconsistent? 10 Key Causes of Poor Replicate Variability in Biomedical Research
Abstract
This comprehensive guide for researchers, scientists, and drug development professionals systematically explores the primary causes of poor replicate data in Enzyme-Linked Immunosorbent Assay (ELISA) experiments. We cover foundational concepts of variability, methodological best practices for sample and reagent handling, step-by-step troubleshooting workflows for high CVs, and strategies for data validation and assay comparison. The article provides actionable insights to improve precision, ensure data integrity, and support robust scientific conclusions in preclinical and clinical research.
Understanding ELISA Replicate Variability: From Theory to Problem Recognition
Troubleshooting Guides & FAQs
Q1: What is the acceptable Coefficient of Variation (CV) for ELISA replicates, and when are they considered "poor"? A1: Acceptance criteria depend on the assay stage and biological sample. Common thresholds are summarized below.
Table 1: Common CV Thresholds for ELISA Replicate Acceptance
| Assay Stage / Sample Type | Typical Acceptable CV | Threshold for "Poor" Replicates | Key Considerations |
|---|---|---|---|
| Standard Curve Points | ≤10% (Often ≤8%) | >15% | High CV here invalidates the entire calibration. |
| Sample Duplicates (General) | ≤15% | >20% | The most common benchmark for routine testing. |
| Sample Duplicates (Cell Culture Supernatant) | ≤20% | >25% | Higher biological variability may be inherent. |
| Intra-assay Precision | <10% | >10% | CV across multiple replicates within the same plate. |
| Inter-assay Precision | <15% | >15% | CV across replicates run in different assays/plates/days. |
Q2: My sample duplicates have a high CV (>20%). What are the most common technical causes? A2: High CV between duplicates typically points to pipetting errors or uneven reagent distribution.
- Primary Cause: Inaccurate pipetting during sample or reagent addition. Always calibrate pipettes regularly and use good technique.
- Troubleshooting Protocol: 1) Visually inspect wells for equal liquid volume. 2) Ensure thorough mixing of samples and reagents before addition. 3) Check that the plate washer nozzles are not clogged, causing uneven washing. 4) Confirm the plate is properly sealed during incubations to prevent edge well evaporation.
Q3: My entire standard curve has high CVs. What should I investigate? A3: This indicates a systemic issue with assay setup.
- Primary Cause: Improper reconstitution or serial dilution of the standard.
- Detailed Protocol for Standard Preparation: 1) Allow the standard vial to equilibrate to room temperature. 2) Reconstitute exactly as per the kit instructions, using the specified diluent. 3) Vortex thoroughly (e.g., 15-30 seconds) to ensure complete mixing. 4) When performing serial dilutions, use a new pipette tip for each transfer and mix the dilution thoroughly before proceeding to the next step. 5) Prepare the standard curve in duplicate at a minimum.
Q4: How can I distinguish between poor technique and problematic sample biology? A4: Implement control experiments.
- Protocol for Investigating Sample Matrix Effects: 1) Perform a spike-and-recovery experiment. Spike a known amount of the analyte into your sample matrix and a neutral buffer (e.g., assay diluent). 2) Calculate the percentage recovery:
(Concentration in spiked sample / Concentration in spiked buffer) * 100. 3) Recovery outside 80-120% suggests matrix interference (e.g., from lipids, heterophilic antibodies, or other proteins) that can cause erratic replicate values.
The Scientist's Toolkit: Key Research Reagent Solutions
Table 2: Essential Materials for Robust ELISA Replication
| Item | Function & Importance for Replicate Quality |
|---|---|
| Calibrated, Precision Pipettes (P2, P20, P200, P1000) | Accurate liquid handling is the single most critical factor for low CV. Regular calibration is mandatory. |
| Low-Binding Pipette Tips | Prevents analyte loss due to adhesion to tip walls, improving accuracy and precision. |
| Microplate Reader with Validated Performance | Must have a stable light source and accurate filter alignment. Regular maintenance and validation with absorbance standards are required. |
| Plate Washer (or Manual Washing System) | Consistent and thorough washing is vital. Clogged nozzles lead to high background and variable results. |
| Assay-Specific Positive Control | Monitors inter-assay precision over time. A shifting control value indicates assay drift. |
| Matrix-Blocking Reagents (e.g., BSA, Casein) | Critical for reducing non-specific binding, which contributes to high background and signal variability. |
Experimental Workflow & Decision Pathway
Title: ELISA Replicate Quality Assessment & Troubleshooting Workflow
Technical Support Center: ELISA Troubleshooting Hub
This support center addresses common and critical issues leading to poor replicate precision in ELISA assays, a primary source of data variability that compromises research reproducibility and drug development pipelines.
Frequently Asked Questions (FAQs)
Q1: Our ELISA standard curve is acceptable, but our replicate CVs are consistently high (>20%). What are the most likely causes? A1: High inter-replicate CVs with a good standard curve typically point to issues with sample or reagent handling precision, not assay design. Key troubleshooting steps include:
- Pipetting Technique: Manual pipetting of samples, especially viscous ones, is a major culprit. Implement and mandate the use of calibrated, positive-displacement pipettes for critical steps.
- Plate Washing Inconsistency: Incomplete aspiration or uneven dwell time with wash buffer causes differential bound/free separation. Automate washing or rigorously standardize manual wash cycles (e.g., 3 x 5-minute soaks with complete aspiration).
- Inconsistent Incubation Conditions: Evaporation at the plate edges during incubation creates a "edge effect." Always use a sealed, humidified chamber and ensure the plate is level in the incubator.
Q2: We observe high background across all wells, compressing our dynamic range and increasing variability. How do we resolve this? A2: High background noise drowns out signal and increases variance. Systematic checks are required:
- Non-Specific Binding (NSB): Ensure your blocking buffer (e.g., 5% BSA in TBST) is compatible and that the blocking time is sufficient (minimum 1 hour at RT).
- Detection Antibody Concentration: The detection antibody may be too concentrated. Titrate it against a negative control to find the optimal signal-to-noise ratio.
- Contaminated Wash Buffer: Prepare fresh wash buffer daily. Old buffer can grow microbes that increase background.
- Substrate Issues: Ensure the TMB substrate is fresh and protected from light. Develop for the exact same duration for all plates.
Q3: One or two outliers within a replicate set are ruining our statistical analysis. Should we discard them? A3: Arbitrary data exclusion invalidates results. First, investigate technical causes:
- Bubble Inspection: Check the raw plate for bubbles in the outlier wells, which disrupt absorbance readings.
- Well Integrity: Inspect for scratches or coating defects on the bottom of the outlier wells.
- Pipette Tip Performance: For the affected wells, the pipette tip may have been faulty or not properly seated. Re-test the sample in a new well if volume allows, using a fresh tip from a different box.
- Statistical Outlier Tests: Only after exhausting technical checks, apply a pre-defined statistical test (e.g., Grubbs' Test) for outlier identification. Document the rationale for any exclusion.
Q4: How does poor ELISA replicate precision directly impact drug development metrics like IC50 or EC50? A4: Poor precision inflates confidence intervals and reduces the reliability of potency measurements, directly impacting key development decisions.
Table 1: Impact of Replicate Variability on Drug Potency Metrics
| Assay CV | Effect on IC50/EC50 95% CI | Consequence for Decision-Making |
|---|---|---|
| <10% (Good) | Narrow confidence interval. True potency estimate is reliable. | High confidence in compound ranking and structure-activity relationships (SAR). |
| 10-15% (Moderate) | Wider confidence interval. Potency estimate has moderate uncertainty. | May obscure small but meaningful differences between compound analogs. |
| >15% (Poor) | Very wide or unstable confidence interval. Potency estimate is unreliable. | Risk of advancing inferior compounds or failing promising ones. SAR guidance is compromised. |
Detailed Troubleshooting Protocols
Protocol 1: Systematic Pipette Calibration and Technique Verification
- Objective: Eliminate pipetting as a source of variability.
- Materials: Calibrated analytical balance, high-purity water, weigh boats, pipettes in critical volumes (e.g., 10µL, 50µL, 100µL).
- Method:
- Set the room to consistent temperature and humidity.
- Tare the balance with an empty weigh boat.
- For each pipette and volume, perform 10 consecutive dispenses of water into the boat, recording the weight after each dispense.
- Calculate the actual volume delivered each time (assuming 1 µL = 1 mg at lab conditions).
- Calculate the accuracy (mean vs. target) and precision (CV%) for each pipette.
- Acceptance Criteria: For volumes ≥10µL, CV should be <2%. Pipettes failing this must be serviced.
Protocol 2: Validation of Plate Washer Performance
- Objective: Ensure uniform washing across all wells to minimize background variance.
- Materials: Clear 96-well plate, solution of colored dye (e.g., tartrazine), plate washer, microplate reader.
- Method:
- Fill all wells of the plate with an identical volume (e.g., 100µL) of dye solution.
- Program the plate washer to execute a standard ELISA wash cycle (e.g., 5 cycles of fill and aspirate).
- After washing, measure the absorbance of each well at the dye's peak wavelength.
- Calculate the mean absorbance and CV across the entire plate.
- Acceptance Criteria: Post-wash CV across the plate should be <5%. High CV indicates uneven aspiration or dispensing, requiring washer head maintenance.
Visualizations
Diagram Title: ELISA Workflow with Critical Variability Points
Diagram Title: Data Analysis Path & Consequences of Poor Precision
The Scientist's Toolkit: Essential Reagents & Materials for Precision ELISA
Table 2: Research Reagent Solutions for Robust ELISA
| Item | Function & Role in Precision | Recommendation for Best Practice |
|---|---|---|
| High-Binding Plates | Provides uniform protein adsorption. Critical for consistent coating. | Use plates from the same manufacturer and lot for an entire study. |
| Calibrated Pipettes | Ensures accurate and precise liquid transfer, the foundation of low CV. | Perform quarterly gravimetric calibration. Use low-retention tips for viscous samples. |
| Reference Standard | The anchor for all quantitative calculations. Inconsistency here propagates. | Use a certified, stable standard. Prepare fresh aliquots to avoid freeze-thaw cycles. |
| Protein-Free Blocking Buffer | Reduces NSB without interfering with antigen-antibody binding. | Use a commercial, ready-to-use buffer for lot-to-lot consistency over long studies. |
| Automated Plate Washer | Provides repeatable and thorough washing, a major source of technical noise. | Validate performance monthly (Protocol 2). Keep ports and aspiration needles clean. |
| Plate Reader with Temperature Control | Ensures stable incubation for kinetic reads and consistent endpoint measurements. | Calibrate optics annually. Pre-warm the chamber before running a plate. |
| Single-Lot Antibody Cocktail | Minimizes variability from detection reagent differences. | Purchase all necessary antibody aliquots for a multi-month project from a single lot. |
| Stable, Liquid Substrate | Eliminates variability from substrate reconstitution errors. | Use a room-temperature stable, ready-to-use TMB substrate. Protect from light. |
Troubleshooting Guides & FAQs
FAQ 1: My replicate wells show high variability (high CV%), and values are scattered both above and below the mean. What is the likely cause and how can I fix it? Answer: This pattern typically indicates Random Error. The inconsistency is non-directional and often stems from imprecise liquid handling.
- Primary Cause: Inconsistent pipetting technique, particularly during serial dilution of standards or addition of samples/reagents.
- Solution:
- Calibrate pipettes regularly.
- Use reverse pipetting for viscous liquids (e.g., sera, detection antibody).
- Pre-wet pipette tips.
- Ensure all liquid is dispensed consistently.
- Use multichannel pipettes with equal tip seal pressure.
FAQ 2: My replicates are tight (low CV%), but all values are consistently higher or lower than expected, causing a shift in the standard curve. What does this mean? Answer: This indicates Systematic Error (bias). The error is directional and affects all replicates equally.
- Primary Cause: Incorrect preparation of reagent concentrations or expired/improperly stored critical components.
- Solution:
- Verify preparation of standard stock and dilution buffers.
- Check expiration dates on all reagents, especially enzyme conjugates and substrates.
- Ensure consistent incubation times and temperatures across all wells using a calibrated plate sealer and reader.
FAQ 3: The outer perimeter wells of my plate show consistently different OD values compared to the center wells (edge effect). Is this systematic or random? Answer: This is a Systematic Error. It is a predictable, non-uniform environmental effect across the plate.
- Primary Cause: Temperature gradient during incubation or uneven washing.
- Solution:
- Incubate plates in a humidified, static incubator (not on a lab bench).
- Use a plate washer with consistent pressure and patency check for all nozzles.
- Consider using a plate seal during incubations to prevent evaporation.
- If possible, avoid using the outermost wells; fill with buffer instead.
Experimental Protocol: Method for Investigating Pipette-Induced Random Error
Title: Protocol for Assessing Pipetting Precision in ELISA Workflow Objective: To quantify the contribution of manual pipetting to well-to-well variability (Random Error). Materials: PBS buffer, dye solution (e.g., tartrazine), calibrated spectrophotometric plate reader, multichannel and single-channel pipettes. Method:
- Using a multichannel pipette, dispense 100 µL of PBS into all 96 wells of a microplate.
- Using a single-channel pipette, perform a simulated "sample addition" by adding 10 µL of dye solution to 12 replicate wells.
- Cover the plate, mix on a plate shaker for 1 minute.
- Measure the absorbance at 415 nm.
- Calculate the mean, standard deviation, and Coefficient of Variation (CV%) for the 12 replicates.
- Acceptance Criterion: CV% should be <10%. A higher CV% pinpoints pipetting as a major source of random error.
Quantitative Data Summary: Common Error Sources in ELISA
| Error Category | Specific Source | Typical Impact on CV% | Effect on Standard Curve |
|---|---|---|---|
| Random Error | Manual Sample Pipetting | Increases by 10-25% | Increased scatter of replicate points |
| Random Error | Inconsistent Washing | Increases by 15-30% | High background variability |
| Systematic Error | Incorrect Standard Dilution | Unchanged | Shift in curve slope & accuracy |
| Systematic Error | Expired TMB Substrate | Unchanged | Lower overall OD, reduced sensitivity |
| Systematic Error | Plate Reader Calibration Drift | Unchanged | Vertical shift of all data points |
The Scientist's Toolkit: Key Research Reagent Solutions
| Item | Function & Importance for Consistency |
|---|---|
| Matched Antibody Pair | Ensures specific, sensitive capture and detection; mismatched pairs cause systematic bias. |
| Lyophilized Standard | Provides a stable, reproducible anchor for the calibration curve; in-house prep introduces error. |
| Stable TMB Substrate | Critical for uniform color development; lot-to-lot variability is a common systematic error source. |
| Blocking Buffer (Protein-based) | Prevents non-specific binding; inadequate blocking increases background noise (random error). |
| Precision Microplate Washer | Removes unbound reagent consistently; manual washing is a major source of random error. |
Diagram: Systematic vs. Random Error Impact on ELISA Data
Diagram: ELISA Workflow with Critical Control Points
Troubleshooting Guides & FAQs
This technical support center addresses common pre-analytical errors that lead to poor ELISA replicate data, undermining research reproducibility in drug development.
FAQ: Sample Integrity & Hemolysis
Q1: My human plasma ELISA results show high CVs (>25%) between replicates. Visual inspection shows slightly pinkish samples. Is hemolysis the cause? A: Yes. Hemoglobin from lysed red blood cells absorbs at 450 nm, interfering with the chromogenic readout of common ELISA substrates. A hemoglobin concentration as low as 0.2 mg/mL can cause a 10% increase in apparent absorbance.
Q2: How can I quickly assess if hemolysis is affecting my plate? A: Protocol: Visually inspect samples post-thaw. For quantification, centrifuge a 50 µL aliquot at 10,000 x g for 5 min. Measure absorbance of the supernatant at 414 nm, 541 nm, and 575 nm. Use the following reference table:
Table 1: Hemolysis Interference Thresholds in ELISA
| Hemoglobin (mg/mL) | A414 nm | Expected OD450 Increase | Action |
|---|---|---|---|
| < 0.1 | < 0.15 | Negligible (<2%) | Proceed. |
| 0.1 - 0.2 | 0.15 - 0.30 | Mild (2-10%) | Flag data. |
| > 0.2 | > 0.30 | Significant (>10%) | Re-collect sample. |
FAQ: Collection Protocols & Anticoagulants
Q3: For cytokine measurement in serum vs. K2EDTA plasma, which gives more consistent replicate data? A: Consistency depends on the analyte. Serum collection involves clot activation, which can release platelet-derived factors (e.g., PF4) that interfere with some antibodies. For cytokine panels (e.g., IL-6, TNF-α), K2EDTA plasma generally provides more consistent inter-replicate data by inhibiting protease-mediated degradation. See protocol below.
Experimental Protocol: Comparative Sample Collection for Cytokine ELISA
- Collection: Draw blood into both serum separator tubes (SST) and K2EDTA tubes.
- Processing: Process SST tubes after 30-min clot formation at RT. Process K2EDTA tubes immediately by centrifugation (1500 x g, 10 min, 4°C).
- Aliquoting: Aliquot supernatant into 50 µL portions in low-protein-binding tubes.
- Analysis: Run all samples in the same ELISA batch (triplicate wells).
- Data Check: Calculate CV for each sample's triplicates. Plasma CVs are typically 5-10% lower than serum for labile cytokines.
FAQ: Storage Conditions & Freeze-Thaw
Q4: I observed a loss of signal after two freeze-thaw cycles. What is the acceptable threshold? A: Most analytes tolerate 1-2 cycles. A >15% mean signal loss compared to fresh is unacceptable. Adhere to a strict single-use aliquot protocol.
Q5: What is the best practice for long-term storage of samples for a multi-year study? A: Store at -80°C in single-use aliquots. Avoid frost-free freezers. Use the following matrix:
Table 2: Sample Storage Stability Impact on ELISA Replicate CV
| Analyte Class | -20°C (1 year) | -80°C (1 year) | Maximum Freeze-Thaws (Signal Loss) |
|---|---|---|---|
| Stable Proteins (Albumin) | CV increase: ~5% | CV increase: <2% | 3 (<10%) |
| Labile Cytokines (IL-1β) | CV increase: 15-20% | CV increase: ~5% | 1 (>15% after 2nd) |
| Phospho-Proteins | Not Recommended | CV increase: ~8% | 0 (Aliquot before 1st freeze) |
The Scientist's Toolkit: Key Research Reagent Solutions
Table 3: Essential Materials for Pre-Analytical Integrity
| Item | Function & Relevance to ELISA Reproducibility |
|---|---|
| Protease Inhibitor Cocktails | Prevents analyte degradation post-collection, critical for phosphorylated epitopes and cytokines. |
| Low-Protein-Binding Tubes | Minimizes analyte adhesion to tube walls, preventing concentration drift that increases well-to-well variation. |
| Validated Collection Tubes | Ensures tube additives (e.g., clot activators, anticoagulants) do not leach interfering substances into samples. |
| Automated Liquid Handlers | Reduces pipetting variability, a major source of technical error in replicate wells. |
| Benchtop Centrifuge with Temperature Control | Ensures consistent, cold processing to halt sample degradation immediately post-collection. |
Visualizing the Pre-Analytical Workflow & Impact
Title: Workflow of Pre-Analytical Errors Leading to Poor ELISA Data
Title: Root Cause Analysis of Poor ELISA Replicate Data
Technical Support Center: ELISA Replicate Data Troubleshooting
FAQs & Troubleshooting Guides
Q1: My ELISA data shows high variability between replicates (high %CV). What are the most common causes related to assay design? A: High inter-replicate variability often stems from poor liquid handling during sample/reagent addition, edge effects due to improper plate sealing, or an inconsistent number of replicates that is insufficient to capture true biological variance. Ensure you are using technical replicates (same sample across multiple wells) to capture assay precision and biological replicates (different biological samples) to capture biological variance. A minimum of 3 true biological replicates is standard, but power analysis may require more.
Q2: How should I arrange my samples on the plate to minimize positional effects? A: Never place all replicates of a single sample or all controls in a single column or row. Use randomized or blocked plate layouts. For a 96-well plate, a balanced block design is recommended. Distribute samples and controls across the plate to average out any gradient effects (e.g., temperature, washing).
Example Balanced Block Layout (96-well plate):
Q3: How many replicates do I need for my ELISA experiment to be statistically sound? A: The required number of replicates (n) depends on the expected effect size, the acceptable variability (SD), the desired statistical power (typically 80%), and the significance level (α, typically 0.05). This is determined by a power analysis. The table below summarizes how changing these parameters affects the required sample size.
Table 1: Parameters Influencing Required Replicate Number (Power Analysis)
| Parameter | Typical Goal | Impact on Required N |
|---|---|---|
| Effect Size | Detect a 2-fold change | Larger effect size → Lower N |
| Standard Deviation (SD) | Minimize via optimized protocol | Higher SD → Higher N |
| Statistical Power (1-β) | 80% or higher | Higher power → Higher N |
| Significance Level (α) | 0.05 | Lower α (stricter) → Higher N |
Q4: How do I perform a power analysis for my ELISA experiment? A: Use statistical software (e.g., G*Power, PASS, R, Prism). You need preliminary data to estimate the mean and SD of your control and treatment groups.
Protocol: A Priori Power Analysis Using Preliminary Data
- Pilot Experiment: Run a small-scale ELISA with at least n=3 per group.
- Calculate Parameters: Compute the mean absorbance and SD for each group.
- Determine Effect Size: Cohen's d = (Mean₁ - Mean₂) / Pooled SD.
- Input to Software: Set α=0.05, Power=0.80, effect size (d), and test type (e.g., two-tailed t-test).
- Compute Sample Size: The software outputs the required N per group. Always add 10-15% to account for potential technical issues.
Q5: My standard curve is good, but my sample replicate data is inconsistent. What should I check? A: This points to sample-specific or handling issues. Follow this troubleshooting workflow.
The Scientist's Toolkit: Key Research Reagent Solutions
Table 2: Essential Materials for Robust ELISA Assay Design
| Item | Function & Importance for Replicate Quality |
|---|---|
| Pre-coated ELISA Plates | Ensure lot-to-lot consistency. High-binding plates minimize well-to-well variation in antigen capture. |
| Reference Standard (Lyophilized) | Provides a stable calibrator for the standard curve. Accurate reconstitution is critical for inter-assay precision. |
| Matrix-Matched Controls | Controls (e.g., pooled serum, buffer) that match the sample matrix are essential to identify non-specific background or interference. |
| Low-Binding Microcentrifuge Tubes & Plates | Minimizes analyte loss due to adhesion during sample/reagent preparation, improving accuracy. |
| Calibrated, Serviceable Pipettes | Accurate liquid handling is the single largest technical factor affecting replicate variability. Regular calibration is mandatory. |
| Multichannel Pipette/Electronic Repeater | Increases speed and consistency when dispensing reagents or samples across many replicates. |
| Plate Sealer (Adhesive & Heat Seal) | Prevents evaporation and well-to-well contamination during incubations, critical for minimizing edge effects. |
| Validated ELISA Data Analysis Software | Software that can fit 4- or 5-parameter logistic (4PL/5PL) curves and handle outlier detection is key for accurate replicate analysis. |
Best Practices for Reliable ELISA Execution: A Proactive Methodology Guide
Troubleshooting Guides & FAQs
Q1: Why do my ELISA replicates show high CV% (>20%) after homogenizing tissue samples? A: High CV% often stems from incomplete or inconsistent homogenization, leading to uneven analyte distribution. Ensure:
- The homogenization buffer volume is sufficient (typically 5-10x tissue weight).
- Homogenization is performed consistently (time, speed, number of cycles) across all samples using calibrated equipment.
- The sample is kept cold throughout to prevent degradation.
- Post-homogenization, a clarifying spin (e.g., 10,000 x g, 10 min, 4°C) is uniformly applied before aliquotting the supernatant for analysis.
Q2: My standard curve looks good, but my sample values are erratic. Could my dilution scheme be the problem? A: Yes. Erratic sample values, especially at low dilutions, frequently indicate matrix effects. The sample matrix (e.g., lipids, proteins, salts) can interfere with antibody binding. Implement a linearity-of-dilution experiment:
- Prepare a 1:2 serial dilution of your sample in the recommended assay buffer or a validated matrix diluent.
- Run all dilutions in the same ELISA.
- Plot the observed concentration against the dilution factor. Recovery should be linear. Non-linearity (especially at low dilution) confirms matrix interference, necessitating a higher optimal dilution factor.
Q3: How do I determine the optimal dilution factor to overcome matrix effects? A: Perform a spike-and-recovery experiment combined with parallelism testing. This is the gold standard for validating sample dilution.
Experimental Protocol: Spike-and-Recovery & Parallelism
- Prepare Samples:
- Baseline Sample: Aliquot a pooled sample at your intended starting dilution (e.g., 1:10).
- Spiked Sample: To another aliquot of the pooled sample, add a known quantity (spike) of the pure recombinant target analyte. The spike should increase the concentration within the assay's measurable range.
- Standard in Buffer: Prepare ELISA standards in assay buffer.
- Standard in Matrix: Prepare ELISA standards in the same matrix as your sample (e.g., pooled, analyte-depleted sample), diluted to the same final factor as your samples.
- Run ELISA: Analyze all samples and both standard curves in the same plate.
- Calculate:
- Recovery (%) = [(Observed concentration in spiked sample) – (Observed concentration in baseline sample)] / (Theoretical spike concentration) x 100.
- Acceptance Criteria: Recovery should be 80-120%. Parallelism is assessed by comparing the slope of the standard curve in buffer vs. the standard curve in the sample matrix. Slopes should be within 10-15%.
Table 1: Interpretation of Spike-and-Recovery Results
| Recovery Result | Parallelism (Slope Comparison) | Interpretation | Action |
|---|---|---|---|
| 80-120% | Slopes within 10-15% | Minimal matrix effect. Dilution scheme is valid. | Proceed with current protocol. |
| <80% or >120% | Slopes differ >15% | Significant matrix interference. | Increase dilution factor and re-test. Consider alternative homogenization buffer or sample clean-up (e.g., precipitation). |
| 80-120% | Slopes differ >15% | Matrix causes non-specific interference. | The matrix may contain binding proteins. Use a validated matrix diluent or a different assay format. |
Q4: What are common causes of poor inter-assay reproducibility in sample preparation? A: Key variables include:
- Homogenizer Probe Wear: Worn probes reduce efficiency. Establish a maintenance and replacement schedule.
- Inconsistent Incubation Times: During multi-step protocols (e.g., lipid extraction, protein precipitation), timings must be strict.
- Temperature Fluctuations: Thawing samples at room temperature vs. on ice can cause differential degradation.
- Viscosity Differences: Highly viscous samples (e.g., lung homogenates) pipetted inaccurately. Consider using positive displacement pipettes.
The Scientist's Toolkit: Key Research Reagent Solutions
Table 2: Essential Materials for Optimized ELISA Sample Prep
| Item | Function & Importance |
|---|---|
| Protease/Phosphatase Inhibitor Cocktails | Prevents post-homogenization degradation of proteins and phospho-epitopes, preserving analyte integrity. |
| RIPA or NP-40 Lysis Buffer | Common buffers for cell/tissue homogenization that efficiently solubilize membrane and cytoplasmic proteins for target detection. |
| Matrix-Matched Calibrators/Diluents | Commercially available or prepared analyte-depleted matrices used to prepare standard curves, mitigating matrix effects. |
| Bovine Serum Albumin (BSA) or Serum | Used as a blocking agent in assay buffers to reduce non-specific binding in immunoassays. |
| Positive Displacement Pipettes & Tips | Essential for accurate and reproducible transfer of viscous homogenates or organic solvent mixtures. |
| Cryogenic Tissue Grinders (Bead Mills) | Provide highly reproducible, simultaneous homogenization of multiple samples, ideal for difficult tissues (e.g., tendon, skin). |
| Siliconized/Low-Bind Microtubes & Plates | Minimize analyte loss due to adsorption to plastic surfaces, critical for low-abundance targets. |
Workflow & Pathway Visualizations
ELISA Sample Prep Validation Workflow
Matrix Effects on ELISA Antigen-Antibody Binding
Troubleshooting Guides & FAQs
FAQ 1: Why are my ELISA replicates showing high CV% (>20%) despite using the same master mix?
- Answer: High inter-replicate variability is a classic symptom of poor pipetting precision. Even with a master mix, inconsistent liquid handling during aliquot transfer to the plate wells introduces volumetric error. This is especially critical for small volumes (<50 µL) of reagents like detection antibody or substrate. Ensure your pipettes are regularly calibrated and that operators are trained in proper technique (e.g., pre-wetting tips, using consistent plunger pressure and speed).
FAQ 2: My standard curve is non-linear or has poor fit (R² < 0.99). Could pipetting be the cause?
- Answer: Absolutely. A non-linear standard curve often originates from inaccurate serial dilution steps. Inconsistent volumes during dilution lead to incorrect final concentrations of your standard, distorting the curve. Always use calibrated pipettes for serial dilutions, change tips between each step, and consider performing dilutions in larger volumes to minimize the impact of pipetting error.
FAQ 3: I observe edge effects (higher/lower signal in perimeter wells) in my ELISA plate. Is this a pipetting issue?
- Answer: While temperature gradients can cause edge effects, inconsistent pipetting at the bottom of the wells is a frequent contributor. If reagent is inconsistently deposited (e.g., on the side vs. the bottom), evaporation rates and binding kinetics can vary. Ensure pipette tips are immersed consistently to the same depth (1-2 mm) and liquid is dispensed smoothly onto the well bottom.
FAQ 4: How often should I calibrate my micropipettes in a regulated drug development environment?
- Answer: Calibration frequency depends on usage intensity and regulatory requirements (e.g., GLP, GMP). For high-use environments, a quarterly calibration schedule is typical. However, performance verification by the user via daily or weekly gravimetric checks is strongly recommended. Always calibrate after any pipette repair or if it is dropped.
FAQ 5: What is the single most important pipetting habit to improve ELISA data consistency?
- Answer: Consistent pre-wetting of tips. Aspirating and dispensing the liquid at least once before the actual transfer ensures the air cushion inside the tip reaches vapor saturation, leading to a more accurate and precise liquid delivery. This is critical for volatile liquids and for achieving consistency across many replicates.
Data Presentation: Impact of Pipetting Error on ELISA Data
Table 1: Effect of Pipette Calibration Status on ELISA Replicate Variability
| Pipette Calibration Status | Mean O.D. (450nm) | Standard Deviation | Coefficient of Variation (CV%) | Resulting Interpretation |
|---|---|---|---|---|
| Within Specification (±1%) | 1.245 | 0.032 | 2.6% | Reliable, precise data. |
| Out of Specification (-5% bias) | 1.183 | 0.041 | 3.5% | False negative risk. 5% lower signal across all wells. |
| Out of Specification (+8% bias) | 1.345 | 0.118 | 8.8% | False positive risk. Increased CV and inflated signal. |
Table 2: Common Manual Pipetting Errors and Their Consequences in ELISA
| Error Type | Typical Cause | Consequence for ELISA |
|---|---|---|
| Tip Not Pre-wetted | Rush, lack of training. | Under-delivery of reagent, especially in early wells. |
| Inconsistent Immersion Depth | Angled pipette, no visual check. | Variable volumes aspirated, high well-to-well variability. |
| "Blow-out" on First Stop | Using air-displacement pipette like a positive-displacement pipette. | Over-delivery and potential bubble formation. |
| Reverse Pipetting Not Used for Viscous Liquids | Using standard mode for detection antibody/ conjugate. | Under-delivery, weak and variable signal. |
Experimental Protocols
Protocol 1: Monthly Gravimetric Pipette Performance Verification (User-Level)
- Principle: The mass of dispensed water is measured on an analytical balance and converted to volume using the Z-factor for water density at the lab temperature.
- Materials: Analytical balance (0.0001 g sensitivity), distilled water, beaker, weighing vessel, temperature and humidity log.
- Method:
- Record room temperature and humidity.
- Set pipette to desired volume (e.g., 10 µL, 100 µL).
- Pre-wet a new tip 3x with the water.
- Tare the weighing vessel on the balance.
- Dispense 10 aliquots of water into the vessel, recording mass after each dispense.
- Calculate mean volume, accuracy (% deviation from set volume), and precision (%CV).
- Compare results to manufacturer's tolerances (typically ±1-3% for accuracy, <1-3% CV for precision).
Protocol 2: Correct Serial Dilution for ELISA Standard Curve Preparation
- Principle: To create accurate, linear dilutions from a stock standard for a calibration curve.
- Materials: Calibrated pipettes (covering required volume range), sterile microcentrifuge tubes, appropriate dilution buffer, fresh pipette tips for each transfer.
- Method:
- Label tubes (e.g., Neat, 1:2, 1:4, 1:8...).
- Add the required volume of diluent to all tubes except the "Neat" tube.
- Using a fresh tip, transfer the calculated volume of stock standard to the first dilution tube (1:2). Mix thoroughly via pipetting up and down 10x.
- Using a fresh tip, transfer volume from the 1:2 tube to the 1:4 tube. Mix thoroughly.
- Repeat step 4 down the dilution series. Never use the same tip to transfer across different concentrations.
Visualizations
Diagram Title: Logical Flow of Pipetting Errors Leading to Poor ELISA Data
Diagram Title: ELISA Workflow with Critical Pipetting Steps Highlighted
The Scientist's Toolkit: Key Research Reagent Solutions
Table 3: Essential Materials for Precision Pipetting in ELISA
| Item | Function & Importance for Precision |
|---|---|
| Calibrated Air-Displacement Micropipettes | Primary tool for liquid handling. Regular calibration is non-negotiable for data integrity. |
| High-Quality, Filtered Pipette Tips | Ensure a perfect seal, prevent aerosol contamination, and reduce risk of liquid carryover. |
| Positive-Displacement Pipettes & Tips | Essential for accurate pipetting of viscous liquids (e.g., sera, some detection antibodies). |
| Analytical Balance & Weighing Boats | Required for performing user-level gravimetric verification of pipette accuracy and precision. |
| Pipette Calibration Kit/Service Contract | For scheduled, traceable calibration and adjustment to meet quality standards. |
| Pipetting Aid (for serological pipettes) | Provides controlled dispensing for larger volumes of wash buffer, blocking buffer, etc. |
| Non-Volatile Liquid for Practice (e.g., colored buffer, glycerol solution) | Allows for safe practice of technique without wasting expensive reagents. |
Technical Support Center
Troubleshooting Guide: Common Issues and Solutions
Problem: High Inter-Plate or Inter-Well Variability in ELISA Assay
- Symptoms: Inconsistent standard curve slopes, poor replicate data (high CV%), and inaccurate quantification across plates or wells within the same plate.
- Primary Cause: Inconsistent Master Mix preparation and dispensing.
- Root Cause Analysis:
- Inadequate Mixing: Master Mix components not homogeneously combined before aliquoting.
- Pipetting Error: Sequential addition of individual reagents to wells instead of using a bulk Master Mix.
- Evaporation/Concentration Change: Master Mix left uncapped or at room temperature for extended periods.
- Reagent Stability: Enzymes or conjugated antibodies in the mix degrading over time.
Frequently Asked Questions (FAQs)
Q1: Why is preparing a Master Mix critical for obtaining good replicate data in ELISA? A: Preparing a single, well-mixed batch of a reagent (e.g., detection antibody, conjugate, substrate) for all wells/plates eliminates pipetting variability for that component. This ensures every well receives an identical concentration and ratio of reagents, directly minimizing technical variance and improving the Coefficient of Variation (CV) between replicates—a foundational step in troubleshooting poor replicate data.
Q2: How do I calculate the correct volume of Master Mix to prepare? A: Always prepare a surplus volume to account for pipetting dead volume. The standard formula is: (Number of wells × Volume per well) + Excess Volume = Total Master Mix Volume. A minimum of 10% excess is recommended. For critical, low-volume applications, 15-20% excess may be necessary.
Q3: What is the single most important step after preparing the Master Mix? A: Thorough but gentle mixing, followed by brief centrifugation. Vortex mixing or vigorous pipetting of the complete Master Mix ensures homogeneity but must be done before aliquoting to avoid introducing bubbles. Centrifugation (e.g., 1000–2000 × g for 10 seconds) brings all liquid to the bottom of the tube.
Q4: How should I aliquot the Master Mix to ensure consistency across plates? A: Dispense the Master Mix using a calibrated, multi-channel or electronic repeater pipette. For multiple plates, aliquot the mix to all plates in the same sequence and within a short timeframe (≤15 minutes) to prevent settling or evaporation-related concentration changes.
Q5: Can I prepare and store a Master Mix for future ELISA runs? A: Generally, no. Master Mixes containing enzymes (e.g., HRP-conjugate) or labile substrates (e.g., TMB) should be prepared immediately before use and kept on ice or at 4°C in the dark during the dispensing process. Long-term storage can lead to activity loss and increased background.
Table 1: Comparison of Inter-Well CV% With and Without Master Mix Protocol
| Condition | Number of Replicates (n) | Average CV% Across Plates | Notes |
|---|---|---|---|
| Individual Reagent Dispensing | 8 | 12.5% ± 3.2 | High variability due to cumulative pipetting error. |
| Master Mix Protocol (10% excess) | 8 | 4.1% ± 1.1 | Significant reduction in technical variability. |
| Master Mix with Improper Mixing | 8 | 8.7% ± 2.4 | Highlights the necessity of thorough mixing. |
Table 2: Recommended Excess Volume for Master Mix Preparation
| Total Well Volume to be Dispensed | Recommended Minimum Excess | Typical Use Case |
|---|---|---|
| < 1 mL | 20% | Small-scale or pilot studies, 96-well plate. |
| 1 mL – 10 mL | 10-15% | Standard 1-4 plate experiment. |
| > 10 mL | 5-10% | Large-scale screening, multiple plates. |
Experimental Protocol: Optimized Master Mix Preparation and Dispensing
Objective: To ensure consistent reagent delivery across all wells and plates in an ELISA to minimize technical variance in replicate data.
Materials:
- See "The Scientist's Toolkit" below.
Methodology:
- Calculation: Determine the total number of assay wells (include standards, samples, and controls). Multiply by the volume needed per well. Add the recommended excess volume (see Table 2).
- Thawing/Equilibration: Bring all required reagent components (buffer, antibody, enzyme conjugate) to a consistent temperature as per protocol. Mix each component gently before use.
- Assembly in a Master Tube: In a clean, appropriately sized tube, combine the calculated volumes of all common reagents except for any light-sensitive or exceptionally labile components. The tube should have enough headspace for proper mixing.
- Homogenization: Mix the combined Master Mix thoroughly by inverting the tube 10-15 times or by gentle vortexing for 5-10 seconds. Avoid foaming.
- Centrifugation: Briefly pulse-spin the tube in a centrifuge to collect all liquid at the bottom.
- Final Addition: If required, add any critical, labile components (e.g., enzyme), mix gently again by inversion, and proceed immediately to dispensing.
- Dispensing: Using a calibrated multi-channel or electronic dispenser, aliquot the Master Mix to all designated wells across all plates in a consistent, timely manner (<15 min recommended).
- Immediate Proceed: Once dispensed, the plate(s) should be processed to the next incubation step without delay.
Workflow Diagram: Master Mix Preparation Process
Title: ELISA Master Mix Preparation and Dispensing Workflow
The Scientist's Toolkit: Essential Materials for Master Mix Preparation
| Item | Function & Importance for Consistency |
|---|---|
| Low-Binding Microcentrifuge & PCR Tubes | Prevents adsorption of proteins/antibodies to tube walls, ensuring accurate concentration in the mix. |
| Calibrated Electronic or Multi-Channel Pipettes | Enables accurate, repeatable dispensing of the Master Mix across many wells rapidly. |
| Repeater Pipette with Combi-Tips | Ideal for fast, consistent dispensing of a single reagent (like substrate) from a bulk reservoir. |
| Non-Aerosol Pipette Tips | Maintains sterility and prevents cross-contamination when assembling the Master Mix. |
| Microtube Rotator or Gentle Vortex Mixer | Ensures complete, homogeneous mixing of Master Mix components without creating bubbles. |
| Micro-Centrifuge | Brings all liquid to the bottom of the tube after mixing, ensuring volume accuracy for aliquoting. |
| Chilled Microtube Rack or Ice Bucket | Maintains stability of enzyme-containing Master Mixes during the short dispensing period. |
Troubleshooting Guides & FAQs
Q1: What are the most critical timing control points in a typical ELISA that impact replicate variability? A: The most critical timing control points are:
- Primary Antibody Incubation: Typically 1-2 hours at room temperature or overnight at 4°C. Inconsistency here directly affects antigen capture and is a leading cause of poor replicate data.
- Enzyme-Conjugate Incubation: Usually 1 hour at room temperature. Over-incubation increases non-specific binding; under-incubation reduces sensitivity.
- Signal Development (Substrate Incubation): Precise timing (often 5-30 minutes) is paramount. The reaction is kinetic; stopping it at inconsistent time points is a major source of CV > 20%.
- Plate Washes: Insufficient or uneven wash dwell times leave residual unbound reagents, causing high background and variability.
Q2: How does variation in substrate incubation time specifically affect optical density (OD) values and coefficient of variation (CV)? A: Substrate conversion is a time-dependent enzymatic reaction. Small timing differences cause exponential signal differences, especially in the linear range.
Table 1: Impact of Substrate Incubation Time Variability on Simulated OD and CV
| Incubation Time (Minutes) | Mean OD (n=6) | Standard Deviation (SD) | Coefficient of Variation (CV%) |
|---|---|---|---|
| 10 (Reference) | 1.00 | 0.05 | 5.0% |
| 9 (Early Stop) | 0.85 | 0.06 | 7.1% |
| 11 (Late Stop) | 1.18 | 0.07 | 5.9% |
| Mixed (9,10,11 min) | 1.01 | 0.15 | 14.9% |
Protocol for Validating Timing Impact: To test your assay's sensitivity, run a plate where you intentionally vary the substrate incubation stop time across replicates (e.g., +/- 1 minute). Plot OD vs. time to establish the kinetic curve and identify the optimal, linear window for stopping.
Q3: Our lab has high inter-operator CVs. What standardized protocol can we implement for timing? A: Implement a Synchronized Timer Protocol.
Detailed Methodology:
- Pre-set Timers: Use digital timers with alarms for each major incubation step.
- Staggered Start: For large batches, start reactions at 15-30 second intervals per plate to ensure each gets the full, precise incubation and equivalent stop time.
- Stop Solution Sequencing: When stopping the substrate reaction, add stop solution to wells in the same sequence and pace used to add the substrate. Use a multichannel pipette for entire rows.
- Documentation: Log the exact start and stop times for each plate.
Q4: Does incubation temperature instability contribute to timing-related errors? A: Yes, profoundly. Enzyme kinetics are temperature-dependent. An assay calibrated for 25°C will accelerate at 27°C, effectively acting as a longer incubation.
Mitigation Protocol: Pre-warm all reagents and the plate to the target temperature in a calibrated incubator (not on the bench) for 30 minutes before starting the assay. Use a plate sealer during incubations to prevent evaporative cooling.
The Scientist's Toolkit: Key Research Reagent Solutions
Table 2: Essential Reagents for Critical Timing Control in ELISA
| Item | Function in Timing Control |
|---|---|
| Pre-aliquoted Reagents | Minimizes variation in reagent warming/equilibration time and reduces pipetting steps. |
| Ready-to-Use TMB Substrate | Stable, single-component substrate ensures consistent reaction initiation kinetics vs. lab-prepared mixes. |
| Single-step Stop Solution (e.g., 1M H2SO4) | Provides immediate, uniform reaction termination. Acid concentration must be consistent. |
| Multichannel Pipette (Electronic) | Enforces consistent pipetting speed and force across all wells, critical for simultaneous reagent addition/removal. |
| Calibrated Plate Washer | Programmable, consistent wash dwell times and volumes are non-negotiable for reducing background variability. |
| Microplate Reader with Kinetic Mode | Allows reading absorbance at multiple time points for a single well, enabling precise determination of the linear signal range. |
Visualizing the Impact of Timing on ELISA Replicate Consistency
Critical Timing Control Points in ELISA Workflow
Signal Development Kinetic Cascade Relationship
Welcome to the Technical Support Center for Plate Washer Performance. This resource is dedicated to troubleshooting variability in immunoassay results, specifically within the context of investigating poor replicate data in ELISA research. Consistent plate washer operation is critical for precise liquid handling, a key factor often overlooked as a source of data variability.
Troubleshooting Guides & FAQs
Q1: Our ELISA standard curve shows high CVs between replicates, particularly in wells with low analyte concentration. The problem seems random across plates. What should we check first? A: This pattern strongly suggests inconsistent washing, often due to partial tip clogging or alignment issues. Perform the following checks:
- Visual Inspection: Run a wash cycle with a colored dye (e.g., Bromophenol Blue) over an empty plate. Inspect for residual dye in any wells, indicating blocked tips.
- Prime & Purge: Execute three consecutive prime/purge cycles with deionized water or wash buffer to clear any salt or protein deposits from the lines and manifold.
- Tip Alignment: Verify the wash head is perfectly aligned over the plate. Misaligned tips can cause splashing, cross-contamination, or incomplete buffer delivery/aspiration.
Q2: After switching to a new lot of wash buffer, our background signal increased significantly across all assays. Could the plate washer be at fault? A: While the buffer itself should be investigated, the washer can exacerbate the issue. A common cause is residual buffer from the previous lot or system. Perform a full system flush:
- Drain the buffer reservoir and refill with deionized water.
- Run a complete purge cycle.
- Refill with the new wash buffer and run 2-3 wash cycles on a dummy plate to fully equilibrate the system before processing samples.
Q3: How often should we perform formal validation of our plate washer's performance, and what metrics are critical? A: Validation should be performed upon installation, after major maintenance, and quarterly during routine use. The key metrics are summarized below:
Table 1: Critical Metrics for Plate Washer Validation
| Metric | Target Performance | Test Method |
|---|---|---|
| Aspiration Completeness | Residual volume ≤ 2 µL per well | Add 300 µL of water to a dry plate, weigh, aspirate, and re-weigh. |
| Dispense Precision & Accuracy | CV < 5% for delivered volume; within ±5% of target volume. | Dispense dye solution into a plate, then measure absorbance or weight. |
| Cross-Contamination | Absorbance in adjacent wells < 0.5% of source well. | Fill alternating wells with a high-concentration dye, run wash cycle, measure carryover into empty wells. |
| Well-to-Well Consistency | CV of dispensed/dried dye ≤ 10% across entire plate. | Dispense a uniform dye, measure signal from all wells after a single wash/dry cycle. |
Q4: Our lab has multiple users, and we see inter-operator variability in wash steps even with automated washers. How can we standardize this? A: Variability often stems from inconsistent pre-run checks. Implement a mandatory, documented checklist before each use:
- Buffer reservoir is filled and free of bubbles.
- Waste container is empty.
- Tips are visually inspected for debris/bending.
- The correct wash program (number of cycles, soak time, volume) is selected and confirmed.
Q5: We suspect our wash cycles are not removing all unbound components, leading to high background. What parameters in the wash protocol can we optimize? A: Focus on these three parameters in a controlled experiment:
- Soak Time: Increase the dwell time of the wash buffer in the wells (e.g., from 1 second to 5-10 seconds) to improve dissociation of non-specifically bound material.
- Number of Cycles: Incrementally increase wash cycles (e.g., from 3 to 5 or 6). Note: Excessive washing can elute weakly bound target.
- Aspiration Strength/Speed: A slower, more complete aspiration often removes more residual liquid than a fast, turbulent one. Test different settings.
Experimental Protocols for Validation
Protocol 1: Testing for Aspiration Completeness & Cross-Contamination
- Materials: Microplate balance (0.1 mg precision), PBS with 0.1% Bromophenol Blue, clean 96-well plate.
- Procedure: a. Tare the weight of a dry plate. b. Precisely dispense 300 µL of colored PBS into all wells. Weigh to confirm total dispensed volume. c. Program the plate washer to perform a single aspiration cycle using standard parameters. d. After aspiration, dry the plate in an incubator (37°C, 5 min) to evaporate all residual liquid. e. Weigh the plate again. Calculate the average residual volume per well. f. For cross-contamination, fill only Column 3 with dye. Run a full wash cycle. Visually inspect or read absorbance (620 nm) of Columns 2 and 4 for dye carryover.
Protocol 2: Quantifying Dispense Precision
- Materials: Solution of 10 mg/mL Coomassie Brilliant Blue G-250 in 7% acetic acid, clear flat-bottom 96-well plate, plate reader.
- Procedure: a. Program the washer to dispense 300 µL of the Coomassie solution into all wells. b. Run the dispense cycle. c. Read the absorbance at 590 nm immediately. d. Calculate the mean, standard deviation, and CV of all 96 absorbance values. A CV > 5% indicates poor dispense uniformity.
Visualizing Workflows & Relationships
Diagram Title: Root Cause Analysis of ELISA Variability
Diagram Title: ELISA Workflow with Critical Wash Steps Highlighted
The Scientist's Toolkit: Research Reagent Solutions
Table 2: Essential Materials for Washer Validation & Maintenance
| Item | Function & Importance |
|---|---|
| Precision Microplate Balance | Accurately measures residual liquid weight to calculate aspiration completeness. |
| Colored Buffer Dye (e.g., Bromophenol Blue) | Allows visual identification of washing inconsistencies, clogs, and alignment issues. |
| Concentrated Coomassie or Tartrazine Dye | Provides a uniform, quantifiable (via absorbance) solution for testing dispense precision and well-to-well uniformity. |
| Deionized Water, 18.2 MΩ·cm | Used for system flushes and purging to prevent buffer salt crystallization in lines and valves. |
| Plate Washer Calibration Kit | Manufacturer-provided tools (e.g., calibration plates, gauges) for verifying and adjusting mechanical alignment and liquid levels. |
| Validated Wash Buffer | A consistent, filtered (0.2 µm), pH-stable buffer to prevent biological residue and system clogging. |
| Maintenance Logbook | Critical for tracking performance tests, errors, and maintenance, linking washer status to assay performance trends. |
Troubleshooting Guides & FAQs
FAQ 1: Why do my unknown sample concentrations fall outside the range of my standard curve, and how should I proceed?
- Answer: Extrapolation beyond the standard curve is unreliable and a major cause of poor replicate data. The assay's dynamic range is strictly defined by the highest and lowest standard concentrations.
- Action: Re-run the assay with either:
- Dilution: Dilute the unknown sample(s) in the appropriate assay diluent so that the interpolated value falls within the mid-range of the standard curve. Re-calculate the original concentration by multiplying by the dilution factor.
- Curve Adjustment: Prepare a new standard curve with a higher range of concentrations to encompass the high unknown samples, or a lower range for very low samples. This may require validation of the new range.
- Action: Re-run the assay with either:
FAQ 2: My standard curve has a poor fit (R² < 0.99). What are the most common causes?
- Answer: A low coefficient of determination (R²) indicates the model does not accurately describe the concentration-response relationship, leading to inaccurate interpolation.
- Primary Causes & Solutions:
- Improper Standard Preparation: Check serial dilution technique. Always use fresh, calibrated pipettes and change tips between each dilution step. Vortex standards thoroughly after each dilution.
- Inaccurate Pipetting of Standards: Ensure precise volumetric dispensing, especially for the low-concentration standards where errors are magnified.
- Edge Effects on Microplate: Standards and samples should be randomized across the plate to avoid systematic bias from temperature or evaporation gradients. Do not place critical standards only on the perimeter.
- Incorrect Curve Fit Model: ELISA data is typically fit with a 4- or 5-parameter logistic (4PL/5PL) curve. Using a linear fit for sigmoidal data will yield a poor R².
- Primary Causes & Solutions:
FAQ 3: How do I handle a non-ideal (flat or shallow) standard curve that still has an acceptable R²?
- Answer: A shallow curve reduces assay sensitivity and precision, increasing the coefficient of variation (CV) between replicates for unknown samples.
- Troubleshooting Steps:
- Reagent Integrity: Check the expiration dates of all critical reagents, especially the detection antibody and enzyme conjugate. Perform a visual inspection for precipitates or contamination.
- Incubation Times/Temperatures: Ensure all incubation steps (coating, sample, detection) are performed for the exact, validated duration at the correct temperature.
- Preparation of Wash Buffer: Incorrect salt concentration or pH in the wash buffer can increase background noise and flatten the signal. Always prepare fresh from a concentrated stock according to the protocol.
- Substrate Incubation: Develop the substrate for the recommended time only, protected from light. Stop the reaction exactly as specified.
- Troubleshooting Steps:
FAQ 4: My replicate CVs are high for unknowns but low for standards. What does this indicate?
- Answer: This specific problem often points to issues with the unknown sample itself or its handling, rather than a global assay failure.
- Diagnosis and Protocol:
- Sample Homogeneity: Vortex or mix all unknown samples thoroughly before pipetting to ensure a uniform solution. Centrifuge if necessary to remove particulates.
- Matrix Effects: The sample matrix (e.g., serum, cell lysate) can interfere. Protocol: Perform a spike-and-recovery experiment.
- Spike a known amount of the target analyte into the sample matrix at multiple levels.
- Run the assay and interpolate the concentration of the spiked samples.
- Calculate % Recovery = (Measured Concentration – Endogenous Concentration) / Spiked Concentration * 100.
- Acceptable recovery is typically 80-120%. Poor recovery mandates sample dilution or matrix-specific standard preparation.
- Pipetting Low Volumes: If sample volume is small (< 10 µL), pipetting error dominates. Use calibrated, low-volume pipettes and consider pre-diluting the sample to allow for a larger volume to be added to the well.
- Diagnosis and Protocol:
Data Presentation
Table 1: Impact of Standard Curve Fit Quality on Unknown Sample Precision
| Curve Fit R² Value | Interpolation Error (Typical Range) | Resultant CV for Unknown Replicates | Suitability for Analysis |
|---|---|---|---|
| ≥ 0.995 | < 5% | Low (< 10%) | Excellent; proceed. |
| 0.990 - 0.994 | 5% - 10% | Moderate (10% - 15%) | Acceptable for screening; suboptimal for precise quantitation. |
| < 0.990 | > 10% | High (> 15%) | Unacceptable. Investigate and repeat assay. |
Table 2: Results of a Spike-and-Recovery Experiment for Matrix Effect Diagnosis
| Sample Matrix | Spike Level (ng/mL) | Expected Conc. (ng/mL) | Measured Conc. (ng/mL) | % Recovery | Conclusion |
|---|---|---|---|---|---|
| Assay Buffer (Control) | 10.0 | 10.0 | 9.8 | 98% | No matrix effect in buffer. |
| Undiluted Serum | 10.0 | ~12.5* | 8.2 | 66% | Strong interference. Requires dilution. |
| Serum (1:4 Dilution) | 10.0 | ~10.3* | 9.9 | 96% | Interference eliminated. |
*Assumes endogenous level of ~2.5 ng/mL.
Experimental Protocols
Protocol: Accurate Serial Dilution for Standard Curve Preparation
- Preparation: Pre-label sufficient tubes for all standard points. Fill a tube with the recommended volume of assay diluent for the top standard.
- Reconstitution/Stock: Reconstitute the standard according to the datasheet. Vortex thoroughly to ensure a homogeneous stock solution.
- First Point (Top Standard): Pipette the calculated volume of stock solution into the first tube of diluent. Vortex mix thoroughly.
- Serial Dilution: Pipette the calculated volume from the first standard tube into the next tube containing diluent. Change pipette tips after every transfer. Vortex the new dilution thoroughly. Repeat this process down the required concentration range.
- Plate Layout: Pipette standards and samples into the designated wells in duplicate or triplicate, as per the experimental design.
Protocol: Mandatory Steps for Validating Curve Fit Before Sample Interpolation
- Plot the Mean Absorbance (y) vs. Concentration (x) for standards.
- Apply the recommended regression model (e.g., 4PL).
- Inspect the R² or Sum of Squared Errors. Acceptance Criterion: R² ≥ 0.99.
- Visually inspect the curve. The points should be evenly distributed along the sigmoidal shape, with no systematic deviation at the upper or lower asymptotes.
- Back-calculate Standards: Use the fitted curve to interpolate the concentration of each standard from its absorbance. Calculate the % accuracy relative to the expected value. Acceptance Criterion: Typically within 15-20% of expected for LLOQ/ULOQ, within 10-15% for others.
The Scientist's Toolkit
Table 3: Key Research Reagent Solutions for ELISA Standard Curves
| Item | Function & Importance for Curve Quality |
|---|---|
| Primary Standard | Highly purified analyte of known concentration. Defines the accuracy of the entire assay. Must be traceable to a reference material. |
| Assay Diluent (Matrix-Matched) | The buffer used to dilute the standard and samples. Should closely match the sample matrix (e.g., contains BSA, serum proteins) to minimize matrix effects. |
| High-Precision Microplates | Plates with low protein binding and high well-to-well uniformity to ensure consistent optical density (OD) readings. |
| Calibrated, Positive-Displacement Pipettes | Essential for accurate, reproducible transfer of standards, especially during serial dilution and for viscous samples. |
| 4PL/5PL Curve Fitting Software | Dedicated analysis software (e.g., built into plate readers, GraphPad Prism, MyAssays) that correctly handles the non-linear sigmoidal response of ELISA data. |
Mandatory Visualizations
Title: Serial Dilution Workflow for Standard Preparation
Title: Logical Troubleshooting Path for Poor ELISA Replicates
ELISA Troubleshooting Workflow: Diagnosing and Fixing High CVs Step-by-Step
Technical Support Center: Troubleshooting ELISA Poor Replicate Data
Troubleshooting Guides & FAQs
Q1: My ELISA data shows high variation between replicates (high CV%). What are the first steps I should take? A1: Begin by constructing a Levey-Jennings (Control) Chart for your assay controls (Positive, Negative). Plot the mean optical density (OD) of replicates for the same control across multiple plates/runs. Calculate the mean (central line) and ±2SD and ±3SD control limits. Points outside ±2SD (warning) or ±3SD (action) limits indicate instability. High replicate CV% within a single plate often points to pipetting error, uneven washing, or inconsistent incubation conditions.
Q2: What specific patterns in a control chart should I look for, and what do they indicate? A2: Systematic patterns, not just out-of-range points, are critical diagnostic tools.
- Shift: Six or more consecutive points on one side of the mean. Indicates a sudden change in process, e.g., new reagent lot, calibrator, or instrument recalibration.
- Trend: Six or more consecutive points increasing or decreasing. Suggests gradual degradation, such as reagent decay, declining enzyme conjugate activity, or progressive instrument drift.
- Cyclical Pattern: Recurring up-and-down waves. Points to environmental factors like laboratory temperature/humidity cycles or equipment maintenance schedules.
Q3: My standard curve replicates are tight, but my sample replicates are poor. What does this mean? A3: This isolates the error source to sample handling after the point of addition to the plate. Likely causes are:
- Inconsistent Sample Pre-treatment: Inadequate mixing of thawed samples, presence of bubbles, or uneven centrifugation.
- Matrix Effects: Variable sample matrices (e.g., serum vs. plasma, different hemolysis levels) interfering inconsistently.
- Plate Edge Effects: Samples on the outer wells experiencing different evaporation/thermal rates. Use a randomized plate layout to diagnose.
Q4: How can I determine if the error is from the assay protocol or the plate reader? A4: Perform a Plate Reader Precision Test.
- Protocol: Fill a 96-well plate with a single, homogeneous chromogen solution (e.g., TMB). Read the plate at your assay wavelength (e.g., 450nm) five times in succession, without moving the plate.
- Analysis: Calculate the CV% for each well across the five reads. A high CV% for a specific well indicates a reader or plate alignment issue. Low intra-well CV% but high variation across the plate indicates a dispensing or plate manufacturing problem.
Q5: How do I use pattern analysis to differentiate between random and systematic error in replicate data? A5: Apply the Westgard Rules to your replicate means or control values.
| Rule Pattern | Description | Implied Error Type & Common Source |
|---|---|---|
| 1₂₈ | One point outside ±3SD limit. | Random error (e.g., bubble in well, sporadic pipette fault). |
| 2₂₈ | Two consecutive points outside ±2SD limit (same side). | Systematic shift (e.g., new washing buffer, changed incubation time). |
| R₄₈ | Range between two consecutive points >4SD. | High random error or within-run instability (e.g., temperature gradient during incubation). |
| 4₁₈ | Four consecutive points outside ±1SD limit (same side). | Progressive systematic trend (e.g., reagent degradation during run). |
Experimental Protocols for Error Diagnosis
Protocol 1: Pipette Calibration & Precision Test (Gravimetric)
- Purpose: Verify pipette accuracy and precision as a source of replicate variation.
- Materials: Analytical balance (0.01mg sensitivity), distilled water, microcentrifuge tubes, temperature & humidity log.
- Method:
- Condition water and tubes to lab ambient temperature for 2 hours.
- Weigh an empty, dry tube. Tare the balance.
- Using the pipette in question, dispense water (use volume critical to your ELISA, e.g., 50µL or 100µL) into the tube. Record weight.
- Repeat for n=10 replicates.
- Calculate mean, SD, CV%, and accuracy (% deviation from expected weight).
- Acceptance: For volumes ≤100µL, CV% should be <2-3%. High CV% mandates pipette servicing.
Protocol 2: Intra-Assay (Within-Plate) Replicate Variation Analysis
- Purpose: Quantify and localize variability within a single ELISA run.
- Method:
- Design a plate layout where 8-10 identical samples (a pool) are randomly distributed across the plate, including edges and center.
- Run the ELISA following standard protocol.
- For each replicate, calculate the concentration from the standard curve.
- Calculate the overall mean, SD, and CV% for the pooled sample replicates.
- Spatial Analysis: Plot replicate values vs. well position. Cluster high/low values in a zone (e.g., top-left) indicates a washing or dispensing gradient.
Table 1: Quantitative Impact of Common Errors on ELISA Replicate CV%
| Error Source | Typical Increase in Replicate CV% | Diagnostic Control Chart Pattern | Corrective Action |
|---|---|---|---|
| Pipetting Inaccuracy | 5% - 15%+ | Increased random scatter; Rule 1₃₈ violations. | Calibrate pipettes; use reverse pipetting for viscous liquids. |
| Inconsistent Washing | 8% - 25%+ | Row/column-specific trends or shifts. | Validate washer nozzles for clogging; ensure consistent soak time. |
| Edge Evaporation | 10% - 30% (edge vs. center) | Cyclical or zone-based patterns. | Use plate sealers; incubate in humidified chamber. |
| Variable Incubation Time/Temp | 10% - 20%+ | Plate-to-plate shifts or global trends. | Use calibrated timers & thermostatic incubators. |
| Plate Reader Well Alignment | 3% - 10%+ | Consistent high/low values for specific well positions. | Perform plate reader precision test; service reader. |
The Scientist's Toolkit: Research Reagent Solutions
Table 2: Essential Materials for ELISA Robustness & Troubleshooting
| Item | Function & Relevance to Replicate Quality |
|---|---|
| Calibrated, Positive-Displacement Pipettes | Essential for accurate, consistent dispensing of standards and samples. Reduces random volumetric error. |
| Monodisperse, Low-Binding Pipette Tips | Ensures each dispensed volume is identical and minimizes analyte/reagent adsorption. |
| Multichannel Pipette with Matrix | Critical for even reagent addition across all wells simultaneously, reducing row-wise variation. |
| Validated Plate Washer & Calibrated Manifold | Ensures complete, uniform washing to reduce background and non-specific binding variation. |
| Humidified, Thermostatic Plate Incubator | Maintains constant temperature and humidity to prevent edge effects and incubation time drift. |
| Pre-Titered, Master Lot Reagent Kits | Using a single, large lot of capture/detection antibodies, conjugate, and substrate minimizes inter-run shifts. |
| Lyophilized or Ready-to-Use Control Panels | Provides stable, consistent targets for constructing control charts across runs. |
| Microplate Reader with Dual Wavelengths | Allows reference wavelength subtraction (e.g., 570nm or 620nm) to correct for optical imperfections in plate or bubbles. |
Diagnostic Workflow & Logical Diagrams
Title: ELISA Replicate Error Diagnostic Decision Tree
Title: Key Control Chart Patterns for ELISA Error Diagnosis
Technical Support Center: Troubleshooting ELISA Replicate Variability
FAQs & Troubleshooting Guides
Q1: What are the primary causes of "edge effects" leading to poor inter-well consistency in my ELISA plate? A: Edge effects are systematic errors where wells on the perimeter of a microplate exhibit significantly different signal intensities compared to interior wells. Primary causes include:
- Non-uniform evaporation: Outer wells lose more moisture due to greater exposure, concentrating reagents and increasing absorbance.
- Temperature gradients: During incubation, outer wells equilibrate to incubator temperature faster than interior wells.
- Inconsistent washing: Automated plate washers may apply different pressure or volume to edge wells.
Q2: How does evaporation specifically contribute to inter-well inconsistency, and which steps are most critical to control? A: Evaporation alters reagent concentration, reaction kinetics, and background signal. The most critical steps are the coating, blocking, and sample/antibody incubation steps, which are typically long (1-2 hours to overnight). Evaporation is exacerbated by high temperatures, low humidity, and lack of plate sealing.
Q3: What are proven strategies to physically minimize edge effects during assay setup and incubation? A:
- Use a pre-warmed, humidified incubator.
- Employ a physical plate sealer (non-breathable adhesive seal) over the plate rather than a lid.
- "Sacrificial perimeter" technique: Fill all perimeter wells with buffer or a dummy sample, leaving them out of the experimental analysis.
- Ensure plates are not stacked during incubation to allow for uniform heat transfer.
- Utilize a water bath or sealed container with wet towels inside the incubator to maintain local humidity.
Q4: Are there data normalization or analytical techniques to correct for edge effects post-assay? A: Yes, if edge effects are consistent across plates, you can apply correction factors. A common method is to use control wells distributed across the plate (e.g., high, low, blank) to model the spatial variation and adjust sample ODs accordingly. However, prevention is always superior to correction.
Key Experimental Protocols for Diagnosis & Mitigation
Protocol 1: Diagnosing Edge Effects via Uniform Signal Test Objective: To map systematic spatial variability across a microplate. Method:
- Prepare a homogeneous solution of your ELISA detection system (e.g., TMB substrate mixed with a stop solution at a fixed ratio to yield a medium absorbance).
- Pipette an identical volume of this solution into every well of the microplate.
- Read the plate immediately at the appropriate wavelengths (e.g., 450nm and 540nm or 570nm reference).
- Analyze the absorbance values spatially. Calculate the coefficient of variation (CV) for the entire plate, then separately for edge wells and interior wells.
Protocol 2: Humidity Chamber Incubation Protocol Objective: To minimize evaporation during long incubation steps. Materials: Microplate, adhesive plate sealers, plastic container with lid, paper towels. Method:
- Soak several folded paper towels in distilled water and place them at the bottom of the plastic container.
- After adding reagents to your assay plate, apply a non-breathable adhesive plate sealer. Ensure it is firmly pressed around all edges.
- Place the sealed plate inside the container on a raised platform (e.g., an empty pipette tip box lid) to prevent direct contact with the wet towels.
- Close the container lid and place it in your standard incubator or on a benchtop shaker.
- Proceed with incubation as usual.
Data Presentation
Table 1: Impact of Mitigation Strategies on Inter-Well CV% in a Model ELISA Data simulated from current best practice literature and technical notes.
| Mitigation Strategy Applied | Average CV% (Full Plate) | CV% (Edge Wells) | CV% (Interior Wells) |
|---|---|---|---|
| No Mitigation (Lid only) | 15.2% | 25.8% | 8.5% |
| Adhesive Plate Seal | 9.8% | 14.3% | 7.1% |
| Humidity Chamber | 7.5% | 9.1% | 6.8% |
| Sacrificial Perimeter + Seal | 6.1% | Excluded | 6.1% |
| Combined (Seal + Chamber + Perimeter) | 4.7% | Excluded | 4.7% |
Visualizations
Title: Root Causes and Consequences of ELISA Edge Effects
Title: ELISA Workflow with Edge Effect Mitigation Steps
The Scientist's Toolkit: Key Reagent & Material Solutions
| Item | Function in Minimizing Inconsistency |
|---|---|
| Non-Breathable Adhesive Plate Seals | Creates a vapor barrier to prevent evaporation during incubation. Superior to loose-fitting lids. |
| Humidity Chamber (Container + Wet Towels) | Maintains localized 100% humidity around the plate, eliminating differential evaporation. |
| Pre-warmed Assay Diluents/Buffers | Reduces temperature gradients when added to the plate, ensuring even reaction start times. |
| Automated Plate Washer with Calibrated Height | Ensures consistent wash buffer delivery and aspiration across all wells, especially edges. |
| Pre-coated, Quality-Assured ELISA Plates | Plates from reputable suppliers undergo QC for uniform binding capacity across all wells. |
| Multichannel or Automated Liquid Handler | Reduces pipetting variability and setup time, decreasing the window for pre-incubation evaporation. |
Inconsistent ELISA data, particularly poor replicate agreement, is a major hurdle in research and drug development. A primary, often overlooked, source of this variance is the instability of reagents and significant differences between manufacturing lots. This technical support center provides targeted guidance for implementing robust quality checks on new reagent shipments to ensure data integrity within your ELISA workflows.
Troubleshooting Guides & FAQs
Q1: Our new batch of capture antibody gives a significantly lower signal than the previous lot. What should we do? A: This indicates potential lot-to-lot variability in antibody affinity or concentration.
- Action: Perform a side-by-side checkerboard titration with the old and new lots against a standard antigen sample. This will identify the optimal new dilution and confirm if the dynamic range has shifted.
- Protocol: Checkerboard Titration for Capture Antibody
- Coat two plates simultaneously. For each plate, prepare serial dilutions of the old and new capture antibodies (e.g., from 10 µg/mL to 0.1 µg/mL) in coating buffer.
- Add 100 µL of each dilution to separate wells across the plate. Incubate overnight at 4°C.
- Block both plates identically.
- Apply your standard antigen control (in triplicate) at a mid-range concentration, alongside a blank.
- Continue with your standard detection protocol.
- Compare the signal intensity and background between lots at each concentration to recalibrate.
Q2: We observed high CVs (>20%) between replicates after switching to a new TMB substrate. Could it be unstable? A: Yes. Chromogenic substrates like TMB are sensitive to light, temperature, and oxidation, leading to inconsistent development.
- Action: Test the new substrate's performance and stability.
- Protocol: TMB Substrate Quality Control
- Freshness Test: Use a positive control sample (e.g., known concentration of target) and your standard protocol. Develop with the new TMB for exactly the same time as the old. Compare the slope of the standard curve's linear region.
- Stability Stress Test: Aliquot the new TMB. Expose one aliquot to ambient light for 1 hour. Keep another at 4°C, and a third at room temperature in the dark. Test all aliquots simultaneously on the same plate with the same positive control. A significant drop in signal from the stressed aliquots indicates instability.
Q3: How can we systematically validate a new critical reagent lot before full-scale use? A: Implement a tiered validation protocol comparing the new lot (N) to the expiring, validated lot (O).
- Protocol: Tiered Reagent Lot Validation
- Tier 1 - Parallel Testing: Run a full standard curve and 3 QC samples (low, mid, high concentration) in triplicate on the same plate using lots N and O for all reagents. Calculate percent difference for key parameters (EC50, OD max, QC sample recovery).
- Tier 2 - Precision Profile: Using the optimal concentration from Tier 1, run at least 10 replicates of the mid-level QC sample across multiple wells to assess intra-assay precision for lot N.
- Tier 3 - Long-term Performance: Monitor the signal from frozen aliquots of your QC samples over multiple runs to assess inter-assay precision with the new lot.
Table 1: Acceptable Ranges for Lot-to-Lot Comparison of ELISA Critical Reagents
| Reagent | Key Parameter | Acceptable Variation (New vs. Old Lot) |
|---|---|---|
| Coating Antibody | EC50 of Standard Curve | ≤ 25% Shift |
| Detection Antibody | Max OD Signal (Saturation) | ≤ 20% Difference |
| Conjugate (HRP, etc.) | Signal-to-Noise Ratio | ≤ 15% Reduction |
| Reference Standard | Calculated Potency | 80% - 125% |
| TMB Substrate | Development Kinetics (Time to saturation) | ≤ 30% Difference |
Table 2: Common Reagent Stability Profiles & Storage Guidelines
| Reagent | Primary Stability Risk | Recommended Storage | Shelf-life Post-Opening |
|---|---|---|---|
| Coated Plates | Desiccation, Humidity | Sealed bag with desiccant, 4°C | 4 weeks |
| Lyophilized Antibodies | Moisture | -20°C or below in desiccator | Stable until reconstitution |
| Reconstituted Proteins | Microbial growth, aggregation | Aliquot, store at -80°C | Avoid freeze-thaw; use aliquots |
| Enzyme Conjugates | Activity loss, aggregation | Aliquot, 4°C (do not freeze) | 6 months (check activity monthly) |
| TMB Substrate | Light oxidation, contamination | 4°C in dark glass or foil-wrapped | 3 months |
The Scientist's Toolkit: Essential Reagent QC Materials
| Item | Function in QC |
|---|---|
| Stable, In-House QC Sample | A frozen aliquot pool of natural or spiked sample serving as a longitudinal performance monitor across reagent lots. |
| Internally Validated Reference Standard | A well-characterized protein standard for generating the calibration curve; critical for comparing assay sensitivity between lots. |
| Single-Donor Serum/Matrix | Consistent negative control matrix for assessing non-specific binding changes with new antibody lots. |
| Pre-Coated Validation Plates | Plates from the previous, performing lot saved specifically for side-by-side comparison testing. |
| Calibrated Digital Piper | Ensures accurate and precise reagent dispensing, removing pipetting error from variance analysis. |
| Microplate Reader Maintenance Kit | Regular lens cleaning and calibration ensure optical variance is not mistaken for reagent variance. |
Visualizations
Diagram 1: ELISA Reagent Lot QC Decision Workflow
Diagram 2: Primary Causes of Poor ELISA Replicate Data
Technical Support Center
Troubleshooting Guides
Issue: High CVs (%) in ELISA replicate absorbances. Question: My ELISA plate shows high variation between replicate wells. Could inconsistent incubation temperature be the cause? Answer: Yes, temperature gradients across a microplate incubator are a leading cause of poor replicate data. A variation of just 1-2°C can significantly alter antibody binding kinetics, leading to variable signal development. Verify uniformity by placing independent temperature loggers in the front, center, and back wells of the incubator (with plate lid on). Acceptable uniformity is ≤0.5°C across the working area.
Issue: Inconsistent development at the plate edges. Question: Wells at the edges of my plate develop differently from those in the center. What is the primary factor? Answer: This "edge effect" is most commonly due to evaporative loss in edge wells during long incubations (e.g., overnight coating or sample incubation). This increases analyte and antibody concentrations, falsely elevating absorbance. Ensure the incubator maintains ≥80% relative humidity and always use a sealed, humidified chamber or plate sealer films for >1 hour incubations.
Question: My standard curve is erratic, but my samples appear consistent. Is shaking a factor? Answer: Absolutely. Inconsistent orbital shaking during incubation steps leads to uneven ligand binding. This is most critical for the capture antibody coating, capture of analyte, and enzyme-conjugate binding steps. An orbital diameter of 3-5 mm and a speed of 500-700 rpm is typical for 96-well plates. Ensure the shaker platform is level.
Frequently Asked Questions (FAQs)
Q1: What is the ideal temperature uniformity specification for an ELISA plate incubator? A1: For optimal replicate precision, the temperature uniformity across the entire plate should be within ±0.5°C of the setpoint. Studies show a 1°C increase can accelerate some antibody-antigen reaction rates by over 10%.
Q2: How do I properly humidify an incubator for ELISA steps? A2: Use a dedicated humidity pan filled with sterile water or a saturated salt solution (e.g., KCl for 80-85% RH). Place it in the incubator at least 1 hour prior to use to equilibrate. The plate should be placed in a sealed container or on a tray alongside, but not directly over, the water pan to avoid condensation on the plate seal.
Q3: Should I shake the plate during all incubation steps? A3: Best practice is to use orbital shaking for all liquid incubation steps (coating, blocking, sample, conjugate) but not during the final TMB substrate development step if stopping the reaction with acid. Shaking during development can increase variability.
Q4: How does poor shaking affect my data? A4: Insufficient shaking leads to concentration gradients within wells and increased intra-assay variation (high CVs). It reduces the effective interaction of analytes and antibodies, potentially causing a lower overall signal (shifted standard curve) and loss of sensitivity.
Table 1: Impact of Incubation Parameters on ELISA Replicate CV%
| Parameter | Optimal Condition | Sub-Optimal Condition | Observed Intra-Assay CV Increase | Key Effect |
|---|---|---|---|---|
| Temperature Uniformity | ≤ ±0.5°C across plate | Gradient of >2°C | 5% → 15%+ | Alters binding kinetics non-uniformly |
| Relative Humidity | ≥80% (for >1hr steps) | <50% (dry incubator) | 7% → 25% (edge wells) | Evaporative concentration, edge effects |
| Orbital Shaking | 500-700 rpm, 3-5mm orbit | Static (0 rpm) | 6% → 20%+ | Creates concentration gradients in well |
Table 2: Recommended Conditions for Key ELISA Incubation Steps
| Assay Step | Recommended Temp (°C) | Recommended Time | Shaking? (500-700 rpm) | Humidity Critical? |
|---|---|---|---|---|
| Coating | 4 (or 22-25) | Overnight (or 2h) | Optional (often static) | Yes, if >1 hour |
| Blocking | 22-25 | 1-2 hours | Yes | Recommended |
| Sample/Antibody Incubation | 22-25 or 37* | 1-2 hours | Yes | Yes |
| Conjugate Incubation | 22-25 | 30 min - 1 hour | Yes | Yes |
| Substrate Development | 22-25 | 5-30 min | No | No |
Dependent on protocol specificity. *Shaking during development can increase noise.
Experimental Protocols
Protocol 1: Validating Incubator Temperature Uniformity for ELISA
- Materials: Multi-channel pipette, 96-well plate, plate seal, 3-6 independent calibrated temperature data loggers (small enough to fit in a well), water bath or benchtop incubator as reference.
- Procedure: a. Pre-warm the incubator to the standard ELISA incubation temperature (e.g., 37°C) for at least 2 hours. b. Fill all wells of the plate with 200 µL of PBS to simulate assay conditions. c. Place temperature loggers in wells A1 (front-left), D6 (center), and H12 (back-right). Cover with the plate lid and a plate seal. d. Place the plate in the center of the incubator shelf and start loggers to record temperature every minute for 60 minutes. e. Retrieve loggers and download data. Calculate the mean temperature and standard deviation for each position over the stable period (last 45 mins). f. The maximum difference between any two logger means should be ≤0.5°C.
Protocol 2: Assessing Impact of Humidity on Edge Effects
- Materials: Two identical ELISA plates, coating antigen, assay diluent, standard TMB substrate, plate reader, two identical incubators (one with humidity pan, one dry).
- Procedure: a. Coat both plates identically with the same antigen concentration overnight at 4°C (humidified chamber). b. Block both plates simultaneously. c. Add identical standard curve dilutions to both plates. d. Incubate Plate A in a humidified incubator (≥80% RH) at 37°C for 2 hours. Incubate Plate B in a dry incubator (<40% RH) under otherwise identical conditions. Both plates must use the same plate sealer. e. Complete the assay identically for both plates (washes, conjugate, development). f. Compare the standard curves and the CVs of replicates, particularly focusing on the outer perimeter wells (rows A and H, columns 1 and 12). Elevated absorbances in edge wells of Plate B indicate evaporative loss.
Diagrams
Title: Root Causes of High ELISA CV%
Title: ELISA Incubation Steps & Key Conditions
The Scientist's Toolkit: Essential Reagent Solutions
Table 3: Key Research Reagent Solutions for Optimized ELISA
| Item | Function in ELISA | Key Consideration for Replicate Consistency |
|---|---|---|
| Carbonate/Bicarbonate Coating Buffer (pH 9.6) | Optimal pH for passive adsorption of proteins to polystyrene plate. | Freshly prepared; pH checked to ensure consistent coating efficiency. |
| PBS-T (Phosphate Buffered Saline with 0.05% Tween 20) | Standard wash and diluent buffer. Tween detergents reduce non-specific binding. | Filter-sterilized to prevent particulates; consistent Tween concentration is critical. |
| Blocking Buffer (e.g., 1-5% BSA or Non-Fat Dry Milk in PBS-T) | Covers unoccupied protein-binding sites to reduce background noise. | High-quality, low-impurity protein source. Must be compatible with all assay components. |
| TMB (3,3',5,5'-Tetramethylbenzidine) Substrate | Colorimetric HRP enzyme substrate. Turns blue upon oxidation. | Must be colorless prior to use; protect from light; use consistent incubation time. |
| Stop Solution (e.g., 1M H2SO4 or HCl) | Halts the enzymatic reaction, turning TMB from blue to yellow for reading at 450nm. | Precise, consistent volume added (e.g., 50µL per 100µL TMB). High concentration ensures immediate, full stop. |
| Plate Sealer Films (Adhesive or Thermal) | Prevents evaporation and contamination during incubations. | Use seals rated for the incubation temperature. Ensure a complete, wrinkle-free seal. |
Topic: Signal Saturation and Hook Effect: Identifying Non-Linear Regions of the Standard Curve.
Troubleshooting Guides & FAQs
Q1: My high-concentration standard replicates show poor agreement, while low-concentration replicates are fine. Is this the hook effect? A: Not necessarily. While the hook effect (prozone effect) can cause signal decrease at very high analyte concentrations, poor replicates at high ends more commonly indicate signal saturation. The detector (e.g., plate reader) reaches its maximum output, causing a plateau where small pipetting errors cause large apparent %CV. First, check if your highest standards are in the plateau region of the curve.
Q2: How can I experimentally distinguish between signal saturation and the hook effect? A: Perform a sample dilution series. If the measured concentration increases upon dilution, you are likely in the hook effect zone. If the measured concentration remains constant or decreases only slightly upon dilution, you are likely in the saturation plateau. See Protocol 1 below.
Q3: My standard curve has a good R² value but my high-concentration QC samples are out of range. What should I do? A: A high R² can be misleading if the model is forced through a non-linear region. Re-plot your data on a linear scale. Visually identify where the curve deviates from linearity and exclude standards beyond that point when fitting your model. The usable range is only the linear portion.
Q4: What are the critical assay parameters that influence saturation and hook effect? A: Key parameters are incubation time, detection antibody/enzyme conjugate concentration, and substrate development time. Excessively long incubations or high conjugate concentrations accelerate saturation and can mask the hook effect by pushing it to extremely high concentrations.
Experimental Protocols
Protocol 1: Identifying the Upper Limit of Quantification (ULOQ) and Hook Effect
- Prepare the standard curve per kit instructions.
- Additionally, prepare a "high-concentration spike" at 5-10x the top standard concentration.
- Run the assay. Generate the standard curve using all points.
- Perform a 1:10 and 1:100 serial dilution of the high-concentration spike. Re-assay these dilutions.
- Analysis: Plot all measured values (including dilutions) against their expected concentration on a log-log graph. The ULOQ is the highest point where the diluted samples fall on the curve. A hook effect is confirmed if the undiluted high spike reads lower than its dilutions.
Protocol 2: Optimizing Detection Incubation to Widen Dynamic Range
- Plate your highest standard in replicates of 8.
- After adding detection antibody/conjugate, stop the reaction for 4 of the replicates at 50%, 75%, 100%, and 125% of the recommended incubation time (e.g., at 30, 45, 60, 75 mins for a 60-min rec).
- Complete the assay. Plot mean signal vs. time for this high standard.
- The optimal incubation time is just before the signal vs. time plot plateaus for your highest standard, maximizing signal while avoiding saturation.
Table 1: Impact of Detection Incubation Time on Signal Saturation
| Standard Concentration (pg/mL) | Signal at 30 min (OD) | Signal at 60 min (OD) | Signal at 90 min (OD) | %CV at 90 min |
|---|---|---|---|---|
| 1000 | 1.20 | 2.35 | 2.80 | 5.2 |
| 5000 | 2.10 | 3.95 | 4.10 | 15.8 |
| 10000 | 2.95 | 4.02 | 4.15 | 22.5 |
Note: Saturation occurs between 60-90 min for high concentrations, leading to increased %CV.
Table 2: Sample Dilution Test to Diagnose Hook Effect
| Sample ID | Nominal Conc. (ng/mL) | Measured Conc. (Undiluted) | Measured Conc. (1:10 Dilution) | Inferred True Conc. |
|---|---|---|---|---|
| Patient A | Unknown | 8.5 ng/mL | 45.2 ng/mL | ~45.2 ng/mL |
| Patient B | Unknown | 125.0 ng/mL | 118.0 ng/mL | ~125.0 ng/mL |
Result: Patient A shows a hook effect (conc. increases upon dilution). Patient B shows saturation (conc. is consistent).
Visualizations
Title: Troubleshooting High Concentration Replicate Issues
Title: Mechanism of the Hook (Prozone) Effect in Sandwich ELISA
The Scientist's Toolkit: Key Research Reagent Solutions
| Item | Function & Relevance to Saturation/Hook Effect |
|---|---|
| High-Sensitivity TMB Substrate | A chromogenic substrate with a low Km. Allows shorter development times before saturation, helping to extend the linear range. |
| Pre-Diluted Albumin Standards | Precisely diluted BSA or HSA protein standards. Critical for creating accurate, high-concentration spike controls to test for the hook effect. |
| Matrix-Buffered Calibrator Diluent | A diluent matching the sample matrix (e.g., serum, cell lysate). Essential for performing valid serial dilutions to investigate saturation/hook without introducing matrix artifacts. |
| Stable Stop Solution (e.g., 2N H₂SO₄) | A consistent, strong acid to rapidly halt enzymatic reaction. Ensures development time is identical across all wells, critical for reproducibility in the saturation zone. |
| Multichannel Pipette & Low-Binding Tips | Enables simultaneous processing of replicate standard and sample dilution series. Minimizes time-based variation and analyte adhesion, reducing error in high-concentration replicates. |
Troubleshooting Guides & FAQs
Q1: My ELISA shows consistently high background across all wells, including blanks. What are the primary causes and how can I resolve this? A1: High universal background often stems from non-specific binding (NSB). Key steps include:
- Increase Blocking: Extend blocking time to 2 hours at room temperature or use a more robust blocking buffer (e.g., 5% BSA or casein in PBS instead of 1%).
- Optimize Wash Stringency: Increase the number of washes (e.g., from 3 to 5) and add a mild detergent (e.g., 0.05% Tween-20) if not already present. Ensure sufficient wash volume to cover the well.
- Check Antibody Concentration: Titrate your detection antibody. Excessive antibody leads to NSB.
- Assess Sample Matrix: Test your sample diluent in blank wells. Hemolyzed, lipemic, or highly protein-rich samples require additional dilution or pre-treatment.
Q2: How do I distinguish between true signal and background noise in samples with low analyte concentration? A2: Implement a rigorous background subtraction protocol:
- Use Multiple Controls: Include (a) reagent blanks (all components except sample/analyte), (b) sample blanks (sample with detection system omitted or replaced with isotype control), and (c) plate blanks (only substrate).
- Subtract Correctly: Subtract the sample blank value from the corresponding sample read. The reagent blank is used for plate acceptance criteria (typically O.D. < 0.1).
- Statistical Threshold: Calculate the Limit of Detection (LOD) as mean background + 3SD of the blank. Signals below this are indistinguishable from noise.
Q3: My replicates have high CVs (>20%), and I suspect uneven binding. What procedural errors should I investigate? A3: High inter-replicate CV indicates procedural inconsistency. Focus on:
- Pipetting Technique: Calibrate pipettes and use reverse pipetting for viscous samples or reagents.
- Washing Consistency: Use an automated plate washer for uniformity. If washing manually, ensure consistent aspiration and decanting rhythm.
- Incubation Conditions: Prevent plate edge effects by using a humidified chamber and ensuring the plate is perfectly level during all incubations.
- Reagent Temperature: Bring all reagents and samples to a consistent temperature (typically room temp) before starting to prevent condensation and uneven binding.
Q4: What advanced techniques can correct for non-specific binding in complex samples like serum or cell lysates? A4:
- Heterophilic Antibody Blocking: Add 1-2% normal serum from the same species as the detection antibody, or commercial blocking agents (e.g., Heteroblock), to the diluent.
- Sample Pre-Treatment: For serum, use protein A/G spin columns to remove interfering immunoglobulins. For lysates, increase centrifugation speed/time to remove particulates.
- Use a Matched Matrix: Prepare your standard curve in a diluted, analyte-free matrix that matches your samples (e.g., charcoal-stripped serum).
Key Data Tables
Table 1: Impact of Blocking Buffer Composition on Background O.D. (450 nm)
| Blocking Buffer | Mean Blank O.D. | Signal (10 pg/mL) O.D. | Signal-to-Background Ratio |
|---|---|---|---|
| 1% BSA/PBS | 0.15 | 0.45 | 3.0 |
| 5% BSA/PBS | 0.08 | 0.48 | 6.0 |
| 5% Non-Fat Dry Milk | 0.07 | 0.42 | 6.0 |
| Commercial Protein-Free Block | 0.05 | 0.50 | 10.0 |
Table 2: Effect of Wash Stringency on Non-Specific Binding
| Wash Buffer | # of Washes | NSB (High Protein Spike) O.D. | Specific Signal O.D. | % CV of Replicates |
|---|---|---|---|---|
| PBS | 3 | 0.25 | 1.10 | 15% |
| PBS + 0.05% Tween-20 | 3 | 0.12 | 1.05 | 12% |
| PBS + 0.05% Tween-20 | 5 | 0.08 | 1.02 | 8% |
Experimental Protocols
Protocol: Sample Pre-Treatment for Problematic Serum Samples Objective: Reduce heterophilic antibody interference and matrix effects.
- Dilute serum sample 1:10 in assay buffer.
- Add 10 µg/mL of a commercial heterophilic blocking reagent.
- Incubate the mixture at room temperature for 60 minutes with gentle agitation.
- Proceed with the standard ELISA protocol using this pre-treated dilution.
- Critical: Prepare the standard curve in an identical buffer containing the same concentration of blocking reagent and diluted, analyte-free serum.
Protocol: Validation of Signal Specificity via Antibody Competition Objective: Confirm that observed signal is specific to the target analyte.
- Set up duplicate wells for a positive sample and a high-concentration standard.
- To the experimental well, add the sample/standard mixed with the capture antibody (at 10x the working concentration).
- To the control well, add the sample/standard mixed with an isotype control antibody (at 10x concentration).
- Incubate for 30 minutes at RT before adding to the pre-coated plate.
- Run the full ELISA. Specific signal should be reduced by >70% in the capture antibody-competed well compared to the isotype control well.
Visualizations
Title: Standard ELISA Protocol with Critical Wash Steps
Title: Primary Causes of Non-Specific Binding in ELISA
The Scientist's Toolkit: Research Reagent Solutions
| Item | Function & Rationale |
|---|---|
| High-Purity BSA or Casein | Inert proteins used in blocking buffers (3-5% concentration) to cover unoccupied binding sites on the plate and detection components, minimizing NSB. |
| Commercial Protein-Free Blockers | Synthetic polymer-based blocking agents designed for challenging samples; often more effective than protein blocks at reducing NSB from heterophilic antibodies. |
| Heterophilic Blocking Reagent | A mixture of non-specific immunoglobulins or specific inhibitors added to sample diluent to neutralize interfering human anti-animal antibodies. |
| Tween-20 (Polysorbate 20) | A non-ionic detergent (used at 0.01-0.05% in wash buffer) that reduces hydrophobic interactions, improving wash stringency and lowering background. |
| Normal Serum | Serum from the species of the detection antibody (e.g., goat serum), used at 1-10% to saturate non-specific sites and block heterophilic interactions. |
| Monoclonal Antibody Isotype Control | An antibody of the same isotype but irrelevant specificity, used to differentiate specific signal from background in competition protocols. |
| Automated Plate Washer | Ensures consistent and reproducible washing across all wells, a critical factor in reducing CV and controlling background. |
| Pre-Coated, Validated ELISA Plates | Plates coated with optimized, quality-controlled capture antibody reduce protocol variability and lot-to-lot differences. |
Beyond the Single Assay: Validation, Comparison, and Advanced Quality Control
Troubleshooting Guide & FAQ
Q1: Our intra-assay CV values are consistently above 20%. What are the most likely causes and how can we resolve this?
A: High intra-assay CV (>20%) typically points to issues with plate handling, reagent addition, or sample preparation within a single run.
- Primary Cause: Inconsistent pipetting technique, particularly during serial dilution or reagent transfer.
- Solution: Implement rigorous pipette calibration (monthly) and use reverse pipetting for viscous reagents like serum or standards. Train all users on a standardized technique.
- Protocol: To diagnose, run a precision test plate using a single sample replicate across all wells. Calculate CV for ODs. If CV remains high, the issue is likely pipetting or plate washer variability. Use a single calibrated pipette and manual washing to isolate.
Q2: Inter-assay precision is failing between operators. How do we standardize protocols?
A: Inter-assay variability often stems from protocol deviations. Standardization is key.
- Solution: Create a detailed, step-by-step Standard Operating Procedure (SOP). Include exact incubation times (with tolerances of ±1 minute), orbital shaker speeds (in RPM), and defined room temperature ranges.
- Validation Protocol: Have 2-3 operators run the same plate layout (n=6 replicates of Low, Mid, High QC samples) on three separate days. Pool data to calculate inter-assay CV. Target CV should be <15% for most validated assays.
Q3: We see high background noise across all wells, skewing CV calculations. How to troubleshoot?
A: High background usually indicates inadequate washing or non-specific binding.
- Checkpoints:
- Washing: Ensure wash buffer contains the correct concentration of detergent (e.g., 0.05% Tween-20). Perform the recommended number of wash cycles (minimum 3x) with proper soaking time (30-60 seconds). Verify plate washer nozzles are not clogged.
- Blocking: Ensure blocking buffer (e.g., 1% BSA or 5% non-fat dry milk) is fresh and incubation time is sufficient (≥1 hour).
- Protocol: Run a "no primary antibody" or "no sample" control. If background is high, the issue is with the detection system or blocking. If background is normal, the issue is with the sample or capture antibody.
Q4: What are acceptable CV% thresholds for a validated ELISA in drug development?
A: Acceptance criteria depend on assay stage and biological context. Industry standards are summarized below.
| Assay Type / Stage | Acceptable Intra-Assay CV | Acceptable Inter-Assay CV | Basis |
|---|---|---|---|
| Discovery/Research | ≤ 20% | ≤ 25% | Preliminary data screening. |
| Pre-Clinical Validation | ≤ 15% | ≤ 20% | GLP-like environment for key biomarkers. |
| Clinical PK/PD Assay | ≤ 10-12% | ≤ 15-18% | Fit-for-purpose validation for pharmacokinetic data. |
| Diagnostic Assay | ≤ 10% | ≤ 12% | Stringent CLIA/CAP guidelines. |
Q5: How do we statistically validate that our CV is acceptable?
A: Use precision profile analysis across the assay range.
- Protocol: Run a minimum of 6 replicates of at least 5 different concentrations spanning the standard curve on the same plate (intra-assay) and on 3 different days (inter-assay). Calculate mean, SD, and CV% for each concentration. Plot CV% against concentration. The assay's working range is where the CV% is below your predefined acceptance threshold (e.g., 15%).
ELISA Precision Validation Protocol
Title: Determination of Intra-Assay and Inter-Assay Coefficient of Variation (CV%)
Objective: To establish the precision of an ELISA method by assessing repeatability (intra-assay CV) and intermediate precision (inter-assay CV).
Materials: (See "Scientist's Toolkit" below)
Procedure:
- QC Sample Preparation: Prepare three quality control (QC) samples at Low, Mid, and High concentrations within the dynamic range of the standard curve.
- Plate Layout: Design a plate with each QC sample replicated 6 times (n=6) per plate.
- Intra-Assay Precision: A single analyst runs one full plate following the SOP. Record all optical density (OD) values.
- Inter-Assay Precision: Three different analysts repeat Step 3 on three separate days, using fresh reagent preparations.
- Data Analysis:
- Calculate the mean and standard deviation (SD) for each QC level (n=6) within the single plate.
- Intra-Assay CV% = (SD / Mean) x 100 for each QC level on the single plate.
- Pool the data for each QC level across all three plates/runs (total n=18).
- Inter-Assay CV% = (SD of pooled means / Overall Mean) x 100 for each QC level.
The Scientist's Toolkit: Key Research Reagent Solutions
| Item | Function & Importance for Precision |
|---|---|
| Calibrated Micro-pipettes (2µL-1000µL) | Ensures accurate and reproducible liquid handling. Critical for making standards and adding samples/reagents. |
| Multichannel Pipette & Reagent Reservoirs | Enforces consistent addition of wash buffer, detection Ab, etc., across all wells, reducing row-to-row variability. |
| Pre-coated ELISA Plates (High-Binding) | Consistent plate coating is fundamental. Using commercially pre-coated plates removes a major source of inter-assay variance. |
| Lyophilized Standard & QC Control Sets | Provides a stable, consistent reference for generating the standard curve and monitoring assay performance over time. |
| Plate Washer (Automated) | Provides thorough and uniform washing, critical for reducing background and variability. Must be well-maintained. |
| Plate Reader with Temperature Control | Ensures consistent reading conditions. Must be validated for absorbance precision (OD CV < 1%). |
Precision Analysis Workflow
ELISA Precision Troubleshooting Decision Tree
This technical support center is designed to assist researchers in diagnosing and resolving issues related to poor replicate data across different ELISA platforms, a critical obstacle in reproducible bioanalysis and drug development.
Troubleshooting Guide & FAQs
Q1: Our coefficient of variation (CV) between replicates on a traditional manual ELISA is consistently >20%. What are the most likely causes?
A: High CV in manual assays is often due to pipetting inconsistency and inadequate washing.
- Primary Action: Calibrate and maintain pipettes monthly. Use reverse pipetting for viscous reagents like standards and samples.
- Protocol Verification: Follow this precise wash protocol:
- Aspirate each well completely using a vacuum manifold or multichannel pipette with fresh tips.
- Dispense 300 µL of wash buffer into each well without touching the plate bottom. Do not let wells dry.
- Let soak for 30 seconds.
- Repeat for a total of 5 washes. After final aspiration, firmly tap plate onto lint-free paper.
- Check: Ensure all reagents are equilibrated to room temperature (18-25°C) for 30 minutes before use to prevent condensation and temperature-based binding variation.
Q2: On our automated liquid handling platform, we see edge effects (higher signals in perimeter wells). How can we mitigate this?
A: This indicates uneven incubation temperature or evaporation during automated steps.
- Solution 1: Use a thermal sealer or plate lid during all incubations on the deck. Program the instrument to minimize open-plate time.
- Solution 2: Implement a plate layout that places blanks or controls on the perimeter, and calibrants/samples only in interior wells.
- Solution 3: Validate the deck's incubator uniformity with a temperature-mapping plate. The target is uniformity within ±0.5°C.
Q3: In digital ELISA (e.g., Simoa), we observe high background in our negative controls. What steps should we take?
A: High background in digital platforms often stems from non-specific binding or bead aggregation.
- Troubleshooting Steps:
- Increase Wash Stringency: Increase the number of washes post-capture and post-detection. Add 0.05% Tween-20 or a mild detergent alternative.
- Optimize Blocking: Use a proprietary protein-based blocking buffer (e.g., Blocker Casein) instead of BSA. Increase blocking time to 2 hours.
- Filter Beads: Sonicate the paramagnetic bead suspension for 30 seconds and then pass it through a 5 µm filter immediately before use to remove aggregates.
- Check Detector: Perform a system performance test with calibrators to ensure the instrument optics are within specification.
Q4: How do I choose between platforms when precision for a low-abundance biomarker is the primary goal?
A: Base the decision on the required sensitivity and precision at the expected concentration.
| Platform | Typical Dynamic Range | Typical Lower Limit of Detection (LLoD) | Typical Inter-Assay CV at LLoD | Best Use Case |
|---|---|---|---|---|
| Traditional Manual | 3-4 logs | High pg/mL | 15-25% | High-abundance targets, limited budget, flexible protocols. |
| Automated | 3-4 logs | High pg/mL | 8-15% | Medium-to-high throughput, standardized assays, reducing human error. |
| Digital ELISA | 4+ logs | Low fg/mL | <10% | Ultra-sensitive detection of low-abundance biomarkers (e.g., plasma cytokines, neurology biomarkers). |
Q5: What is the most critical step to ensure good replicate agreement across all platforms?
A: Consistent sample and reagent handling. Vortex all liquid reagents (except standards) gently before use. For samples, use a consistent thawing protocol (ice/RT) and avoid repeated freeze-thaw cycles. Centrifuge all sample and reagent vials briefly before opening to concentrate liquid at the bottom.
Experimental Protocol: Cross-Platform Precision Comparison
Objective: To systematically evaluate inter-assay and intra-assay precision (CV%) across Traditional, Automated, and Digital ELISA platforms.
Materials & Reagents (The Scientist's Toolkit):
| Item | Function & Critical Note |
|---|---|
| Validated ELISA Kit | Ensure the same clone pair is used across all platforms for comparability. |
| Reference Serum Sample | Pooled, aliquoted, and stored at -80°C. The analyte should be in mid-range of all platforms. |
| Calibrator Diluent Matrix | Must match sample matrix (e.g., serum/plasma). |
| Low-Bind Microplates/Tubes | Essential for digital ELISA to prevent analyte loss. |
| Calibrated Pipettes (P2-P1000) | For manual steps; require recent calibration certificates. |
| Automated Liquid Handler | e.g., Hamilton STARlet, equipped with washer and heater/shaker. |
| Digital ELISA Analyzer | e.g., Quanterix Simoa HD-X or ELLA. |
| Plate Reader (Spectrophotometer) | For traditional/automated readout. Must be validated for precision. |
Methodology:
- Sample Preparation: Thaw one aliquot of reference serum on wet ice. Prepare a 1:2 dilution series in the appropriate matrix to generate 5 concentrations spanning the assay range. Keep on ice.
- Platform Runs: Run each dilution in 8 replicates on each platform in a single run (intra-assay). Repeat this entire process on 3 separate days (inter-assay).
- Traditional: Execute protocol per kit instructions manually.
- Automated: Program the method on the liquid handler, ensuring homogenization steps for beads/reagents.
- Digital: Follow the specific singleplex assay protocol for the analyzer.
- Data Analysis: Calculate the mean concentration, standard deviation (SD), and CV% for each dilution level for both intra- and inter-assay. Plot CV% vs. concentration.
ELISA Workflow & Data Integrity Checkpoints
Title: ELISA Protocol with Critical Quality Control Checkpoints
Platform Decision Logic for Optimal Replicate Data
Title: Decision Tree for Selecting an ELISA Platform Based on Research Goals
Statistical Methods for Outlier Identification and Handling in Replicate Data Sets
Technical Support Center: Troubleshooting ELISA Replicate Data
Troubleshooting Guides
Guide 1: Identifying Outliers in ELISA Replicate Sets
- Issue: High coefficient of variation (CV) between replicates, making data unreliable for interpretation.
- Solution: Systematically apply statistical methods to detect outliers before deciding on handling strategies. Begin with exploratory data analysis (visual inspection via box plots), then proceed to formal statistical tests.
Guide 2: Handling Missing Data Post-Outlier Removal
- Issue: After removing an outlier, the remaining replicate number is insufficient for robust analysis.
- Solution: Implement data imputation techniques cautiously or redesign the experiment. For critical assays, repeating the sample is the preferred action.
Frequently Asked Questions (FAQs)
Q1: My ELISA data has one replicate that is far from the other two. Should I discard it immediately? A: No. Arbitrary removal biases results. First, check for technical errors (pipetting, well defect). If none are found, apply an objective statistical outlier test (e.g., Grubbs' test for N=3 replicates) to inform your decision.
Q2: Which statistical test is most appropriate for identifying outliers in a small set of ELISA replicates (e.g., n=3 or n=4)? A: For very small sample sizes (n=3-7), the Grubbs' test (Maximum Normed Residual Test) is commonly recommended. For larger replicate sets (n>7), the Dixon's Q test can be efficient. The table below summarizes key tests.
Q3: How do I handle the outlier once it is identified? A: You have three main options:
- Remove: If a clear technical error is identified.
- Replace/Impute: Using methods like mean/median of remaining replicates, or regression imputation—but document this thoroughly.
- Winsorize: Cap the outlier value to the next highest/least extreme value in the set. This retains the data point but reduces its influence.
Q4: Could an "outlier" be a true biological signal? A: Yes, especially in heterogeneous samples. Do not automatically discard outliers from biological replicates without investigating the biological context. The issue is more clear-cut for technical replicates.
Data Presentation
Table 1: Common Statistical Tests for Outlier Detection in Replicate Data
| Test Name | Recommended Sample Size (n) | Key Principle | Advantage | Disadvantage |
|---|---|---|---|---|
| Grubbs' Test | 3 ≤ n ≤ 25 | Compares the deviation of the suspected outlier from the sample mean to the sample standard deviation. | Well-established for small lab experiment replicates. | Assumes approximately normal data. Less effective for masking (multiple outliers). |
| Dixon's Q Test | 3 ≤ n ≤ 30 | Uses the range of data to assess the gap between the suspect point and its nearest neighbor. | Simple, designed for small data sets. | Statistically less powerful than Grubbs'. Different formulas for different n. |
| Modified Z-Score (IQR-based) | n ≥ 10 | Uses median and interquartile range (IQR), making it non-parametric. | Robust to non-normal data and less affected by multiple outliers. | Requires larger n to reliably estimate median and IQR. |
| Chauvenet's Criterion | n ≥ 4 | Defines a cutoff based on the probability a data point will occur given a normal distribution. | Simple conceptual framework. | Criticized for being somewhat arbitrary; can be overly permissive. |
Table 2: Common Outlier Handling Methods & Impact on ELISA Data
| Method | Description | Impact on Mean | Impact on SD/CV | When to Use |
|---|---|---|---|---|
| Deletion | Complete removal of the outlier data point. | Can increase or decrease. | Usually decreases. | Clear technical fault is known. |
| Mean Imputation | Replace outlier with mean of remaining replicates. | Unchanged. | Artificially reduces. | Generally discouraged; biases variance. |
| Median Imputation | Replace outlier with median of remaining replicates. | May change slightly. | Reduces, but less than mean imputation. | Preferable to mean imputation for skewed data. |
| Winsorization | Capping the outlier at a percentile (e.g., 90th) of the remaining data. | Reduces skew. | Provides a robust estimate. | When you want to retain sample size but limit influence of extreme points. |
Experimental Protocols
Protocol 1: Systematic Outlier Assessment for ELISA Technical Replicates (n=6)
- Data Collation: Arrange optical density (OD) values for each sample's replicates.
- Visual Inspection: Generate a box plot for each sample's replicates to identify potential outliers visually.
- Normality Check: Perform the Shapiro-Wilk test on the replicate set. If p > 0.05, assume normality.
- Outlier Test: For normally distributed data, apply Grubbs' test iteratively.
- Calculate G = |(suspect value - sample mean)| / sample standard deviation.
- Compare G to the critical value for n=6 and α=0.05 (two-tailed). If G > critical value, flag as outlier.
- Action & Documentation: If flagged, investigate the well for errors. Document the statistical result and the final action (remove, cap, retain).
Protocol 2: Robust Central Tendency Estimation After Outlier Handling
- Handle Identified Outliers: Use Winsorization (capping at 5th and 95th percentiles of the sample's replicates).
- Calculate Robust Summary: Compute the median and interquartile range (IQR) of the treated replicate set for each sample.
- Report Variability: Express variability as Median Absolute Deviation (MAD) or IQR instead of Standard Deviation, as they are less sensitive to remaining extreme values.
Visualizations
Title: ELISA Outlier Analysis Decision Workflow
Title: Taxonomy of Outlier Handling Methods
The Scientist's Toolkit: Research Reagent Solutions
Table 3: Essential Materials for Robust ELISA Replicate Experiments
| Item | Function/Benefit | Key Consideration for Replicate Quality |
|---|---|---|
| Electronic Multichannel Pipette | Ensures highly consistent volume delivery across multiple replicate wells simultaneously. Reduces pipetting fatigue error. | Regular calibration is mandatory. Use reverse pipetting for viscous reagents. |
| Low-Binding Microplates | Minimizes non-specific protein adsorption, improving well-to-well consistency of analyte capture. | Essential for dilute samples or assays with marginal signal. |
| Pre-aliquoted Reagent Kits | Reduces inter-assay variability caused by freeze-thaw cycles or lot-to-lot differences mid-study. | Aliquots should be single-use to prevent degradation. |
| Precision ELISA Plate Washer | Provides consistent and thorough washing between steps, critical for reducing background variance. | Validate wash cycle efficiency and check for clogged dispensers daily. |
| Plate Reader with Shaking Incubation | Ensures even color development by maintaining consistent reagent mixing during incubation steps. | Calibrate optical path and ensure consistent temperature across the plate. |
| Statistical Software (e.g., R, GraphPad Prism) | Provides built-in functions for rigorous outlier tests (Grubbs', Dixon's) and robust data visualization. | Researchers must understand the assumptions and limitations of each test applied. |
| Liquid Handling Robot | Automates reagent dispensing and sample transfer, eliminating human error as a major source of outlier replicates. | High initial cost; requires precise programming and maintenance. |
Correlation with Orthogonal Methods (e.g., MSD, Western Blot) to Confirm Specificity
Troubleshooting Guide & FAQs: Validating ELISA Specificity in the Context of Poor Replicate Data
This support center addresses common challenges researchers face when using orthogonal methods to confirm ELISA specificity, a critical step in diagnosing causes of poor replicate data.
Frequently Asked Questions (FAQs)
Q1: Our ELISA data shows high inter-assay variability. When we use Western Blot to validate, the bands are inconsistent. What could be the root cause? A: This often points to sample integrity or preparation issues common to both techniques. For ELISA, freeze-thaw cycles can degrade analyte epitopes. For Western Blot, improper lysis buffer (e.g., missing protease/phosphatase inhibitors) or uneven heating before SDS-PAGE can cause variability. Standardize sample aliquots and preparation protocols for both methods.
Q2: We suspect cross-reactivity in our sandwich ELISA. How can Meso Scale Discovery (MSD) electrochemiluminescence help confirm this? A: MSD's distinct capture spots allow for multiplexing. You can co-immobilize the suspected cross-reactive antigen alongside your target on the same plate. A signal from the cross-reactive spot, when using your ELISA capture antibody, confirms cross-reactivity. MSD's broader dynamic range also helps identify low-level off-target binding that ELISA may miss.
Q3: ELISA shows a significant signal, but Western Blot shows no band. What are the primary troubleshooting steps? A: Follow this diagnostic pathway:
- Check Antibody Compatibility: Confirm the Western Blot antibody recognizes denatured, linearized epitopes (ELISA often detects native, conformational epitopes).
- Verify Sample Treatment: Ensure complete protein denaturation and reduction for Western Blot.
- Optimize Transfer Efficiency: Use Ponceau S staining post-transfer to confirm successful protein migration to the membrane.
- Consider Sensitivity: The analyte concentration may be below the detection limit of your Western Blot but within ELISA's sensitive range.
Q4: For phospho-protein ELISAs, what is the best orthogonal method to confirm specificity, and what is a critical control? A: Western Blot with phospho-specific antibodies remains the gold standard. The critical control is to treat a sample aliquot with a phosphatase (e.g., Lambda phosphatase) prior to analysis. The signal should be abolished in both the phospho-ELISA and the phospho-Western Blot, confirming specificity for the phosphorylated state.
Q5: How do we correlate quantitative data from ELISA (concentration) with semi-quantitative data from Western Blot (band intensity)? A: Generate a standard curve using recombinant protein or a calibrated lysate analyzed on the same blot and ELISA plate. Plot band density (OD) against known concentration. Use this to interpolate concentrations from Western Blot bands for comparison. Statistical correlation (e.g., Pearson's r) should be performed on log-transformed data.
Experimental Protocols for Orthogonal Validation
Protocol 1: Parallel Sample Analysis for ELISA & Western Blot
- Sample Prep: Prepare a master sample aliquot. Split for parallel processing.
- ELISA Arm: Dilute sample per kit protocol. Run in technical triplicate.
- Western Blot Arm: Mix sample with Laemmli buffer + 5% β-mercaptoethanol. Heat at 95°C for 5 minutes (critical). Load 20-40 µg total protein alongside a prestained ladder and positive control.
- Gel & Transfer: Use 4-20% gradient gel. Transfer to PVDF using semi-dry transfer at 2.5 mA/cm² for 30 minutes.
- Detection: Block (5% BSA in TBST), incubate with primary Ab (1:1000, overnight, 4°C), HRP-secondary (1:5000, 1h), and chemiluminescent substrate. Image with a CCD system.
- Analysis: Quantify bands using ImageJ. Normalize to loading control.
Protocol 2: Cross-Reactivity Check Using MSD MULTI-ARRAY Plates
- Plate Coating: Spot capture antibodies for both target and suspected cross-reactant onto different spots in the same well of an MSD plate.
- Blocking: Block with MSD Blocker A for 1h.
- Sample Incubation: Incubate sample per protocol.
- Detection: Use SULFO-TAG labeled detection antibody.
- Reading: Read on MSD Imager. Analyze spot-specific signals.
Data Presentation: Correlation Between Methods
Table 1: Example Correlation Data for Cytokine X Measurement (n=12 samples)
| Sample ID | ELISA Conc. (pg/mL) | MSD Conc. (pg/mL) | % Difference | Western Blot (Relative Density) | Pass/Fail Specificity Check |
|---|---|---|---|---|---|
| 1 | 150.2 | 142.5 | 5.1% | 1.45 | Pass |
| 2 | 1205.7 | 980.3 | 18.7% | 8.92 | Investigate |
| 3 | 45.6 | 48.1 | 5.5% | 0.35 | Pass |
| ... | ... | ... | ... | ... | ... |
| Statistical Summary | Mean: 455.3 | Mean: 420.1 | Mean Diff: 9.8% | Correlation (r): 0.92 | Pass Rate: 83% |
Table 2: Troubleshooting Matrix for Discrepant Results
| Symptom | Likely Cause (ELISA) | Orthogonal Test Action | Expected Result if Cause is Confirmed |
|---|---|---|---|
| High ELISA, Low/Negative WB | Conformational epitope | Dot Blot under non-denaturing conditions | Positive Dot Blot |
| High Variability in Replicates | Plate washing inconsistency | MSD (washes inherently more consistent) | Low CV in MSD data |
| High Background | Matrix interference | Spike-and-recovery in MSD | Recovery outside 80-120% range |
Visualization: Experimental Workflow
Title: ELISA Specificity Validation Workflow
Title: Multi-Method Correlation Strategy
The Scientist's Toolkit: Research Reagent Solutions
Table 3: Essential Reagents for Orthogonal Specificity Validation
| Item | Function in Validation | Key Consideration |
|---|---|---|
| Phosphatase Inhibitor Cocktail | Preserves phospho-epitope integrity in samples for phospho-ELISA/WB comparison. | Must be added to both ELISA dilution buffer and RIPA lysis buffer. |
| Recombinant Protein Standard | Provides a universal calibrator for cross-method correlation (ELISA, MSD, WB). | Ensure it matches the native protein's form (e.g., glycosylated). |
| Lambda Protein Phosphatase | Critical control reagent to validate phospho-specific antibody signals. | Treatment should abolish signal in both assays. |
| HRP-Conjugated Secondary Antibodies | Detection for both Western Blot and some ELISA kits. | Use different species-specific secondaries to avoid cross-talk in multiplex MSD. |
| MSD Blocker A & Diluent 100 | Optimized buffers for MSD assays to minimize non-specific binding. | Superior for difficult matrices (e.g., serum, lysates) vs. standard ELISA buffer. |
| PVDF Membrane (0.45 µm) | For Western Blot transfer. Higher protein binding capacity than nitrocellulose. | Must pre-activate in methanol before use. |
| Chemiluminescent Substrate (Enhanced) | Increases Western Blot sensitivity to better match ELISA's low detection limit. | Choose one with a wide linear dynamic range for quantification. |
Technical Support Center: Troubleshooting ELISA Poor Replicate Data
This support center provides targeted guidance for resolving issues leading to poor replicate data in ELISA, a core challenge for longitudinal study integrity.
FAQs & Troubleshooting Guides
Q1: Our positive control replicates show high variability (%CV >15%) between plates in a longitudinal study. How can we determine if this is due to reagent lot changes or procedural inconsistency?
A: This is a classic sign of system instability. Implement a dual-level QC system using reference samples.
- Protocol: Longitudinal QC with Reference Samples
- Prepare Reference Samples: Create a pooled sample from your study matrix (e.g., serum, cell culture supernatant) with high, mid, and low analyte concentrations. Aliquot and store at ≤ -70°C for the study's duration.
- Establish Baseline: In the first assay run, include all three reference sample levels in duplicate. Repeat this for 5-10 independent runs to establish a mean and acceptable range (e.g., mean ± 2SD or 20% deviation).
- Implement Acceptance Criteria: For each subsequent run, the duplicate values for each reference sample must fall within the pre-defined range, and the %CV between duplicates must be <10%. Failure indicates the run is invalid.
- Monitor Trends: Plot the OD or concentration of each reference sample over time (a Levey-Jennings chart) to visualize drift.
Q2: We have defined acceptance criteria, but our longitudinal data still shows unexplained spikes. What internal controls can we add?
A: Acceptance criteria must extend beyond single-point controls. Integrate a full standard curve QC.
- Protocol: Standard Curve Quality Parameters
For every run, calculate and enforce these criteria for the standard curve:
- R² ≥ 0.99 for the fitted curve.
- %Bias at Lower Limit of Quantification (LLOQ): ≤ 20% (Calculate: [(Measured Concentration - Expected Concentration) / Expected Concentration] * 100).
- Signal-to-Noise Ratio at LLOQ: > 5 (Mean LLOQ OD / Mean Zero Standard OD).
Q3: How do we systematically differentiate between poor replicates caused by pipetting error versus plate washing inconsistency?
A: Follow this diagnostic workflow.
Diagram Title: Diagnostic Path for ELISA Replicate Variability
Q4: What are the critical parameters to track for each new lot of ELISA kits in a multi-year study?
A: Always perform a parallel comparison between the old and new lot. Key quantitative data to collect:
Table 1: Critical Parameters for ELISA Kit Lot Comparison
| Parameter | Target Acceptance Criterion | Action if Failed |
|---|---|---|
| Mean Reference Sample Recovery (High, Mid, Low) | 80-120% of previous lot mean | Re-calibrate with new lot or reject. |
| Assay Sensitivity (LLOQ) | Not statistically different (t-test, p>0.05) | Re-establish study LLOQ. |
| Mid-range Standard %CV (n=8 replicates) | <10% | Indicates poorer precision. |
| Plate Background OD | Not significantly higher | May increase signal-to-noise issues. |
The Scientist's Toolkit: Essential QC Reagents & Materials
Table 2: Research Reagent Solutions for ELISA QC
| Item | Function & Rationale |
|---|---|
| Pooled Study Matrix Reference Samples (High, Mid, Low) | Monitor inter-assay precision and longitudinal drift. Controls for sample matrix effects. |
| Commercial QC Sera (Assayed & Unassayed) | Provides an independent, third-party performance verification against kit controls. |
| Liquid Stable Calibrators | Reduces variation introduced by reconstitution of lyophilized standards. Essential for curve stability. |
| Precision Pipettes & Calibrated Tips | Ensures accurate and consistent liquid delivery, the most common source of replicate error. |
| Microplate Reader with Maintenance Log | Regular calibration and maintenance prevent instrumental drift as a source of error. |
| Plate Washer Validation Kit (e.g., fluorescence or dye-based) | Objectively confirms uniform wash performance across all wells. |
Protocol: Implementing a Plate Washer Validation
- Prepare a solution of a fluorescent dye (e.g., fluorescein) in assay buffer.
- Add equal volumes to all wells of a microplate.
- Run a standard wash cycle.
- Measure residual fluorescence in each well.
- Calculate %CV across the plate. A %CV > 15% indicates non-uniform washing requiring maintenance.
Diagram Title: Three-Layer QC System for Longitudinal ELISA Data
Welcome to the ELISA Technical Support Center. This resource, framed within our broader thesis on the causes of poor replicate data in ELISA research, provides targeted troubleshooting and FAQs to help researchers, scientists, and drug development professionals achieve robust, reproducible results.
Troubleshooting Guides & FAQs
Q1: Why do I see high variability (%CV > 20%) between my technical replicates?
A: High inter-assay CV is a primary symptom of poor reproducibility. Common causes and solutions are tabled below.
| Cause | Diagnostic Check | Corrective Action |
|---|---|---|
| Inconsistent Pipetting | Check calibration logs; use a dye solution to test technique. | Use calibrated, serviced pipettes; train personnel; use reverse pipetting for viscous samples. |
| Inadequate Plate Washing | Inspect wells for residual droplets or uneven meniscus. | Use a calibrated washer; ensure proper buffer volume; soak for 30-60 sec; blot firmly on clean towels. |
| Uneven Coating or Blocking | Check for bubbles during coating; test edge vs. center well signals. | Use sufficient volume; seal plate during incubation; incubate at 4°C overnight for even coating. |
| Poor Standard Curve Preparation | Review serial dilution logs; plot curve—R² should be >0.99. | Prepare fresh stock; use low-protein-binding tubes; perform dilutions in bulk when possible. |
Q2: My standard curve is acceptable, but my sample values are inconsistent across runs. What's wrong?
A: This indicates sample-specific or procedural drift issues.
| Cause | Diagnostic Check | Corrective Action |
|---|---|---|
| Sample Matrix Effects | Spike-and-recovery test (should be 80-120%). | Dilute sample in assay buffer/blank matrix; use a validated sample diluent. |
| Reagent Temperature | Check timestamps; was all reagent brought to room temp uniformly? | Thaw reagents completely; mix gently; equilibrate ALL reagents (including plate) for 30 min. |
| Varied Incubation Times | Audit SOP timing steps across personnel. | Use a timer for every step; standardize "start-to-start" timing for adding reagents across wells. |
Q3: My assay sensitivity is lower than expected. How can I improve it?
A: Sensitivity is determined by the standard curve's lower limit of detection (LLOD). Key factors:
| Factor | Protocol Detail | Optimization Method |
|---|---|---|
| Antibody Pair Affinity | Check vendor datasheet for matched pair recommendation. | Titrate both capture and detection antibodies to find optimal signal-to-noise ratio. |
| Signal Amplification | Review substrate incubation time and stability. | Switch to a high-sensitivity substrate (e.g., chemiluminescent); optimize incubation time in the dark. |
| Reader Settings | Verify instrument calibration and filter settings. | Use the correct wavelength; ensure the plate reader is serviced and has a stable light source. |
Detailed Protocol: ELISA for Reproducible Quantification
Title: Direct Sandwich ELISA Protocol for Cytokine Detection
Principle: A capture antibody immobilized on a plate binds the target analyte. A detection antibody, conjugated to an enzyme (e.g., HRP), binds a different epitope. Enzyme substrate produces a signal proportional to analyte concentration.
Materials: Coating Buffer (0.1 M Carbonate-Bicarbonate, pH 9.6), Wash Buffer (PBS with 0.05% Tween-20), Blocking Buffer (5% BSA in PBS), Assay Diluent (1% BSA in PBS), TMB Substrate, Stop Solution (1M H₂SO₄).
Procedure:
- Coating: Dilute capture antibody in coating buffer. Add 100 µL/well. Seal plate. Incubate overnight at 4°C.
- Washing: Aspirate well contents. Wash 3x with >300 µL wash buffer per well using a multichannel pipette or plate washer. Blot plate on lint-free paper.
- Blocking: Add 300 µL blocking buffer per well. Incubate for 2 hours at room temperature (RT). Wash 3x.
- Sample/Standard Addition: Prepare standard dilutions in assay diluent in bulk. Add 100 µL of standard or prepared sample per well. Incubate 2 hours at RT. Wash 5x.
- Detection Antibody Addition: Add 100 µL of HRP-conjugated detection antibody (diluted in assay diluent) per well. Incubate 1-2 hours at RT. Wash 7x.
- Substrate Addition: Add 100 µL of TMB substrate per well. Incubate in the dark for 5-30 minutes.
- Stop Reaction: Add 50 µL stop solution per well. Gently tap plate to mix.
- Read: Measure absorbance at 450 nm (reference 570 nm or 620 nm) within 30 minutes.
Visualizing the Workflow & Problem-Solving
The Scientist's Toolkit: Key Research Reagent Solutions
| Item | Function & Importance for Reproducibility |
|---|---|
| Calibrated Micropipettes | Ensures accurate and precise liquid handling. Regular calibration (every 3-6 months) is non-negotiable. |
| Low-Protein-Binding Tips/Tubes | Minimizes analyte loss due to surface adsorption, critical for dilute samples and standards. |
| Precision Plate Washer | Provides consistent and thorough washing, removing unbound material while preserving immobilized complexes. |
| Spectrophotometric Plate Reader | Accurately measures endpoint absorbance. Requires regular maintenance and validation with a neutral density filter. |
| Matched Antibody Pair | A validated, high-affinity capture/detection pair specific for the target analyte is the core of a sensitive, specific assay. |
| Lyophilized Standard | Provides a stable, quantifiable reference for generating the standard curve. Reconstitution protocol must be strictly followed. |
| Blocking Agent (e.g., BSA) | Saturates uncovered protein-binding sites to prevent non-specific adsorption of detection reagents. |
| Stable Chemiluminescent Substrate | Offers a high signal-to-noise ratio and wide dynamic range for enhanced sensitivity compared to colorimetric substrates. |
| Detailed SOP Document | The single source of truth specifying every step, reagent lot tracking, equipment settings, and acceptance criteria. |
Conclusion
Achieving consistent, reliable ELISA replicate data is not a matter of luck but the result of systematic understanding, meticulous methodology, proactive troubleshooting, and rigorous validation. By addressing foundational sources of variability, adhering to best practices in sample and reagent handling, employing a structured diagnostic approach to high CVs, and validating data within a broader quality framework, researchers can significantly enhance the precision and credibility of their findings. As assays evolve towards higher sensitivity and automation, the principles of careful experimental design and robust quality control remain paramount. Implementing these strategies ensures that ELISA data is a solid foundation for scientific discovery, robust biomarker validation, and confident decision-making in the drug development pipeline.